How Can We Help?
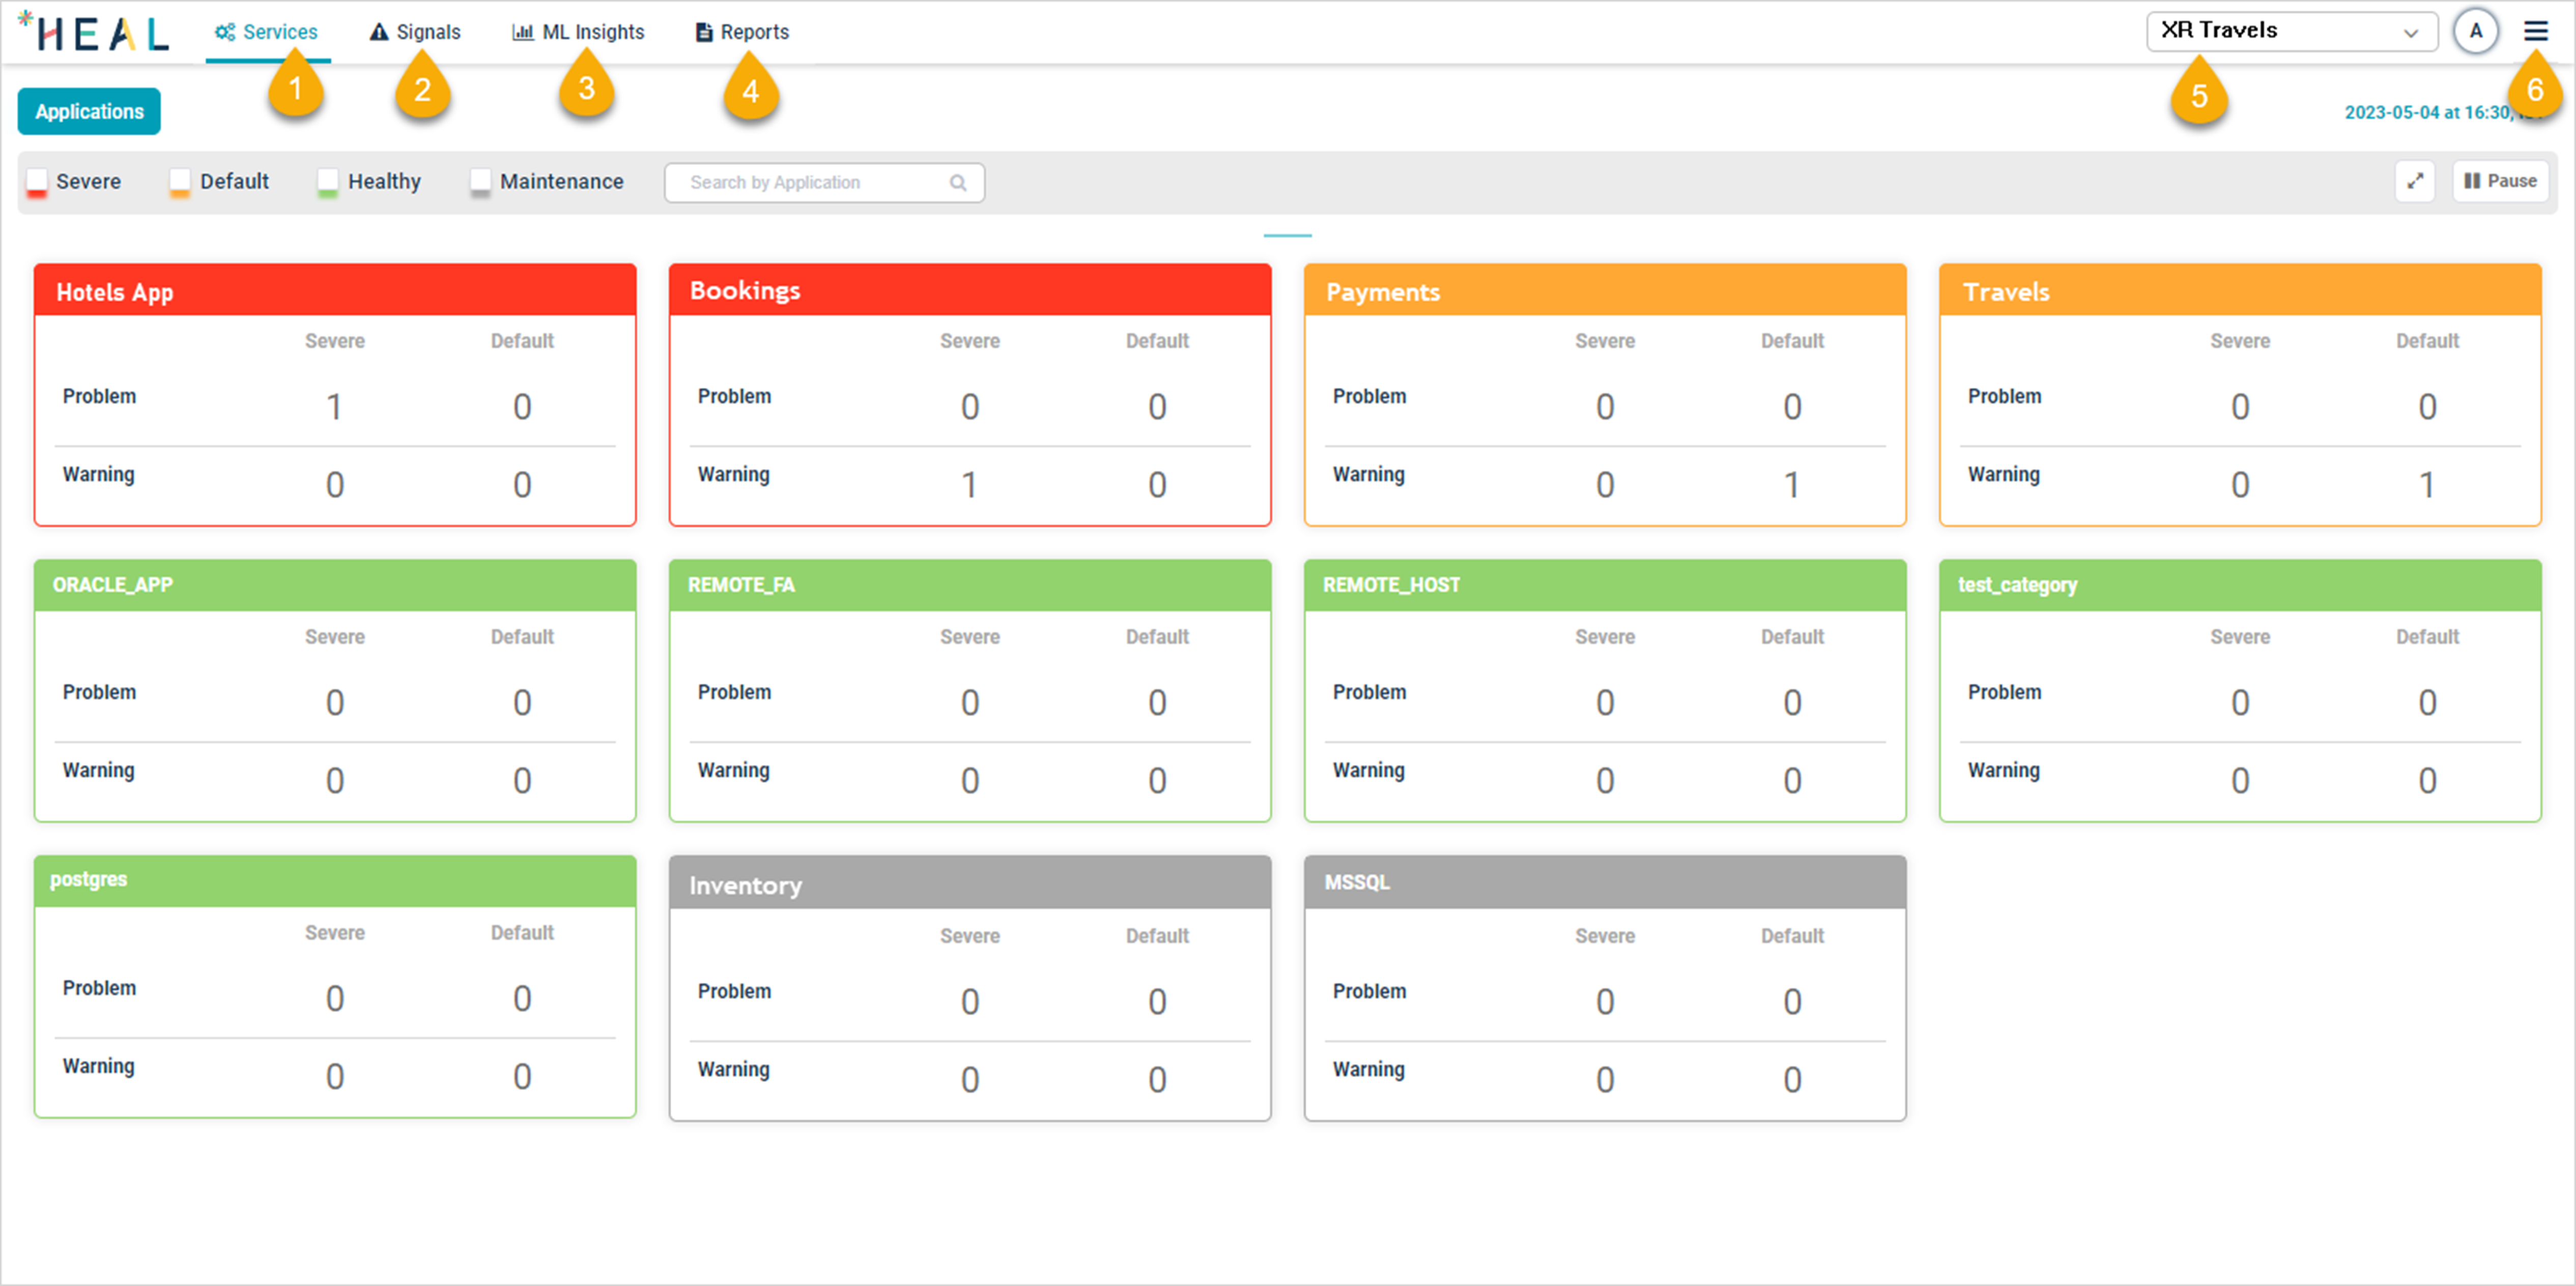
Access the HEAL UI by signing in with your credentials. The default screen is the Application Health Dashboard (CXO Dashboard), which offers an overview of the health and signals of configured applications across environments.

Application Health Dashboard (CXO Dashboard)
Key dashboard elements:
| Field | Description | Documentation Link |
|---|---|---|
| 1 – Services Tab | Displays component instances running on one or multiple host instances. | Services Tab |
| 2 – Signals Tab | Shows Problems and Early Warnings to help address potential issues. | Signals Tab |
| 3 – ML Insights Tab | Provides data-driven predictions and recommendations based on performance. | ML Insights Tab |
| 4 – Reports Tab | Offers comprehensive reports on applications, infrastructure, and services. | Reports Tab |
| 5 – Account Selection drop-down | Lists account names, tying Applications, Services, and instances together for an organization. | |
| 6 – My Profile | Allows editing your profile, accessing external links, and logging out of the HEAL application. |
By familiarizing yourself with these key elements and functionalities of the HEAL UI, you can effectively monitor, analyze, and optimize your IT infrastructure for a seamless and efficient user experience.