How Can We Help?
Introduction
In a data center, applications are dependent on infrastructure components in order to function. The infrastructure components have different configurations depending on the types of applications hosted. The main types of infrastructure required for an application to work are:
- Network
- OS
- Storage
- Database
- Application or Web servers
There might be changes in configurations that may cause the application to behave in a different way than before. For example, an OS patch upgrade may cause an application to run slower for the same load as earlier without any changes to the code. Sometimes the history of such changes is not maintained effectively. There might be human-induced errors in making changes to the configuration files. In such cases, it can be difficult to check when the changes were made and what the changes were. HEAL application provides a feature called Configuration Watch to monitor configurations for a chosen set of infrastructure components. The purpose of the configuration watch is to track any system changes; and drift tracking. If the state of the server changes over time, it might affect the system’s state. Configuration watch gives a difference or a comparison between the previous state of the system to the current state. System snapshot is taken at a certain time interval and it is compared with the current snapshot. It helps you address issues by rolling back changes. The periodicity of the snapshot collection is configurable.
Types of Configuration Watch
The types of the configuration watch are as follows:
- Property Watch
It monitors property files (.prop, .conf). Property files contain key value pairs. It detects if there are any changes in the properties, the time the change was detected.
- File Watch
It monitors all files in the system. It detects if any file(s) was changed, timestamp of the file and the time change was detected.
- Query Watch
It monitors configuration values stored in the database. You can obtain configuration values stored as key-value pairs in the database by running queries on config tables.
Config Watch KPI
Config Watch KPI Summary
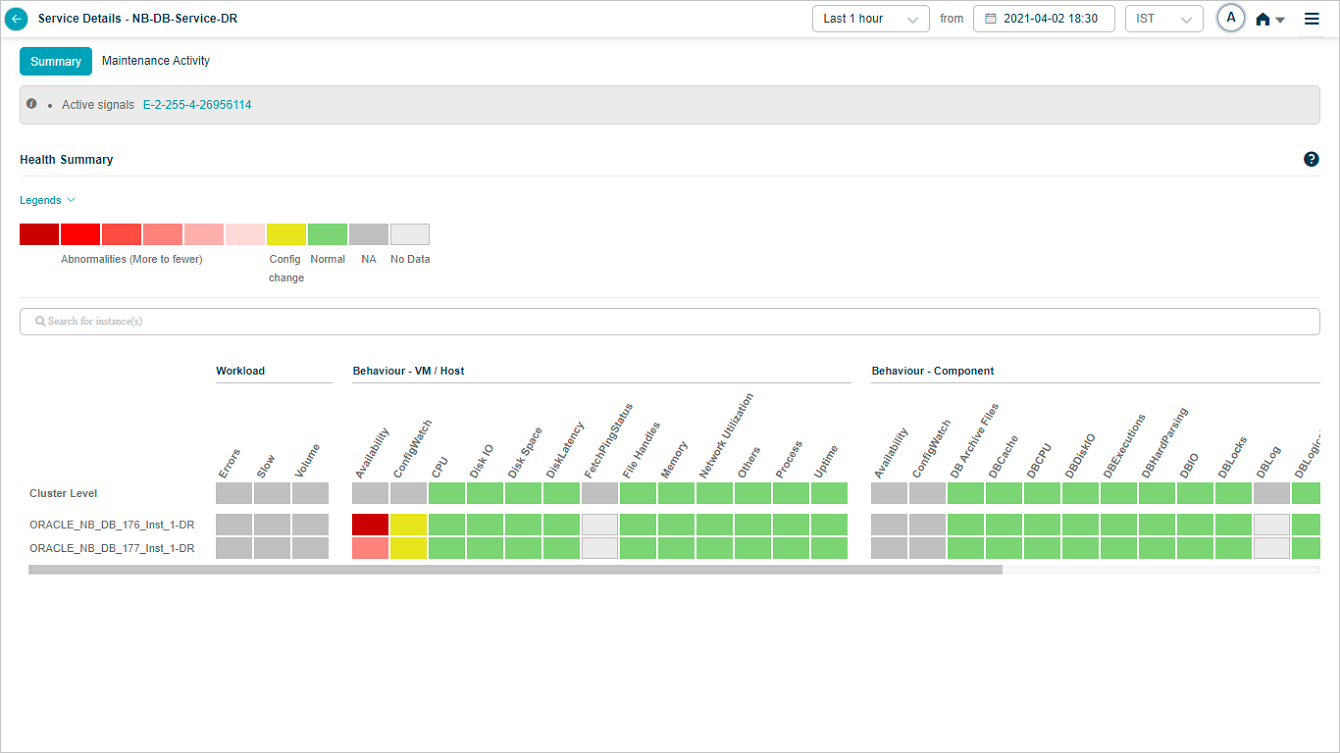
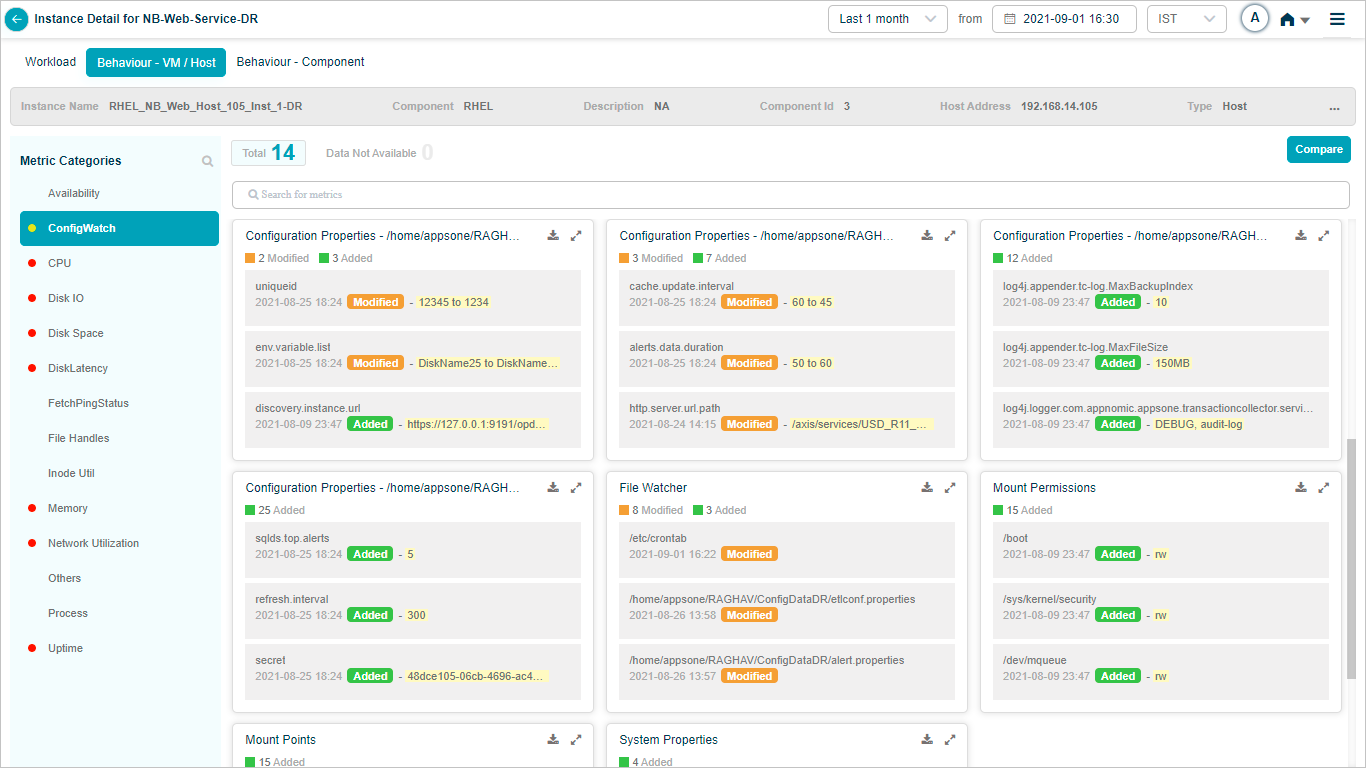
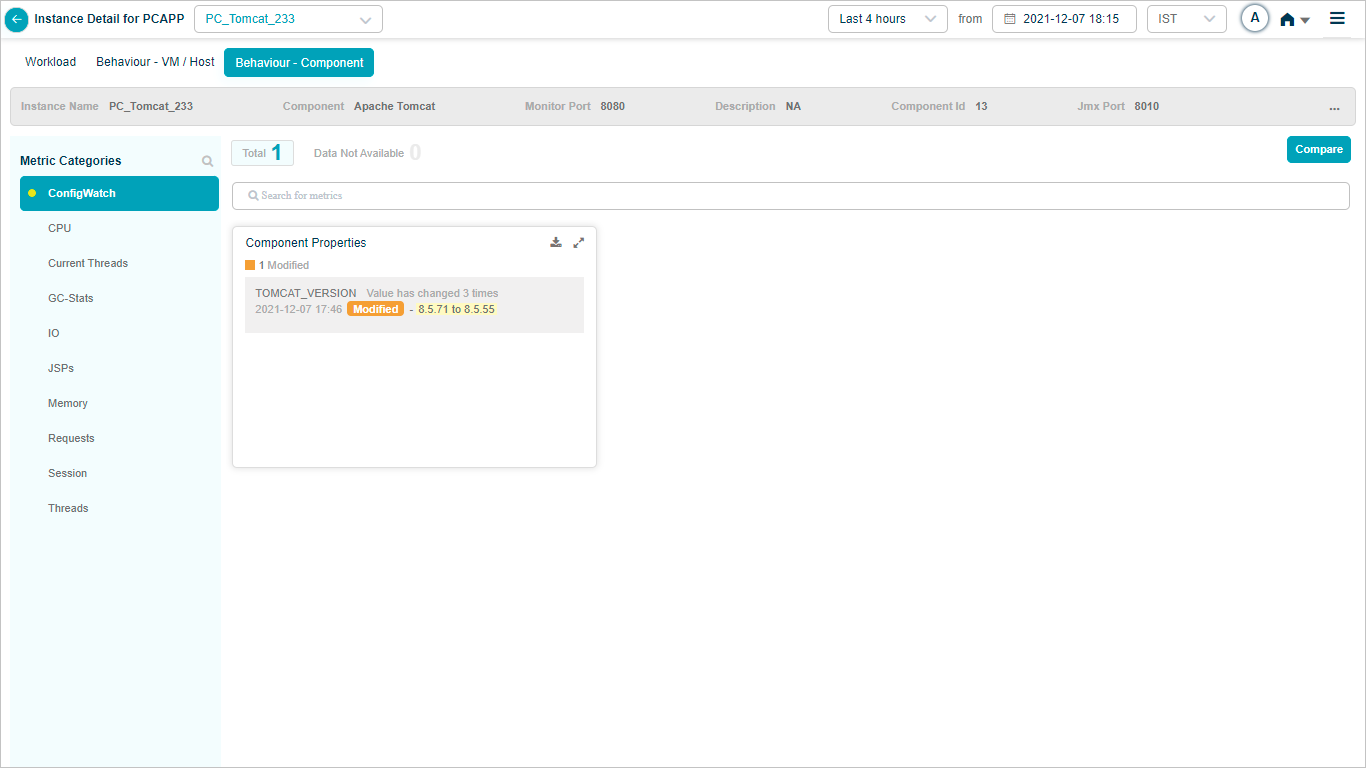
Configwatch KPI is applicable at instance level only. If there is any change in the configuration for any instance, corresponding block is displayed in yellow color. It indicates Config Watch has identified a change. The color remains the same irrespective of the number of changes that have occurred during the selected time period. Config Watch detects the changes at KPI collection interval. You can update the collection interval. Select on the block to display changes in configurations.
Viewing Configuration Properties
Instance Detail_Behaviour
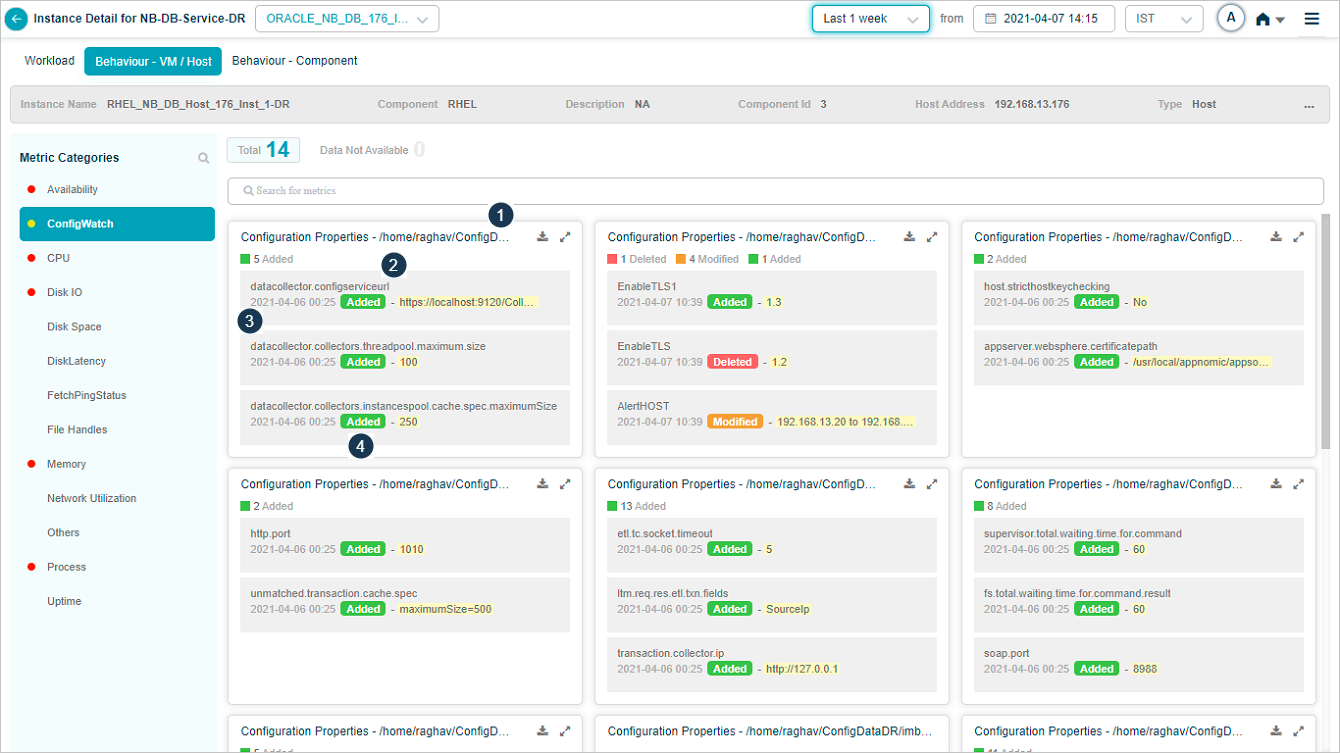
| 1 | This displays a Property file containing key value pairs. |
| 2 | This displays the key name. |
| 3 | This displays the timestamp at which a key was added/deleted/modified. |
| 4 | This displays the last action taken on a property in the file: 1) Added: A new property is added to the configuration file. 2) Deleted: A property is deleted from the file. 3) Modified: Value of a property is updated. Last status of the property is displayed till any further action is taken. |
| 5 | This displays current value of the property. |
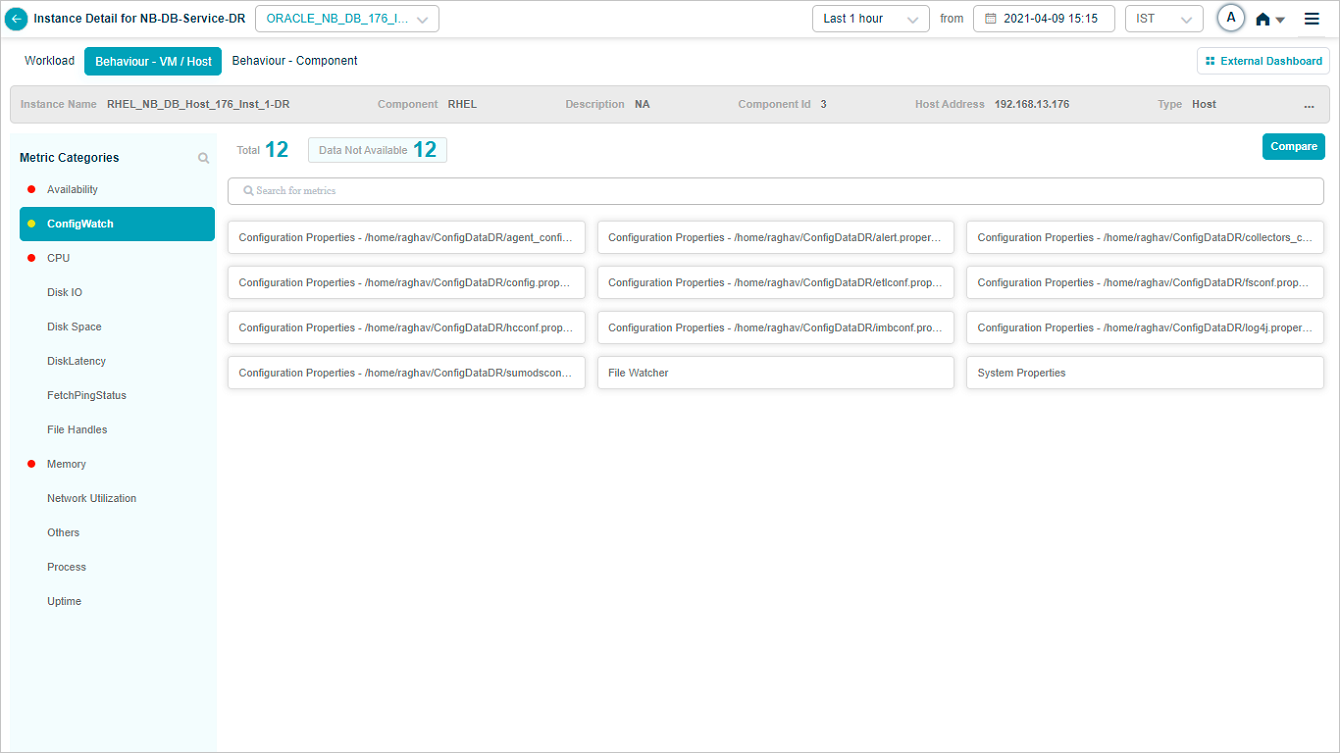
Select Data Not Available to view the pods of metrics which don’t contain any data as displayed in following screen.
Instance Detail_Behaviour
Searching a Metric
Enter name of a metric to search for in the search box. Select Search for metrics box. Select metric(s) to search for.
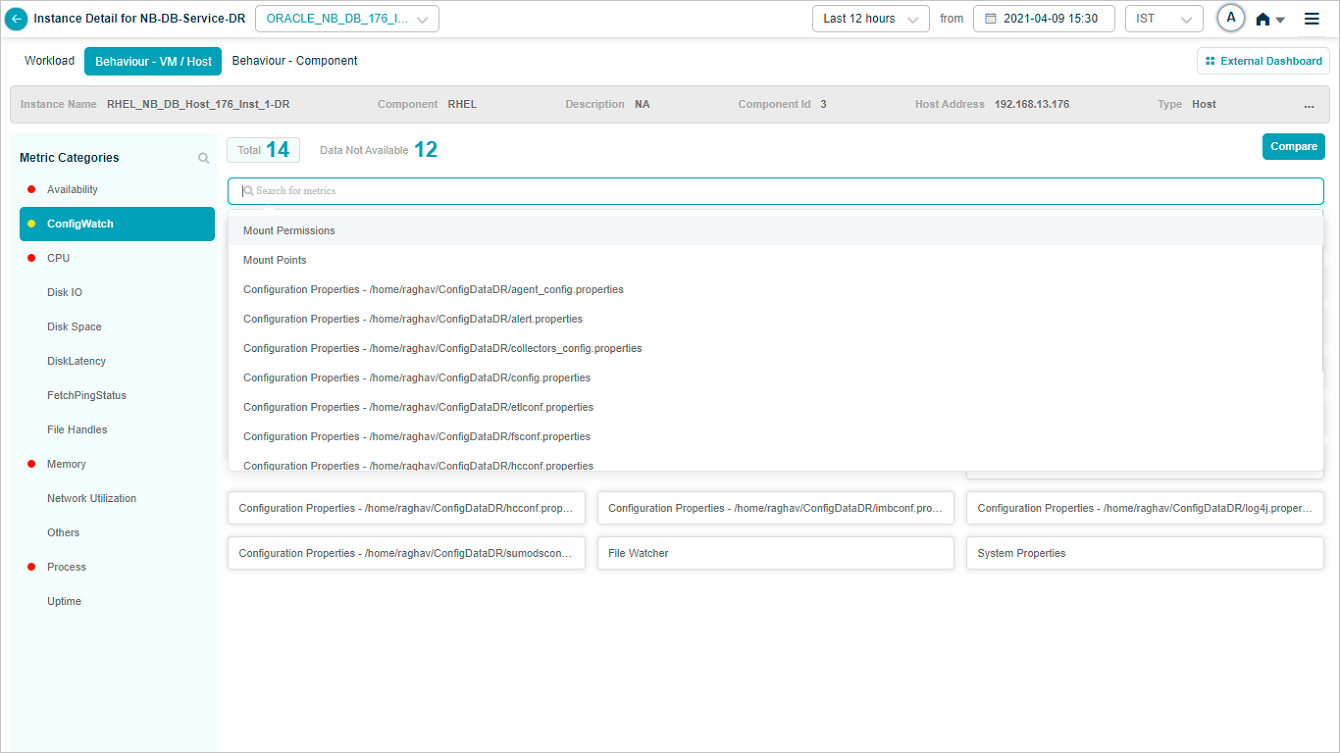
Metric Search
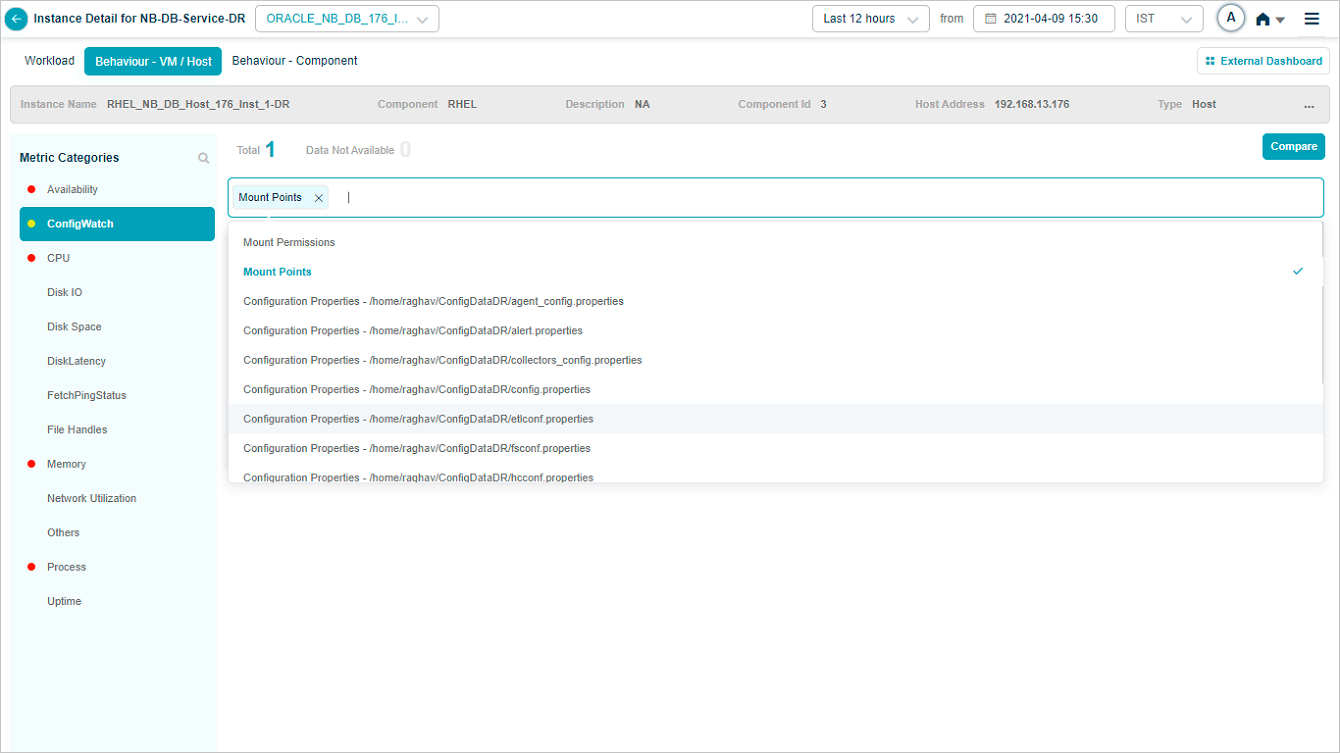
Metric Search
Only the selected metric(s) pod(s) are displayed.
Metric Search
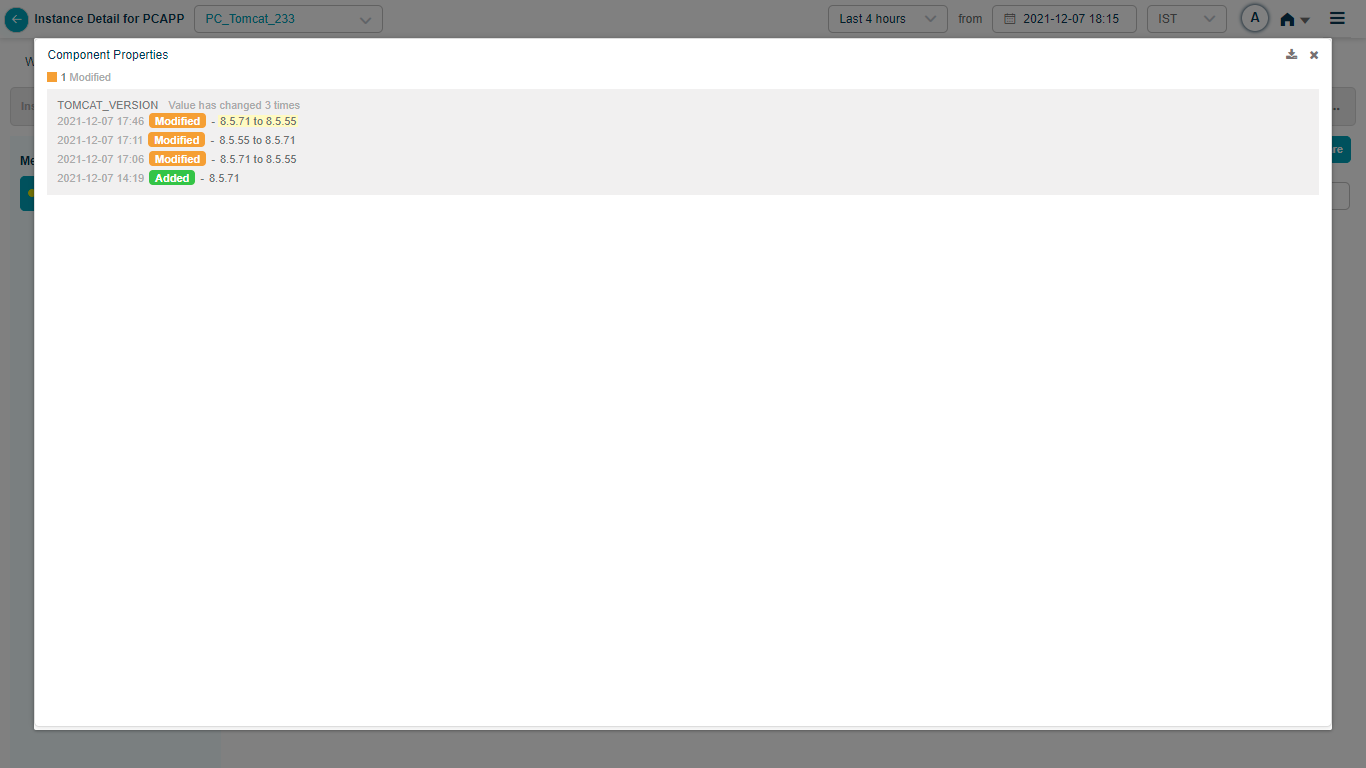
Expanding a Pod
Select ![]() icon in the top right corner of a pod to expand the pod. Expanded version shows the history of the changes. In this case, for a monitored file, you can view all the changes made to the individual properties. The header displays summary of configuration changes.
icon in the top right corner of a pod to expand the pod. Expanded version shows the history of the changes. In this case, for a monitored file, you can view all the changes made to the individual properties. The header displays summary of configuration changes.
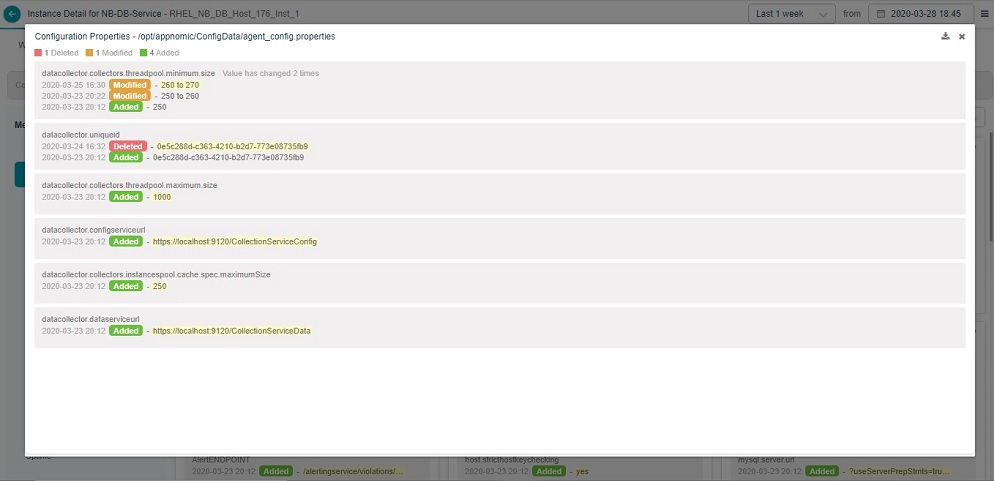
Expanding a Pod
Downloading Configuration Changes
Select ![]() icon at top right corner of a pod to download the configuration changes in .csv format.
icon at top right corner of a pod to download the configuration changes in .csv format.
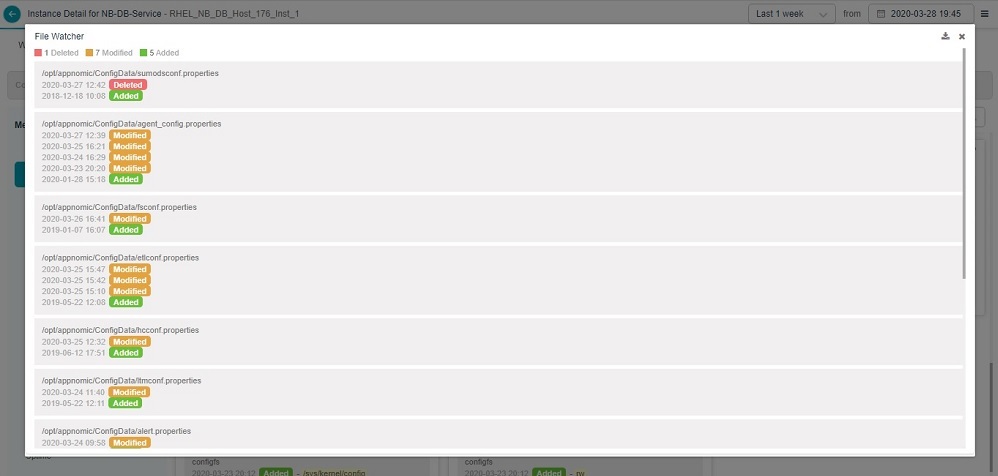
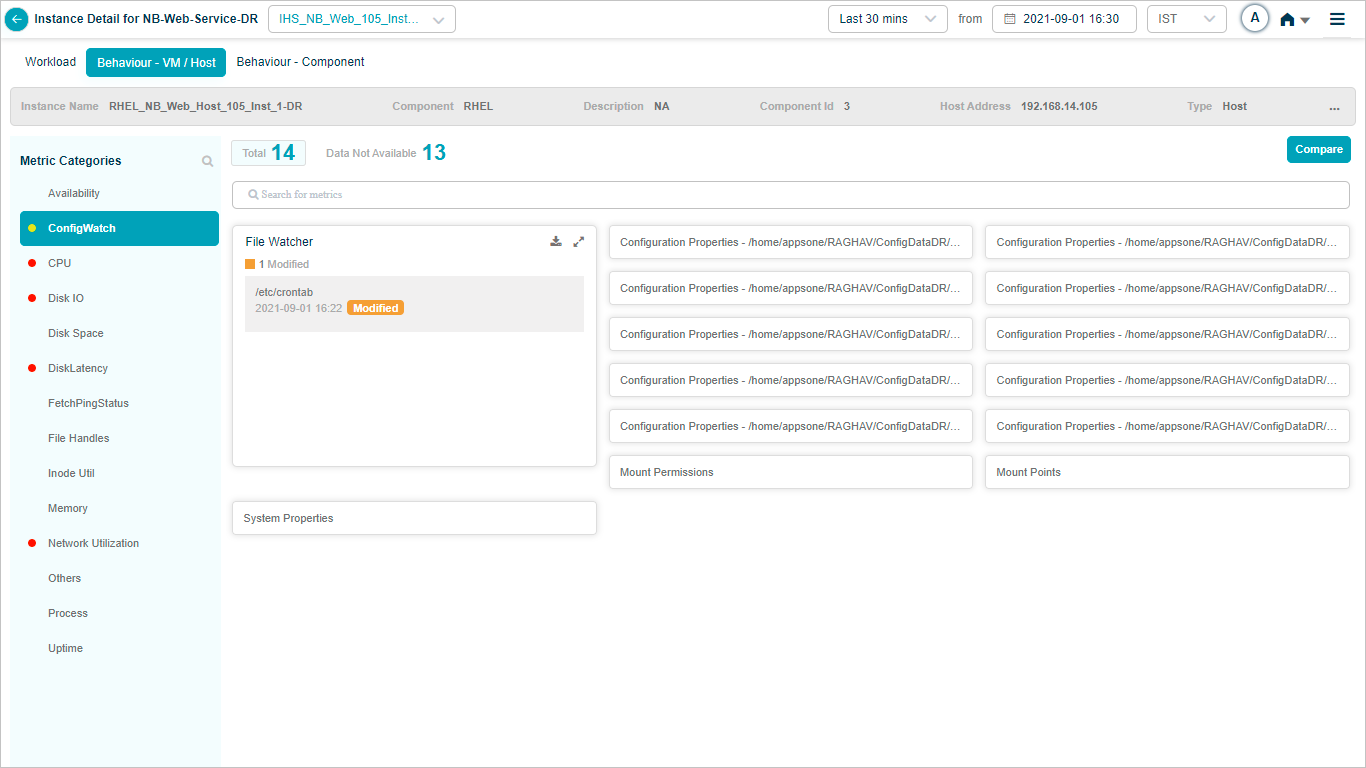
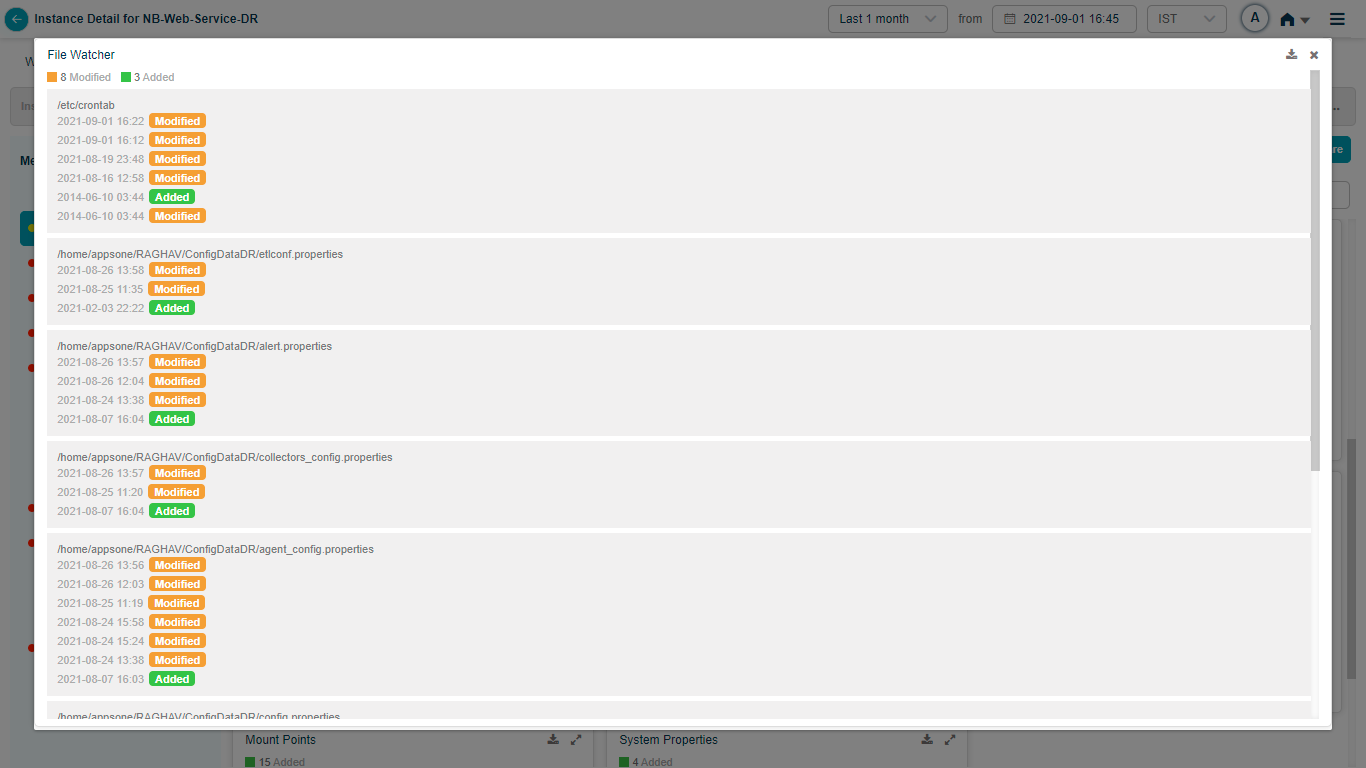
Viewing File Watcher
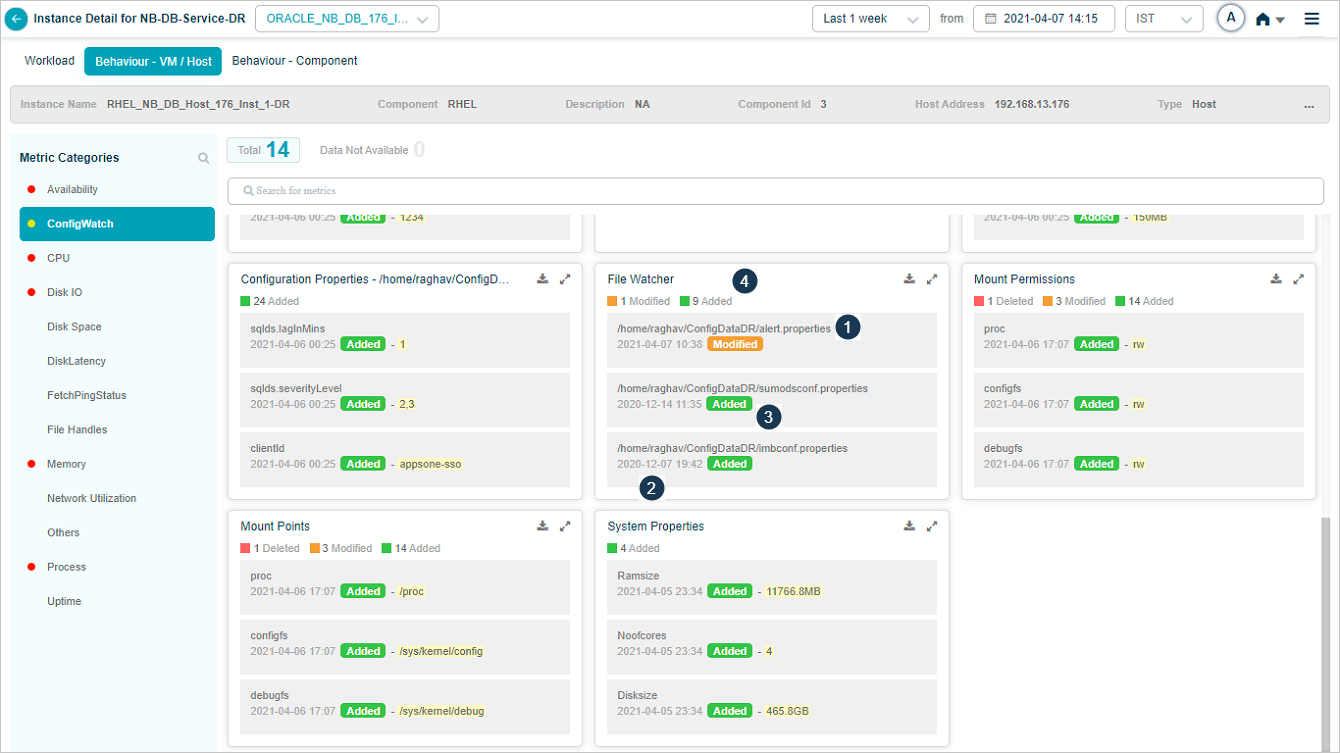
File Watcher
| 1 | This displays a file name which is being monitored. |
| 2 | This displays the timestamp at which a file was added/deleted/modified. |
| 3 | This displays last action taken on a file: 1) File is added. 2) File is deleted. 3) There is some change done in the file. This doesn’t display the exact change done. Last status of the file is displayed till any further action is taken. |
| 4 | Tiles header displays summary of the configuration changes. |
Select ![]() icon in the top right corner of a pod to expand the pod.
icon in the top right corner of a pod to expand the pod.
File Watcher
Viewing Query Watcher
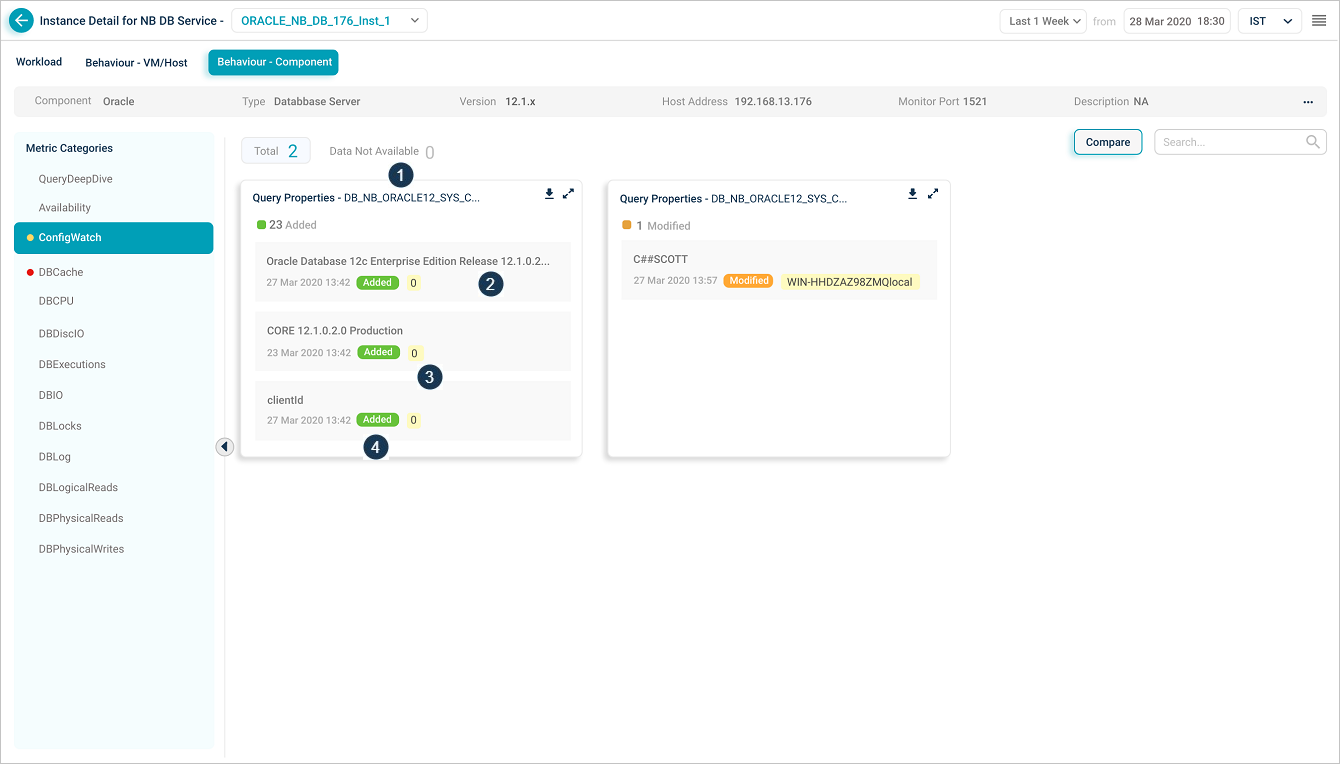
Query Watcher
| 1 | This displays the name of the query which is executed in Oracle DB. |
| 2 | This displays the database property name. |
| 3 | This displays the value of the database property. |
| 4 | This displays the last action taken on the database property: 1) Added: A property is added to DB. 2) Deleted: A property is deleted from the DB. 3) Modified: Value of a property id modified. |
Select ![]() icon in the top right corner of a pod to expand the pod.
icon in the top right corner of a pod to expand the pod.
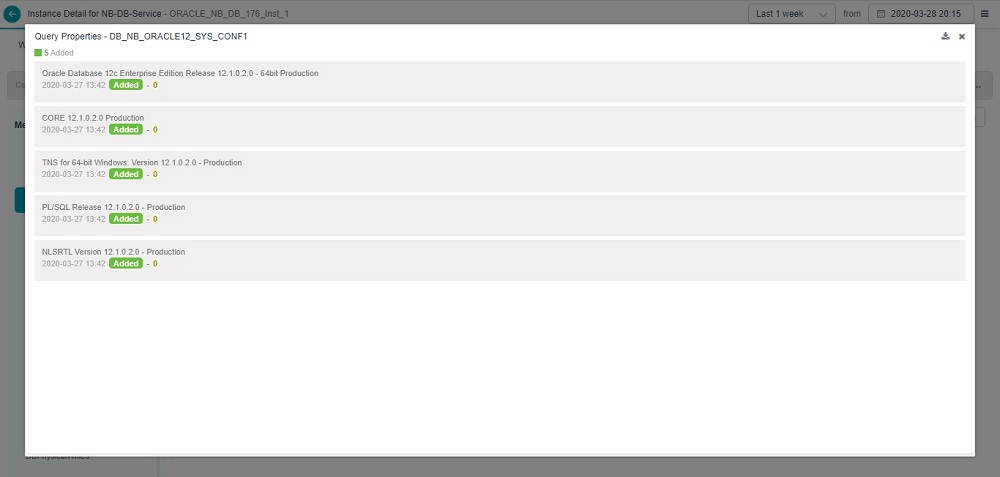
Query Properties
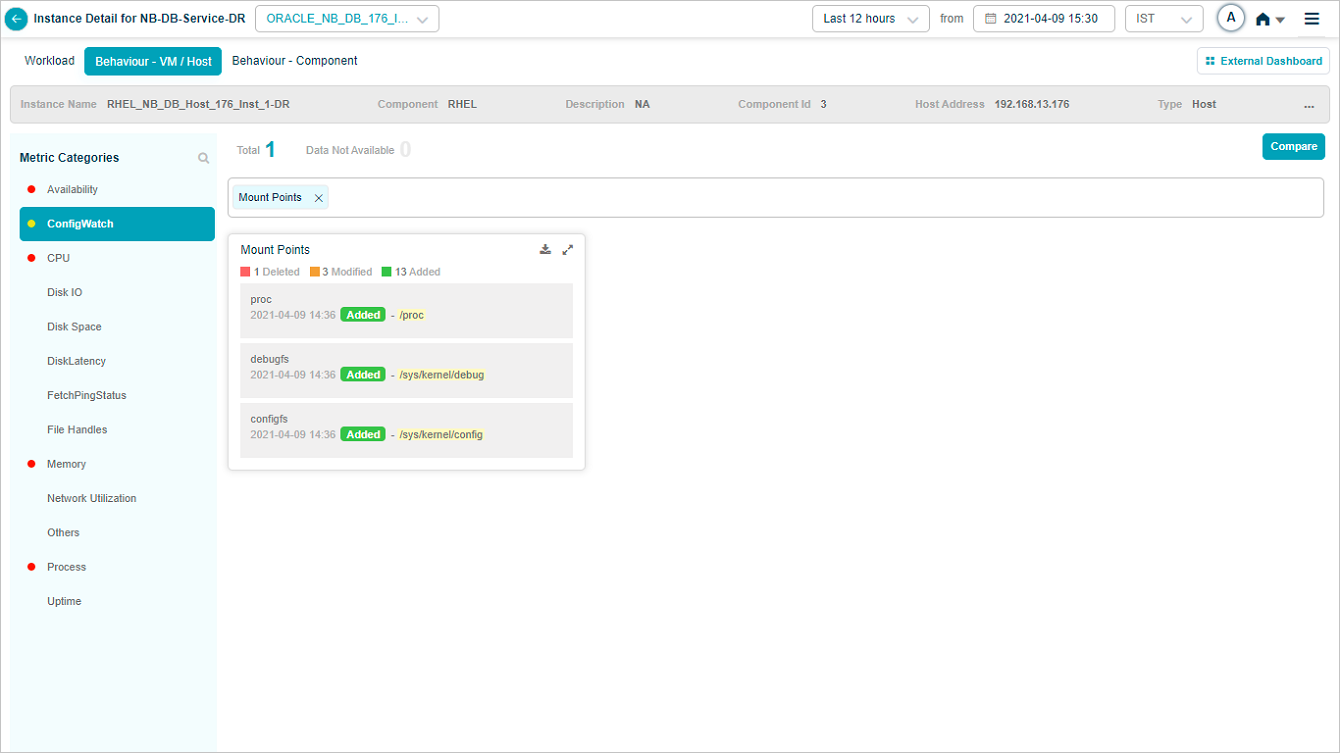
Viewing Mount Permissions, Mount Points, System Properties
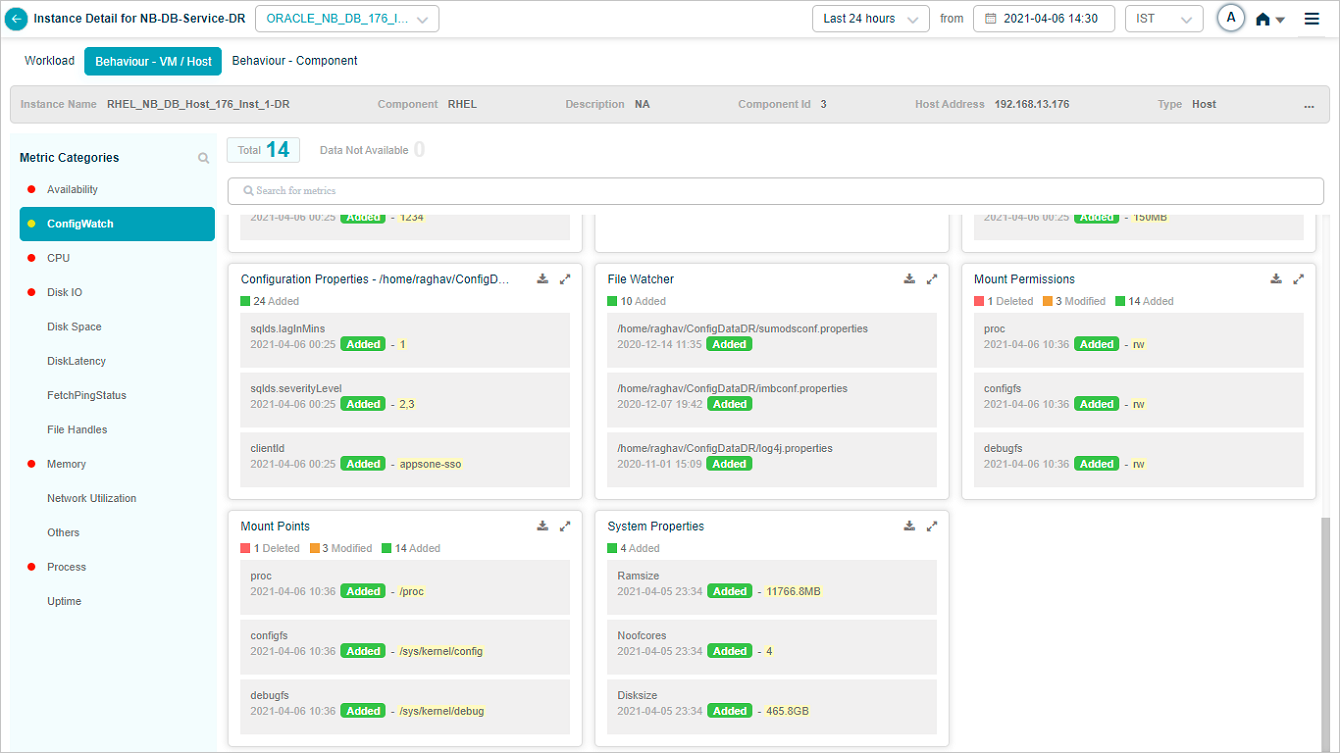
Instance Detail_Behaviour
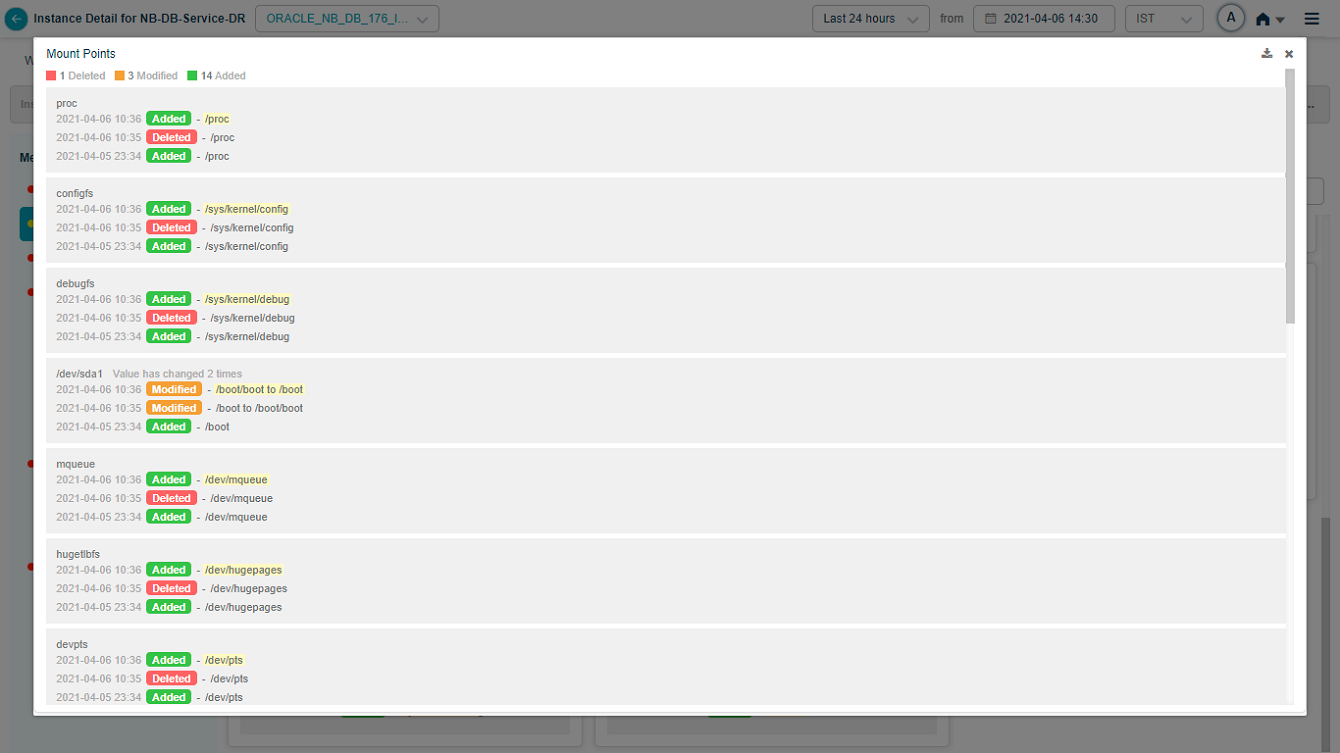
Mount Points
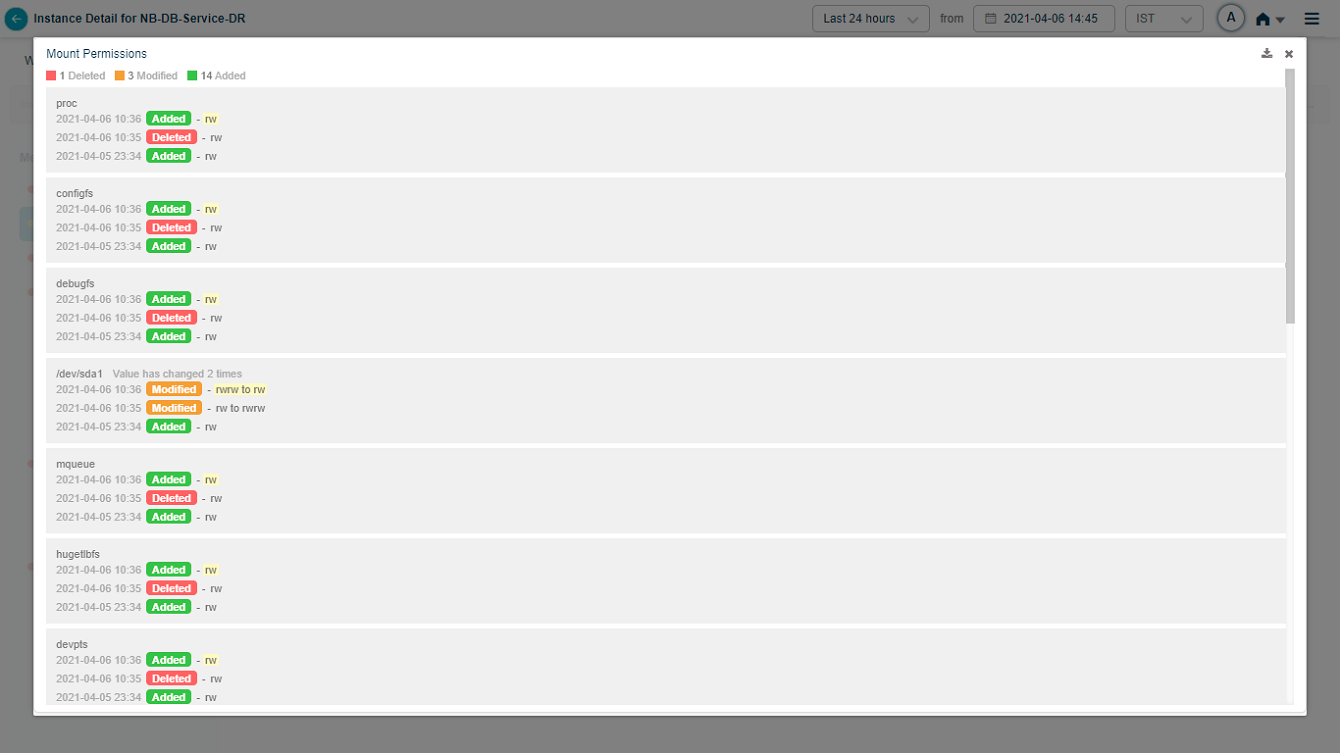
Mount Permissions
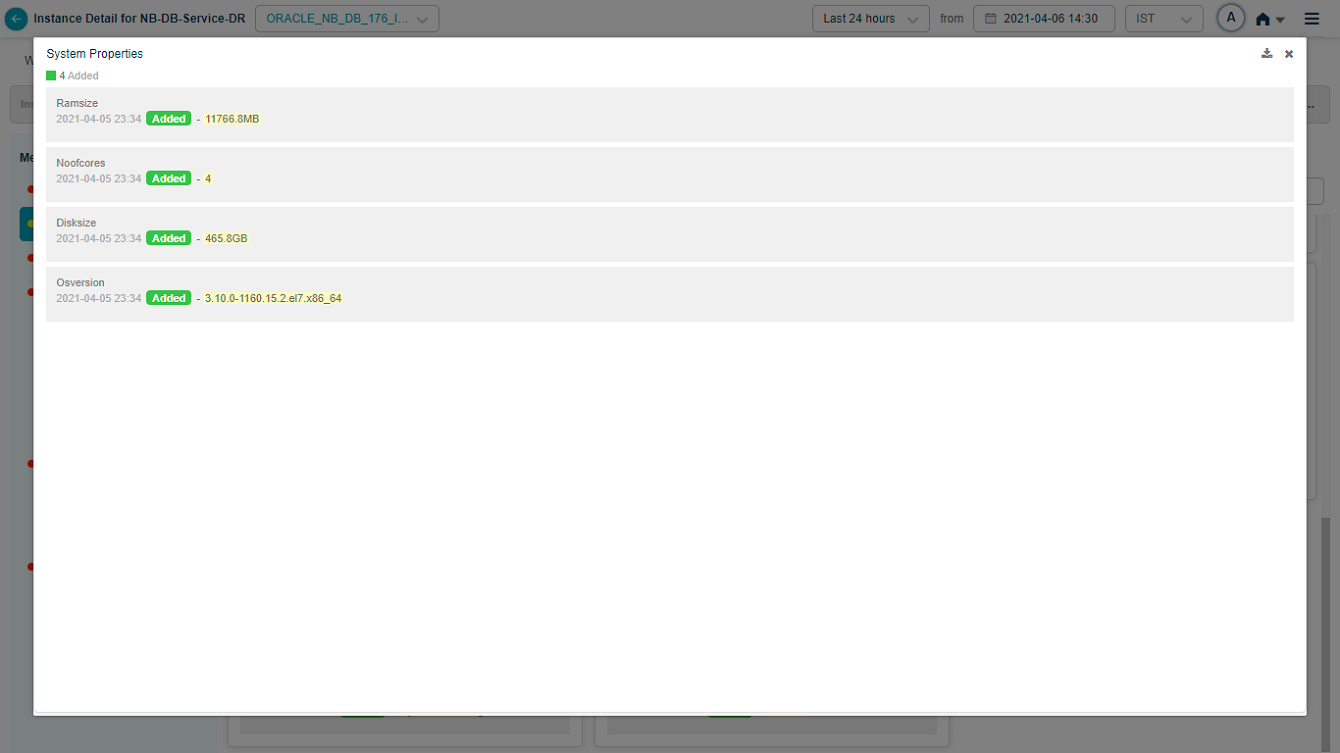
System Properties
Crontab
File Watch monitors /etc/crontab file.
Instance Detail_Behaviour
Instance Detail_Behaviour
Instance Detail_Behaviour
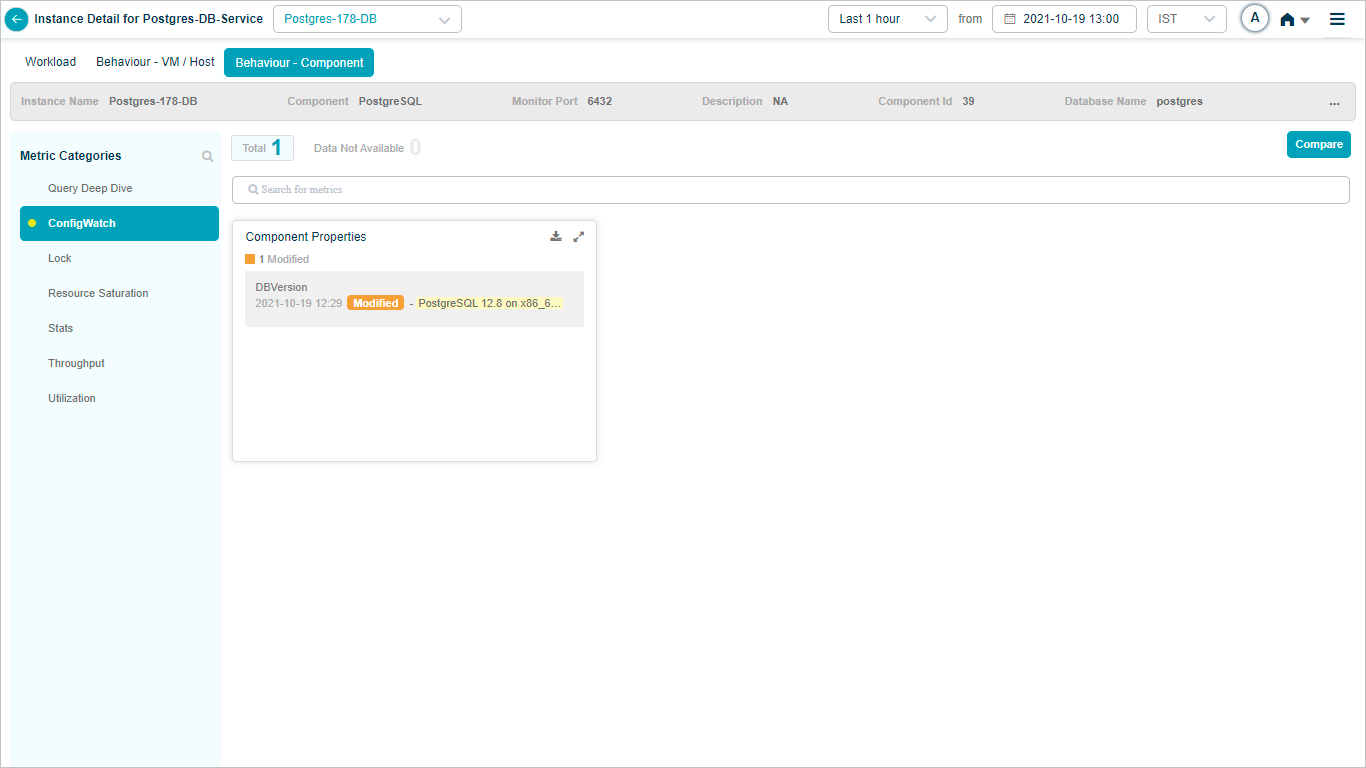
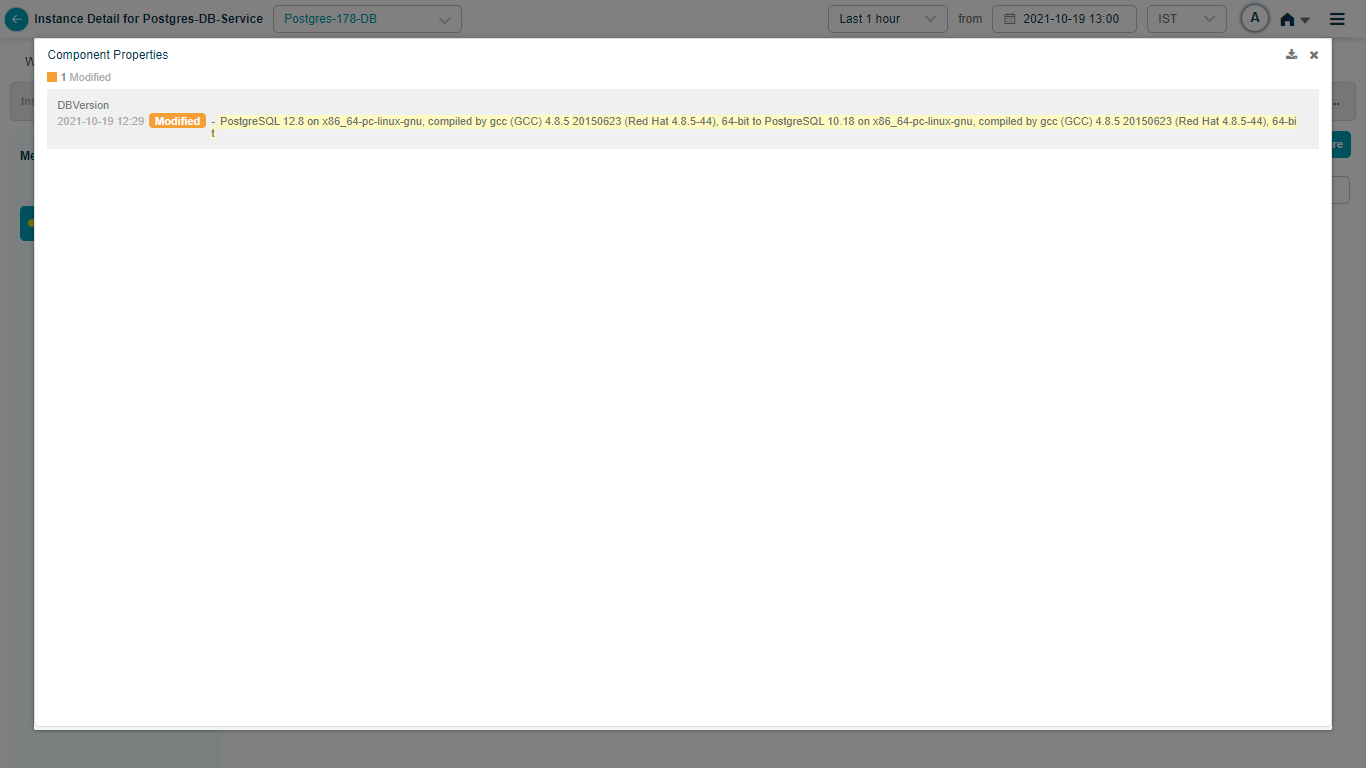
Component Properties
Component Properties monitors the versions of database components. If there is any change in the version, it displays the old and the new version of the component. Whenever you add any Application or Web component, you can see the version in Component Properties pod. If you upgrade the component, you can view the updated version in the pod.
Instance Detail_Behaviour
Component Properties
Instance Detail_Behaviour
Instance Detail_Behaviour
Comparing Config Changes
Select Compare to compare the configuration changes. Following screen is displayed.
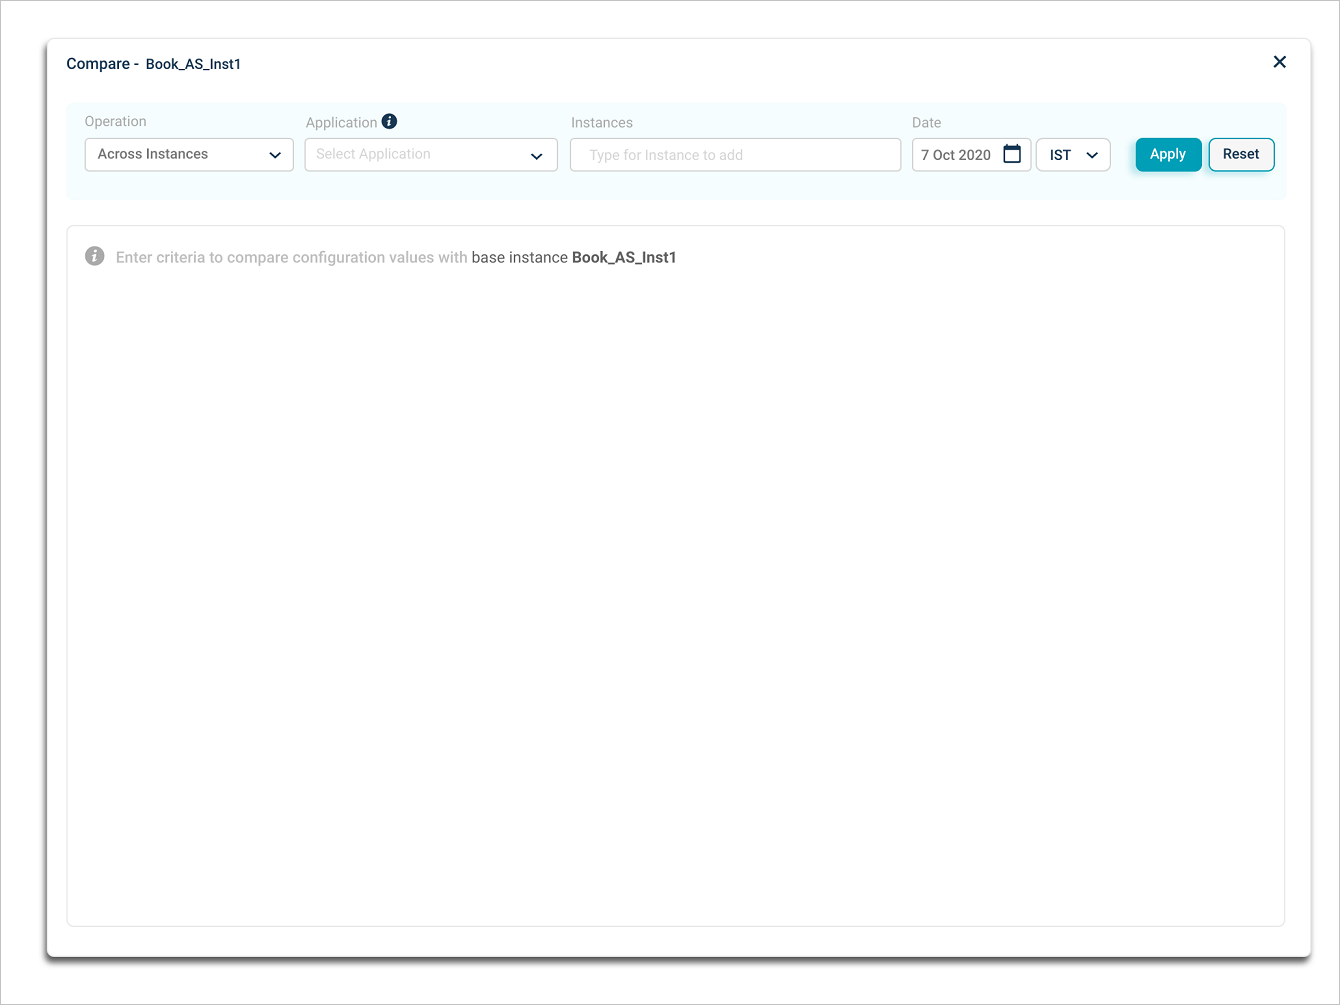
Compare
Select Operation box. You can see available options as shown in following screen.

Compare
Comparing Across Instances
You can compare a host or a component instance of an application with another host or a component instance of the same or different application. HEAL compares base instance with other instances. Select Across Instances from Operation box. Following screen is displayed.
Compare
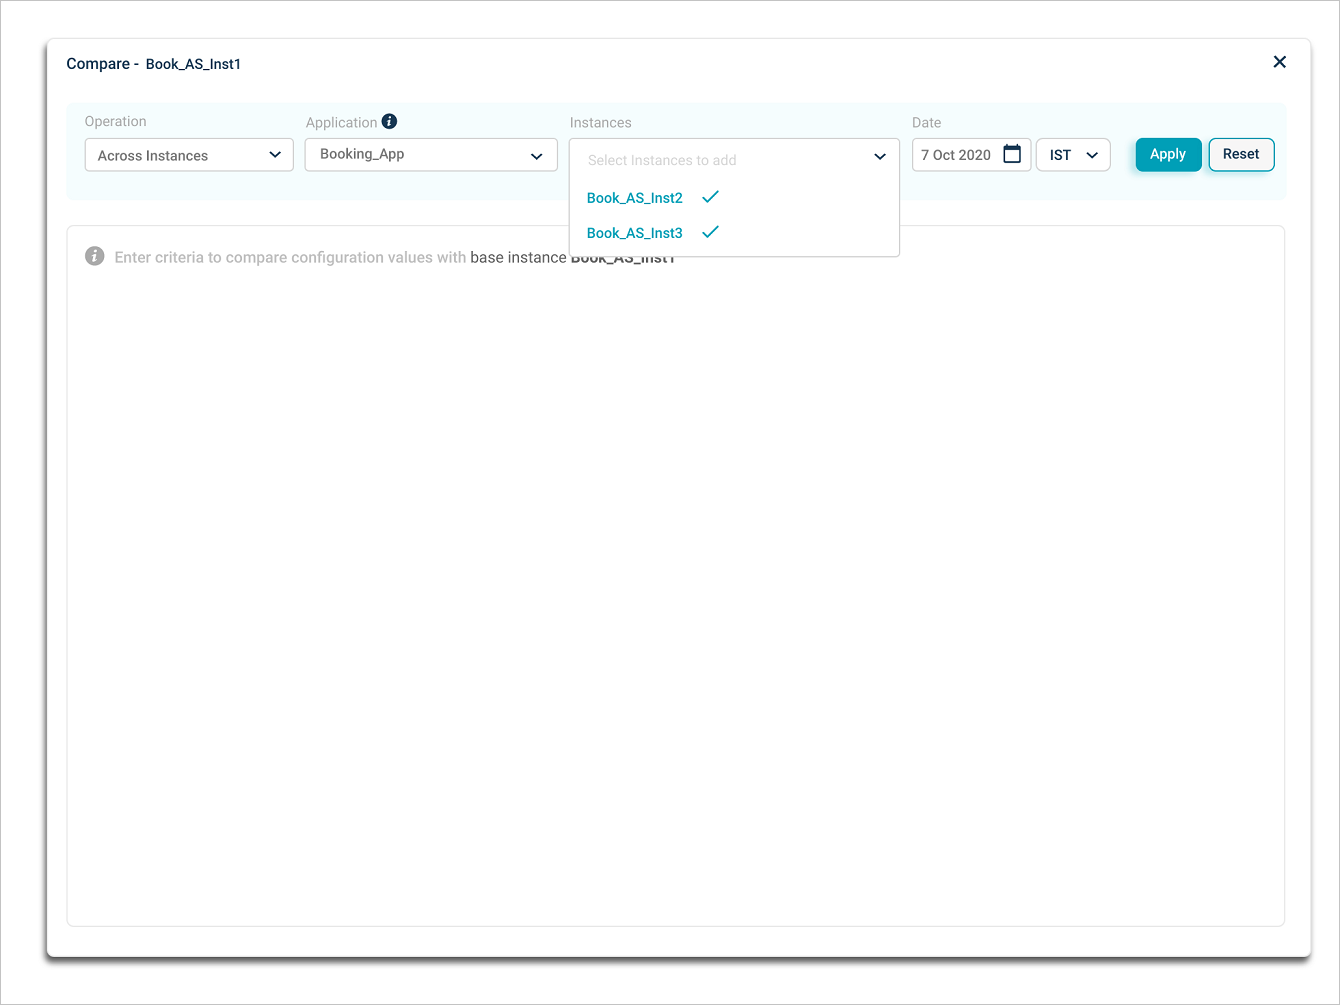
You can select maximum up to three instances.
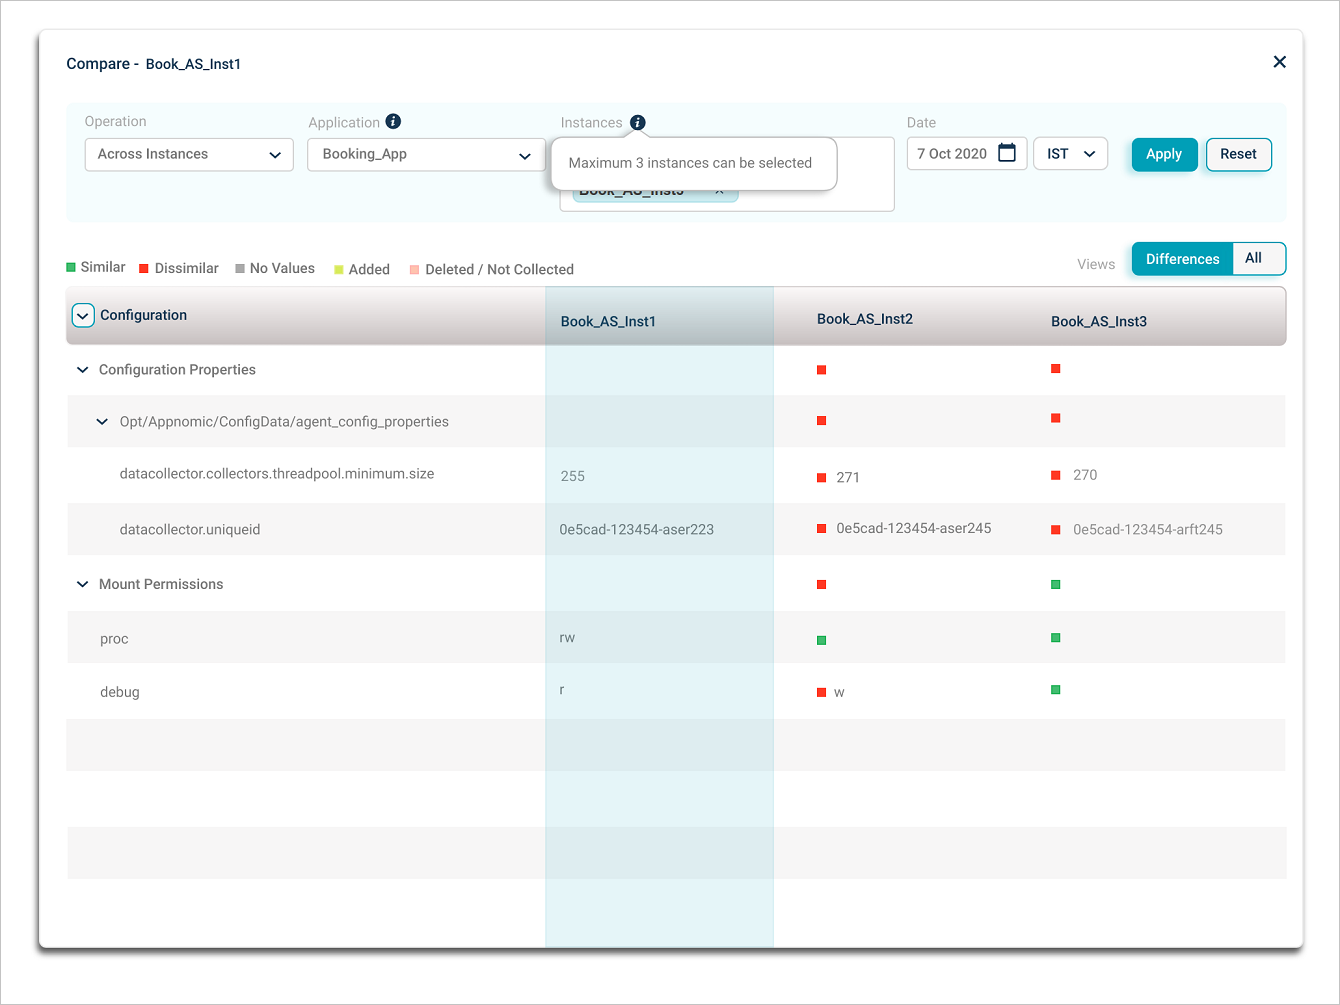
Compare
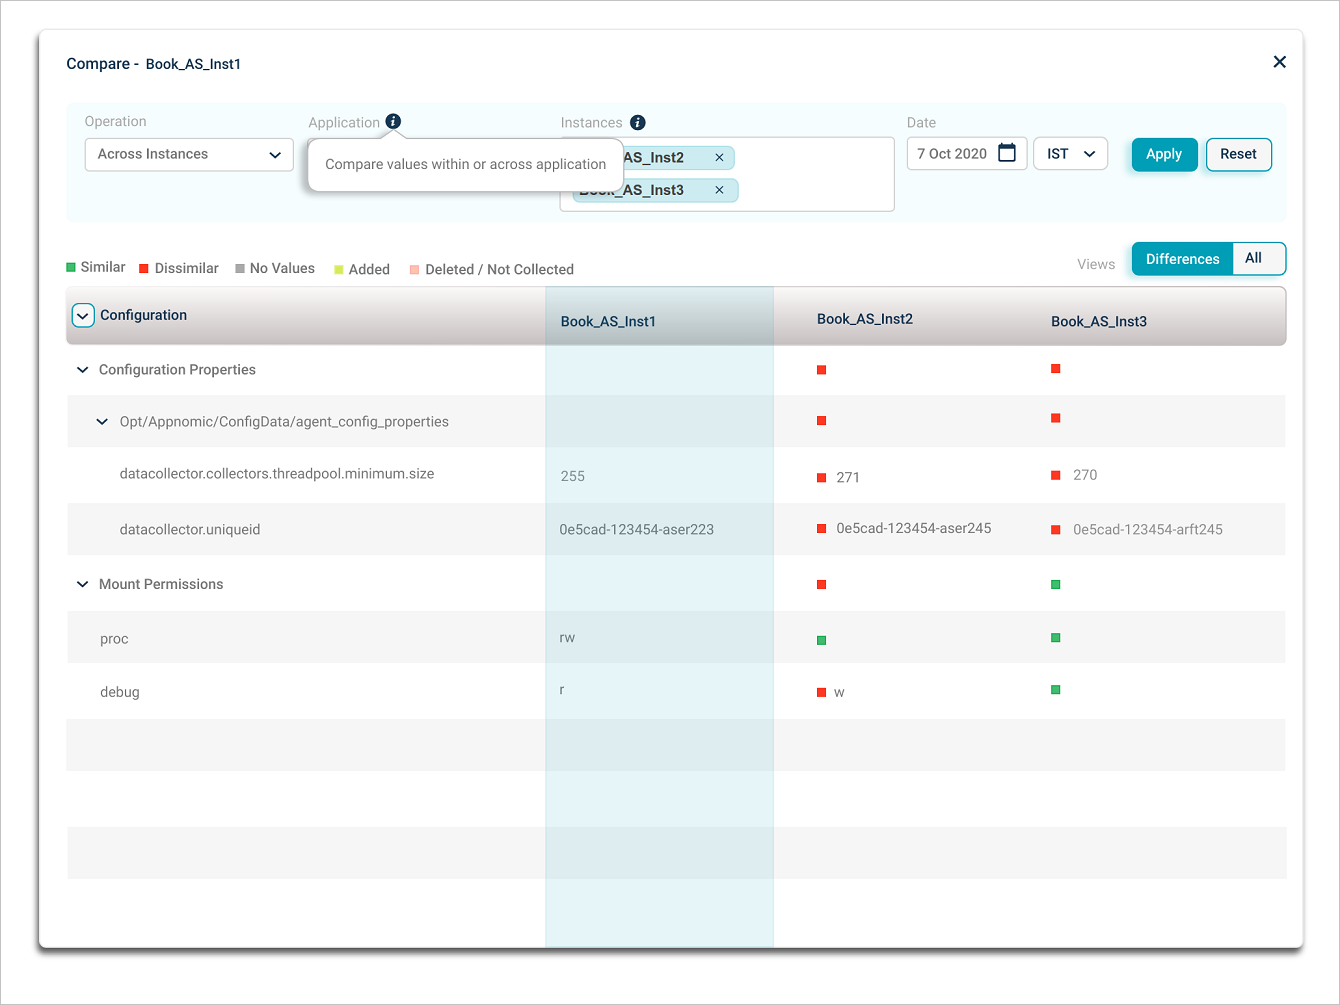
Compare
Select the application from Application box. You can compare maximum up to three instances with the base instance. Select the host or component instances you need to compare with the base instance from the Instances box.
Compare
Select the date on which you need to compare the instances. Select the time zone. Data is displayed in that time zone. Select Apply. Following screen is displayed if the base instance does not have any data for the selected date using global date picker.
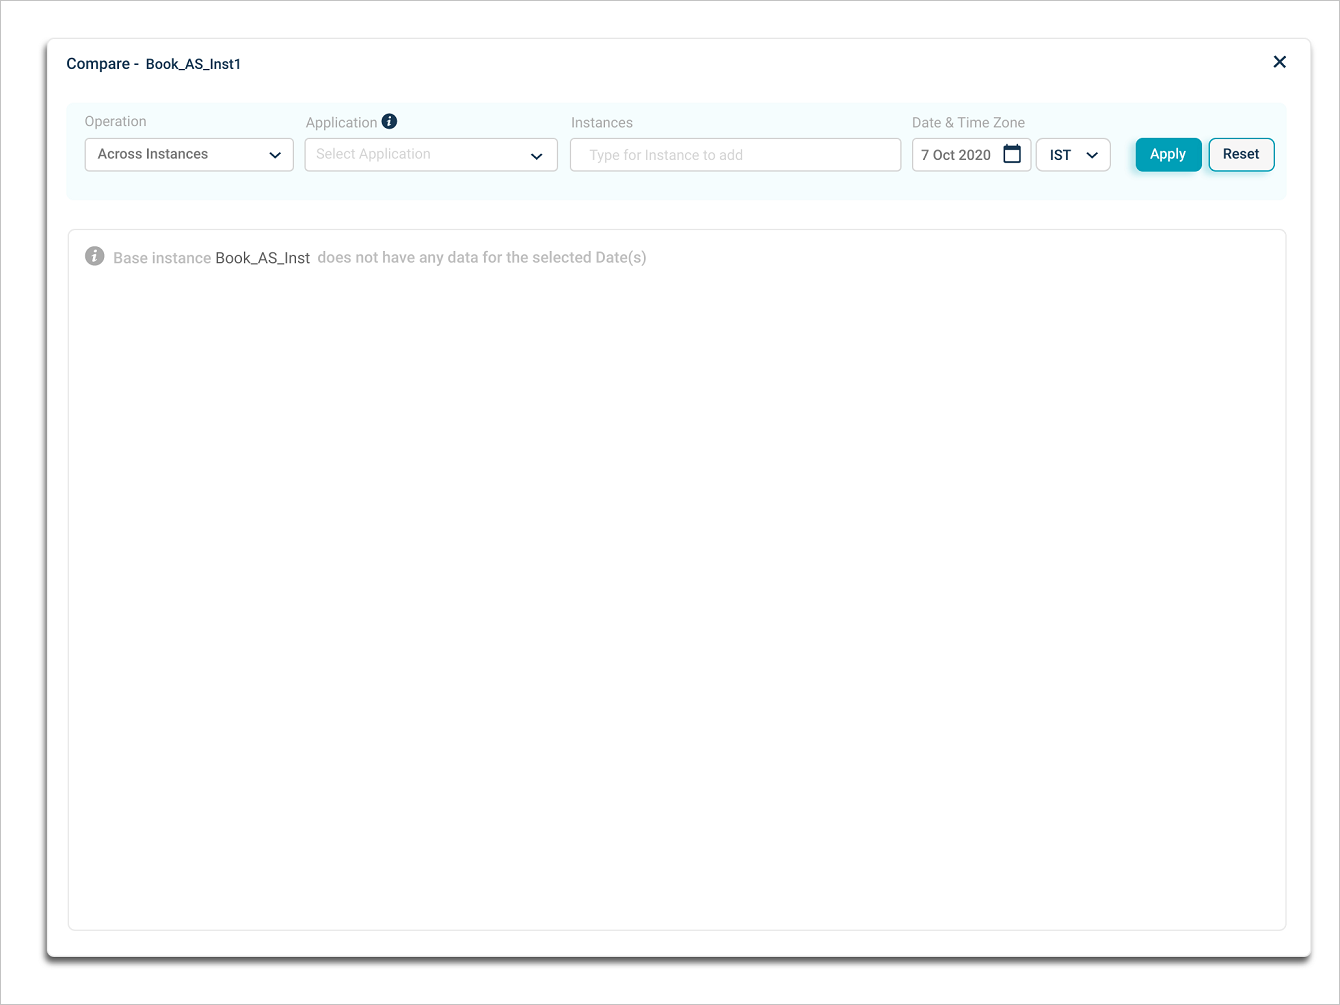
Compare
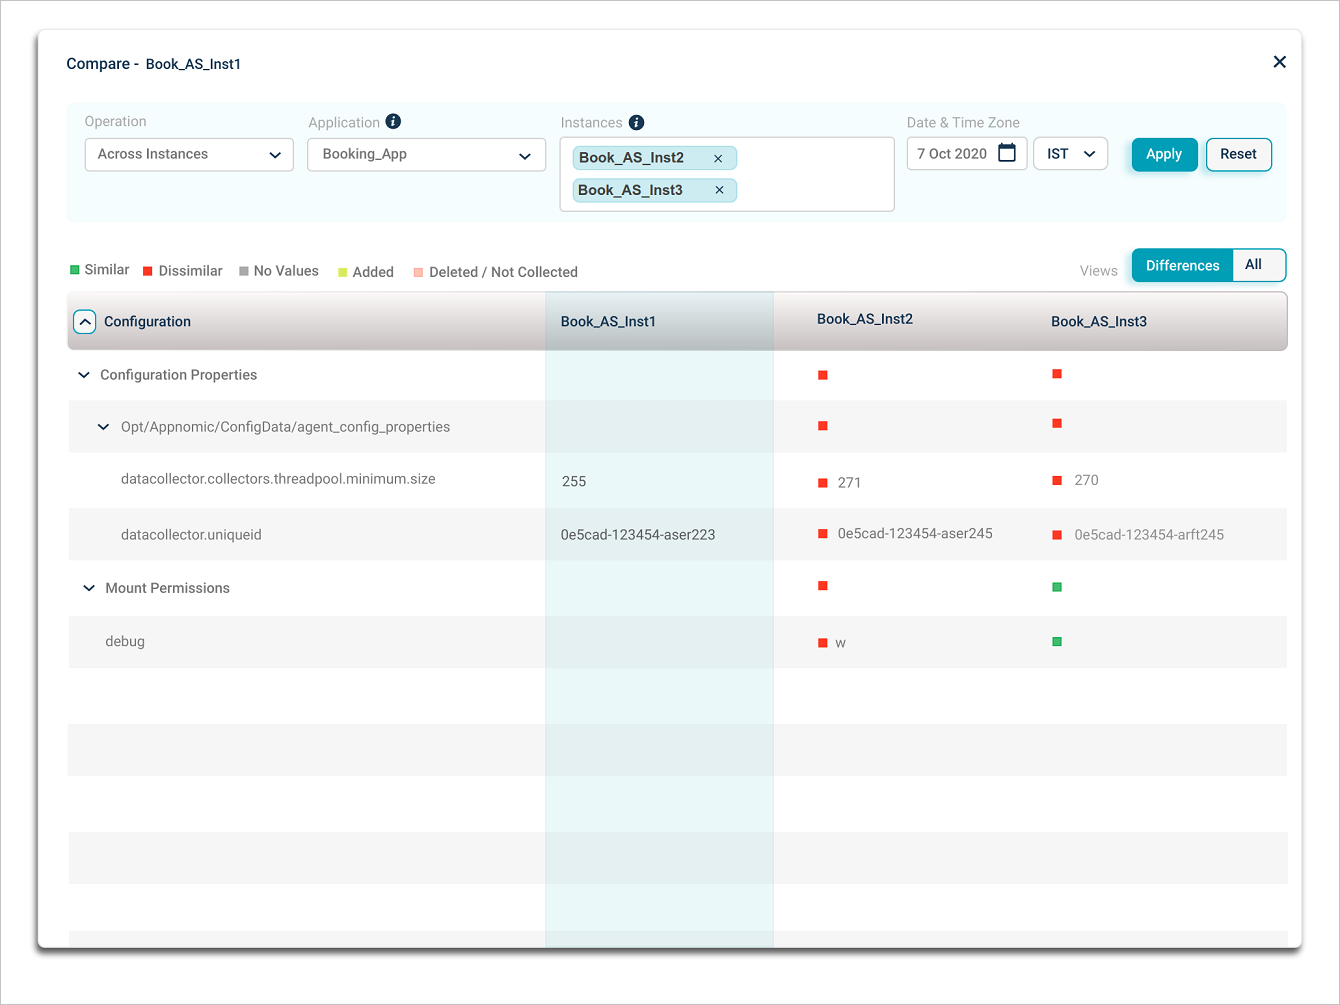
If the base instance has data, you can view the results of comparison as displayed in following screen.
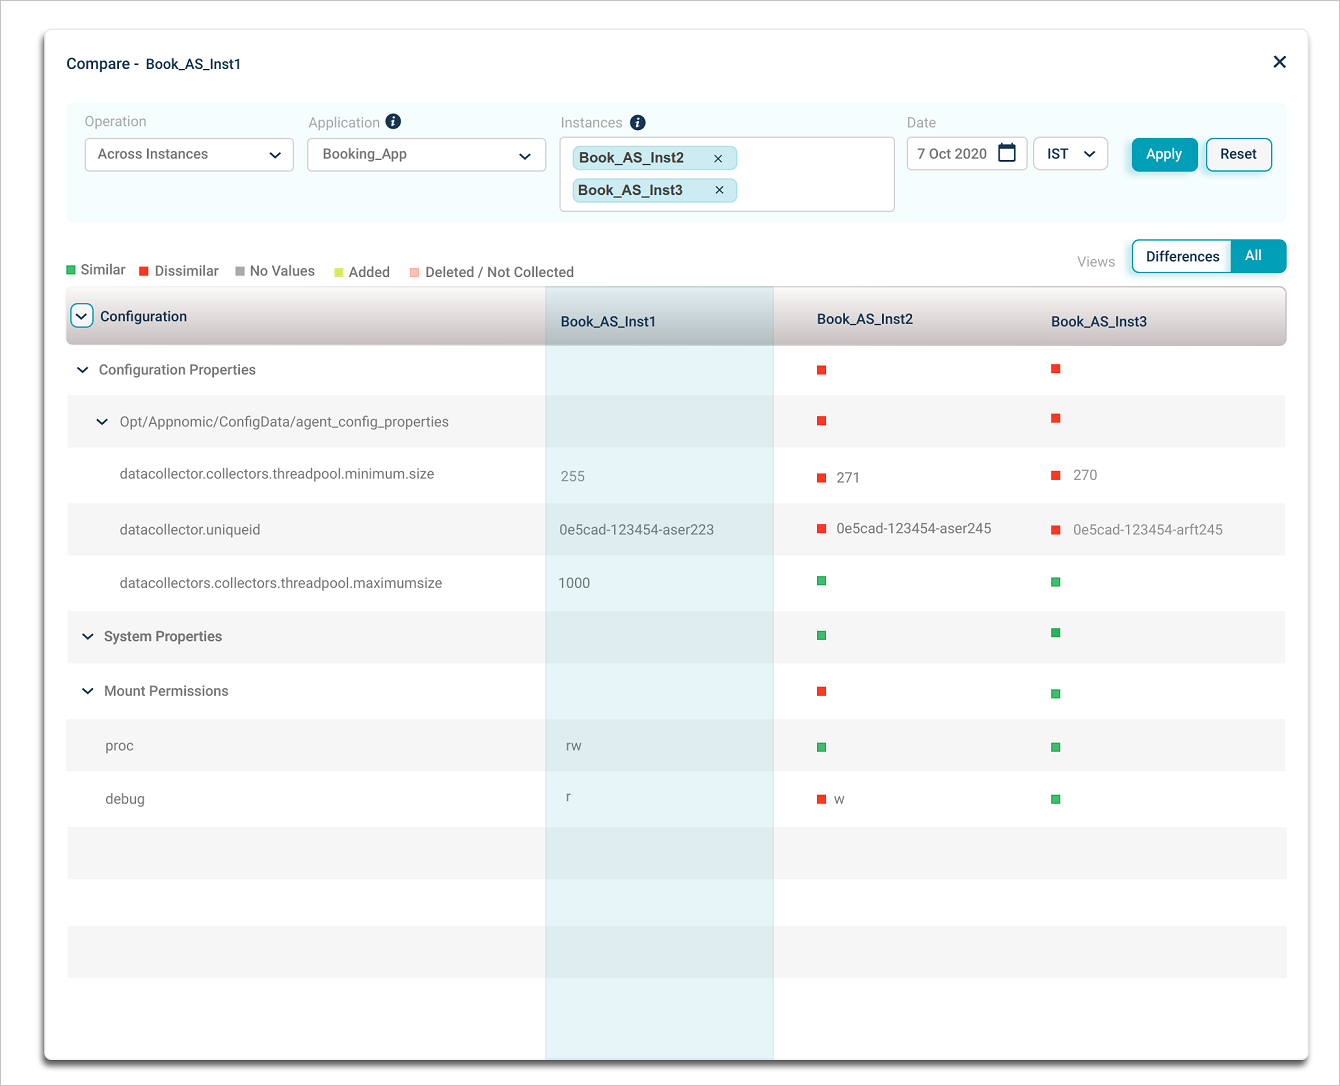
Compare
You can expand or collapse all the configuration properties using  or
or  icons respectively.
Hover on the actual value of a property displays the timestamp at which the component agent last collected the KPI.
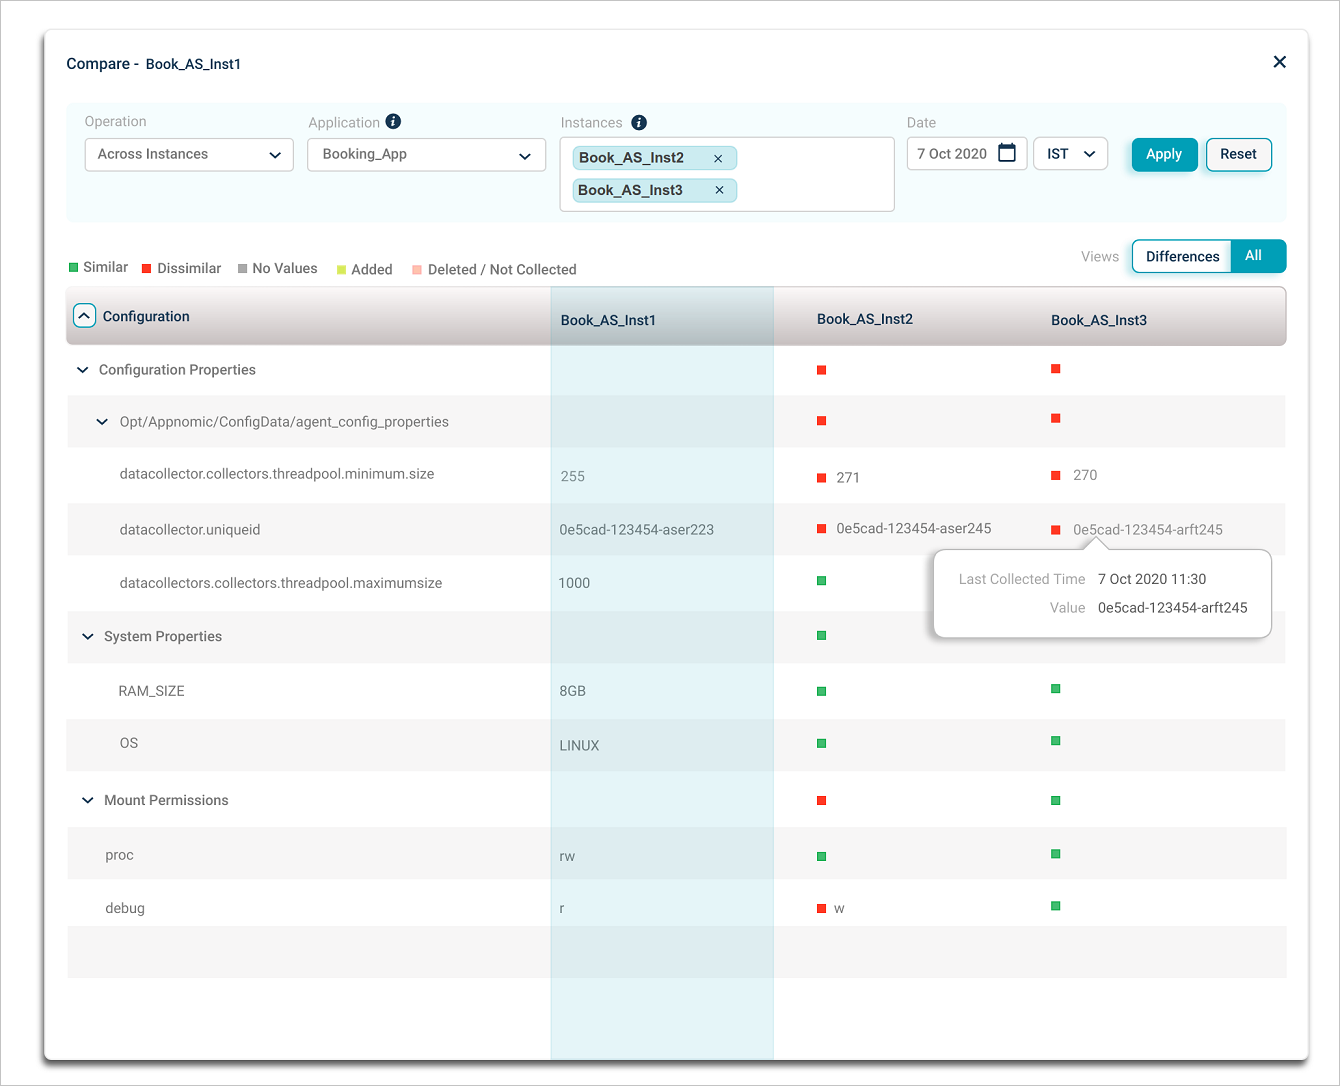
Compare
You can configure the KPIs collection frequency. Default collection frequency for Config Watch KPIs is six hours.
You can see the Config Watch KPIs listed in Configuration column.
Config Watch compares the KPI value of base instance with the KPI value of selected instances and displays the result of the comparison as follows –
Similar – It indicates that KPI value at base instance matches with the KPI value at the selected instance.
Dissimilar – It indicates that KPI value at base instance does not match with the KPI value at the selected instance.
No Values – A KPI is configured but there is no value assigned to it.
Compare
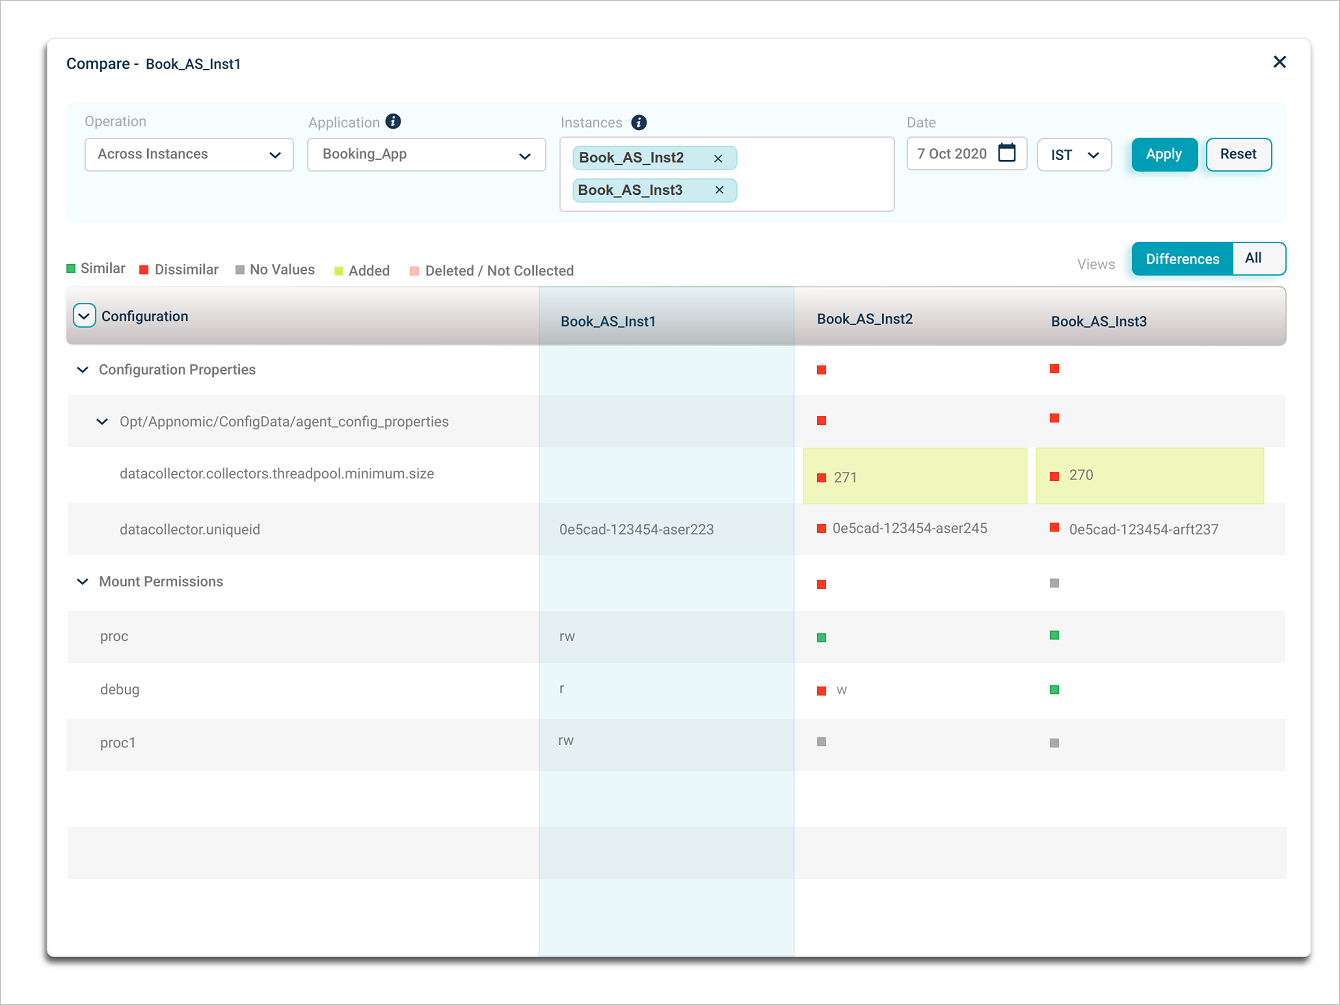
Config Watch does the comparison on commonalities. Say, base instance has 50 Config Watch KPIs and say, other two instances have 25 Config Watch KPIs. You can see 50 KPIs of the base instance but Config watch compares only 25 KPIs across these instances. Remaining 25 properties of these instances are displayed as Deleted or Not Collected.
Config watch detects events as follows for the KPIs –
Added – A new KPI is added.
Deleted / Not Collected – It indicates that a KPI (a file or a property) was deleted or CA couldn’t collect the value for the same.
Compare
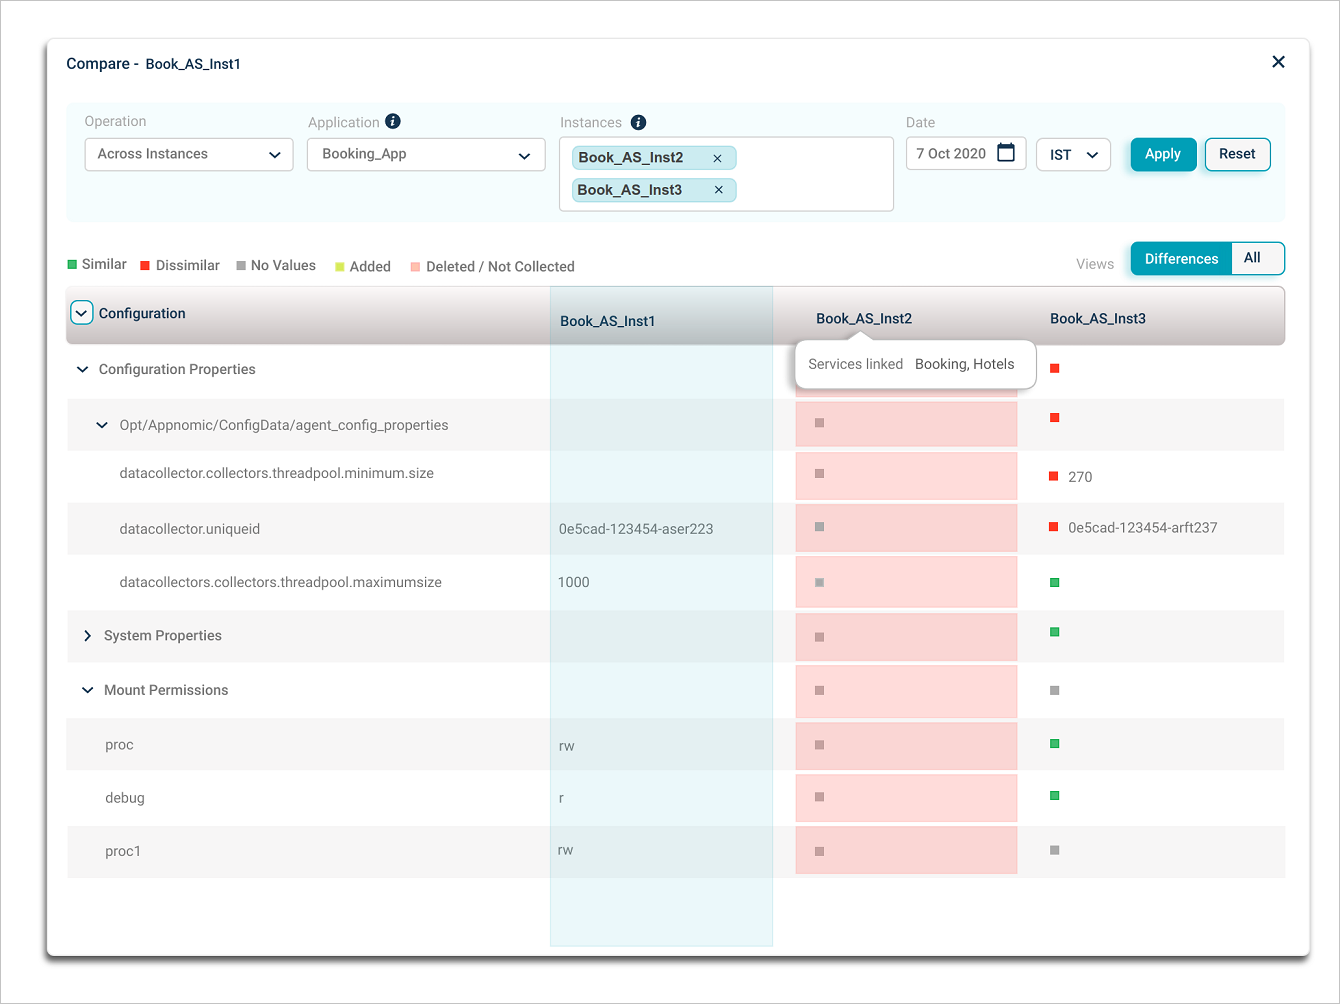
Hover on the column name displays comma separated list of services which the instance is part of.
Background color of the cell indicates an event. Base instance is highlighted in Blue.
If a KPI is Deleted / Not Collected, it is indicated with No Values as comparison result.
If there are no changes in the configuration across the selected instances, following screen is displayed.
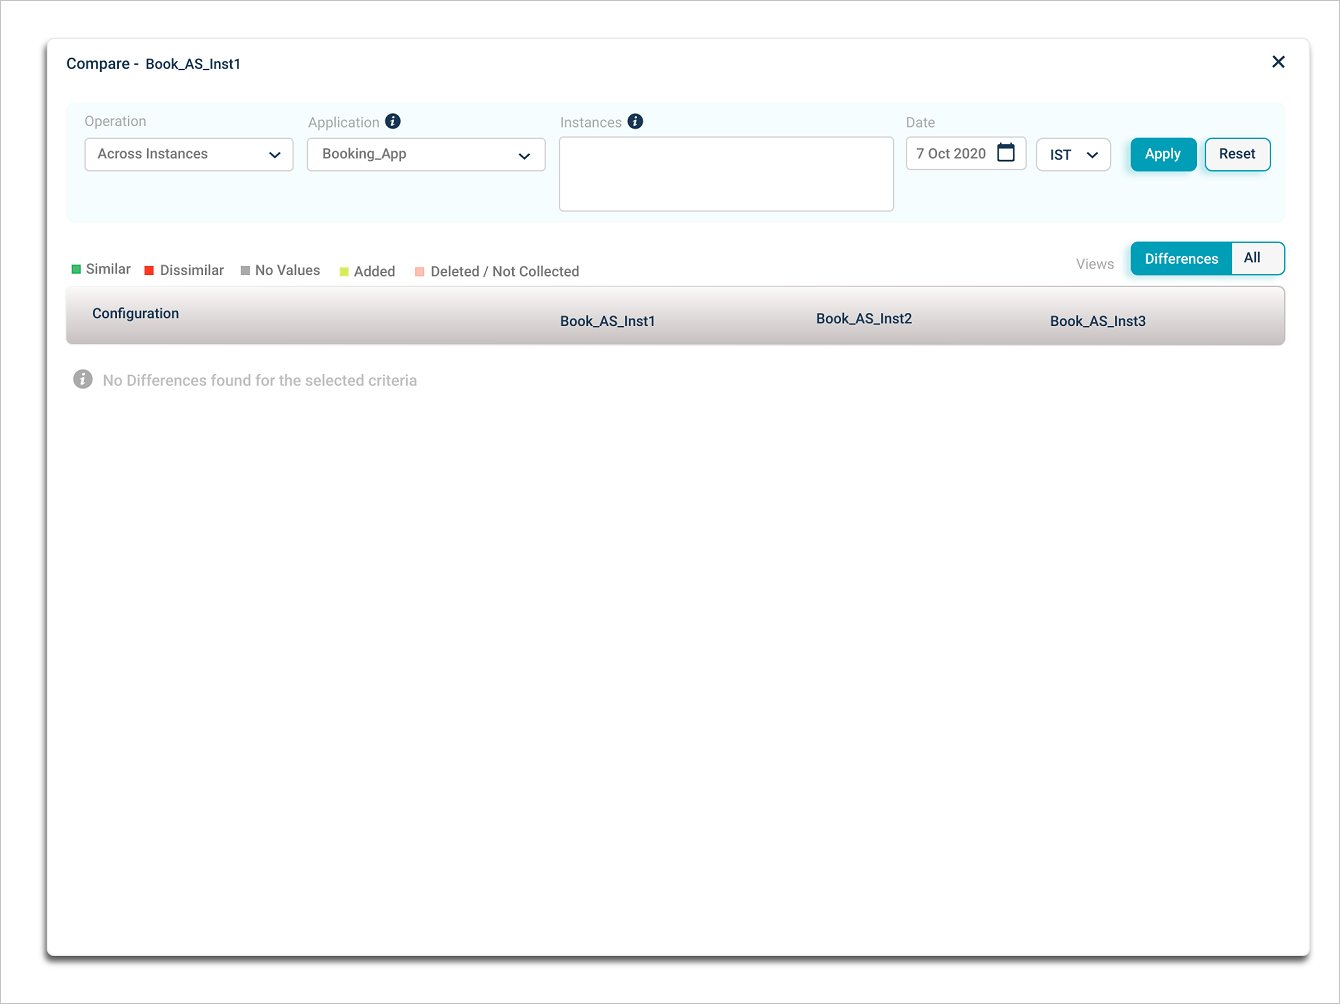
Compare
Comparing Across Timeline
Select Across Timeline from Operation box.
Select the dates across which you need to compare the host or a component instance. You can compare maximum up to three dates with the base instance.
Select Apply. Following screen is displayed if the base instance does not have any data for the selected date using global date picker.
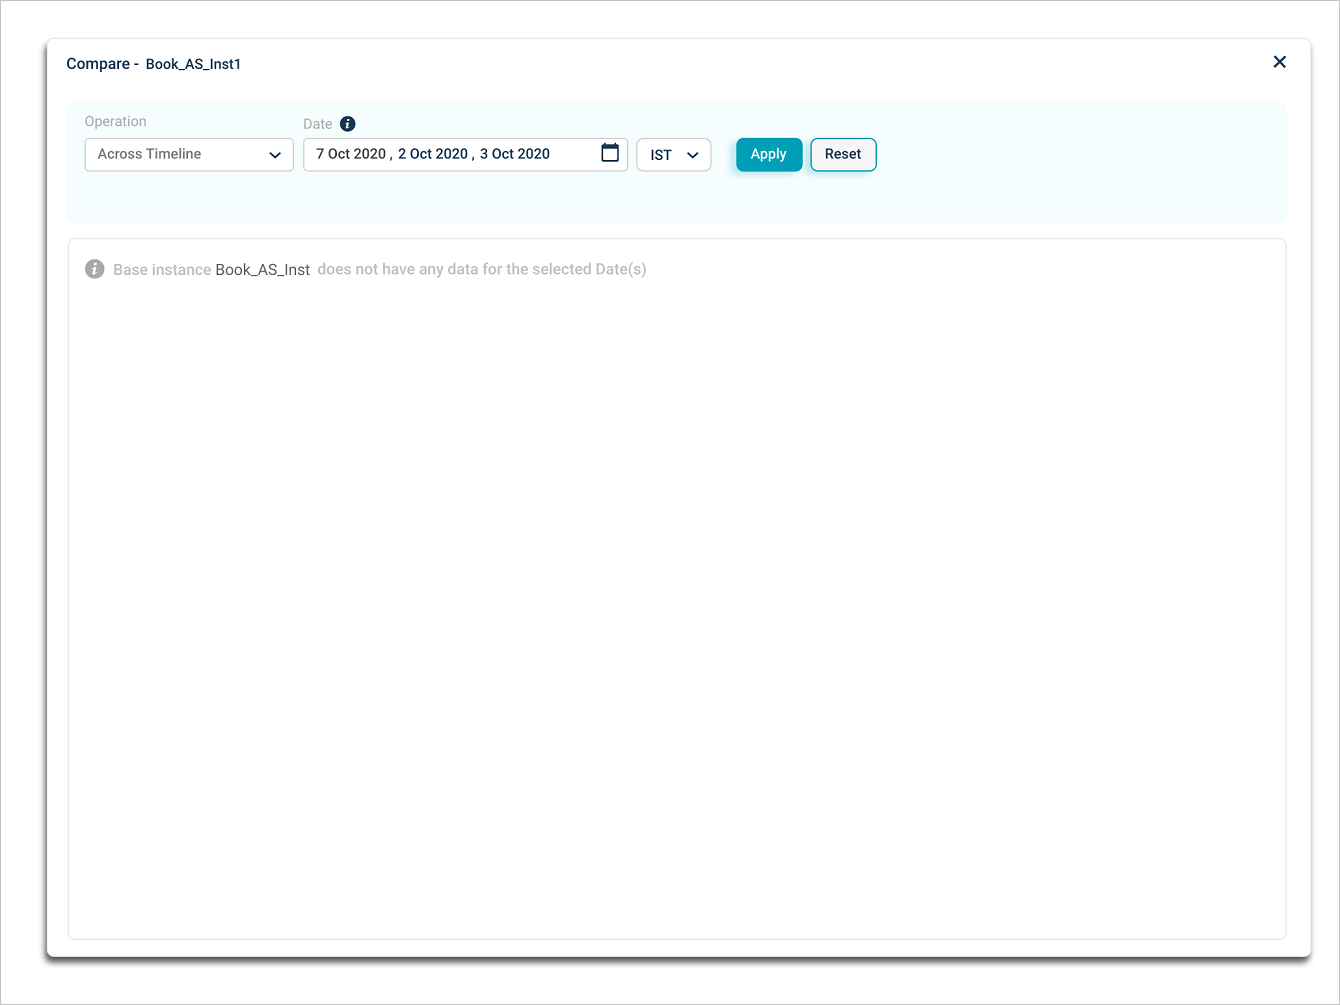
Compare
You can select maximum up to three dates for comparison with the base instance.
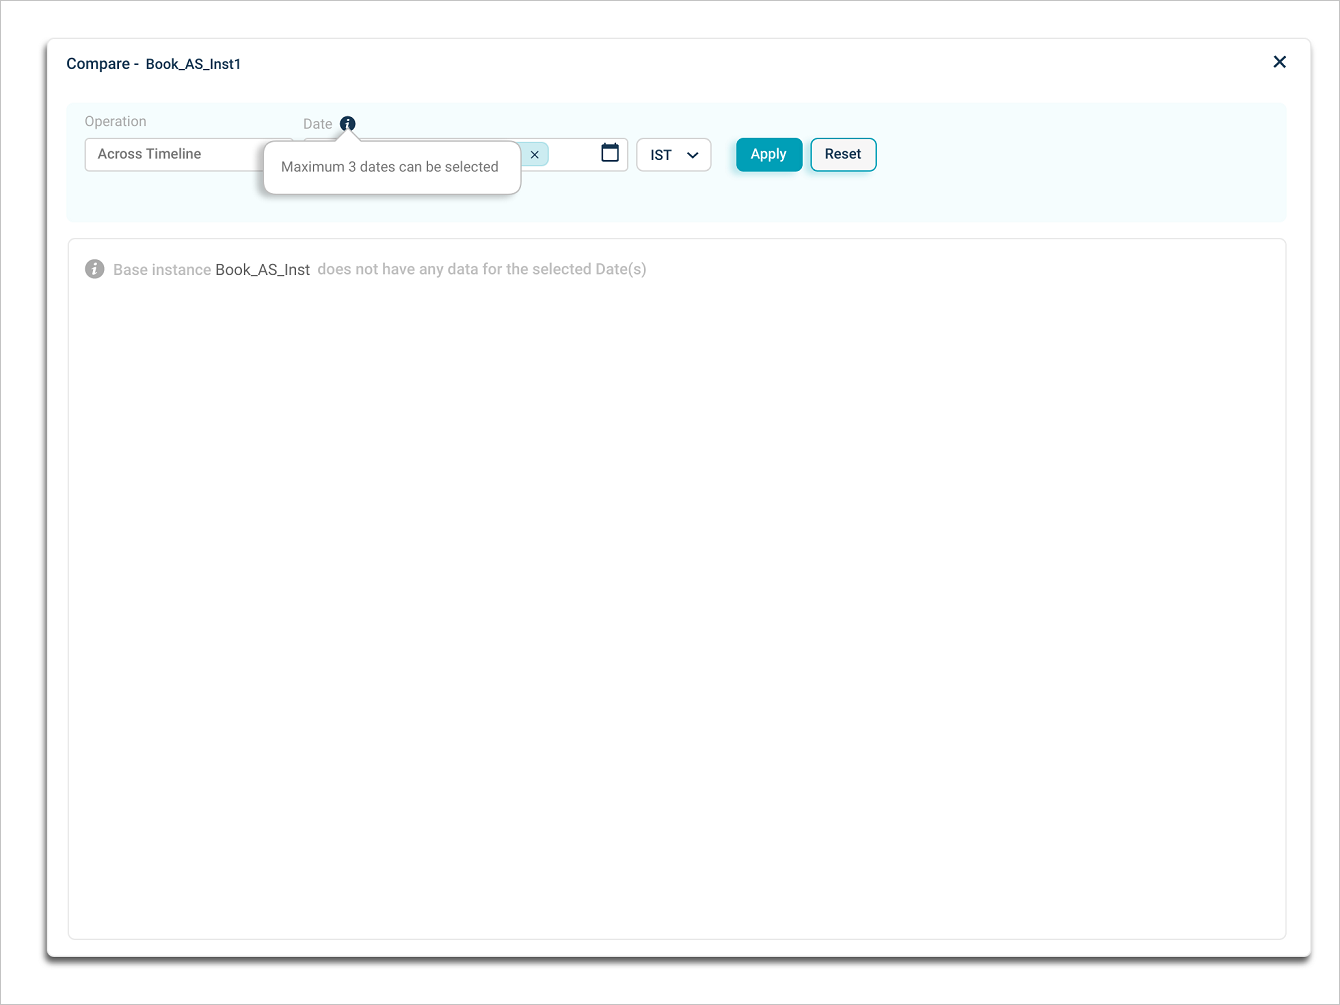
Compare
Select the Date box to select the dates you need to compare across timeline. If you need to remove any date you added earlier, you need to deselect the same from the Calendar box. Application adds the date you select for the base instance using Global date picker by default in the date box. You cannot deselect this date.
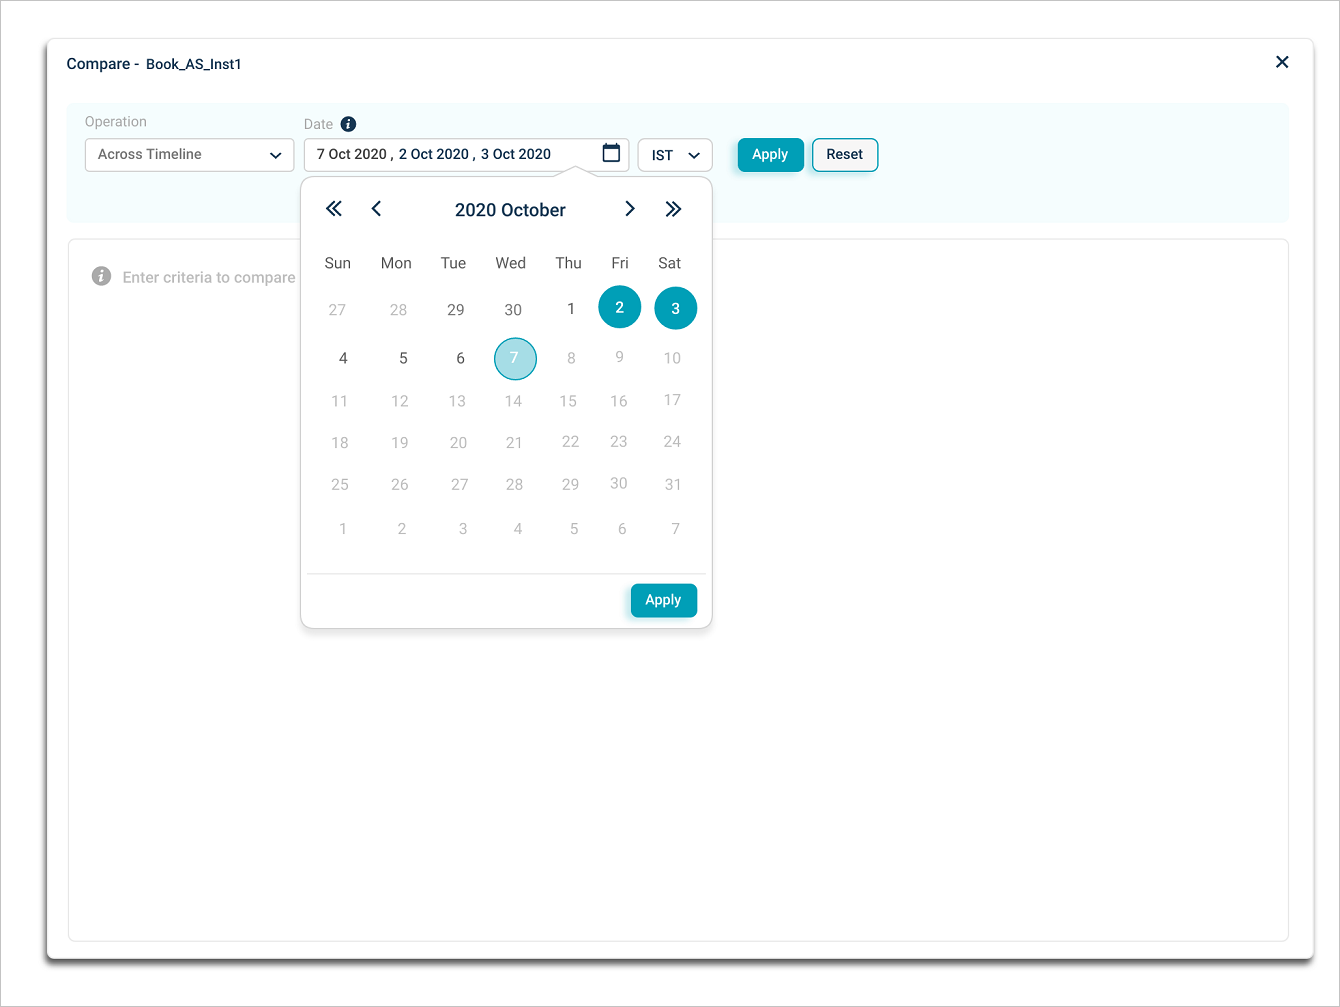
Compare
If the base instance has data, you can view the results of comparison as displayed in following screen.
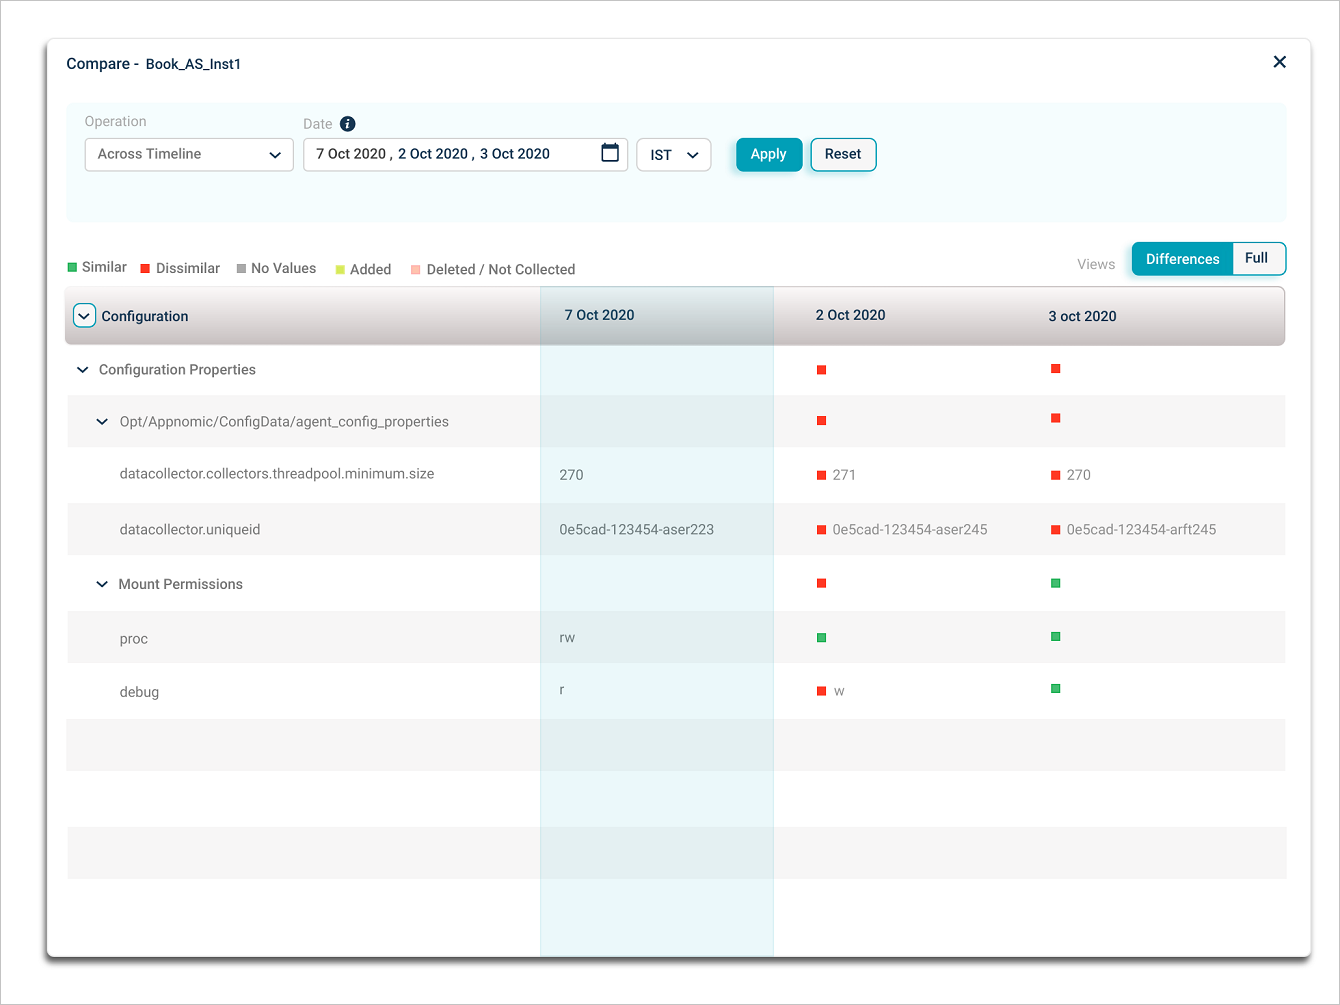
Compare