How Can We Help?
To generate the Capacity Forecast for your application, follow the steps below:
1. Navigate to the Application Summary page, and see Application Summary Navigation.
2. Select the “Generate Capacity Forecast” option located in the Growth Plan-Based Forecast section. The following screen appears.
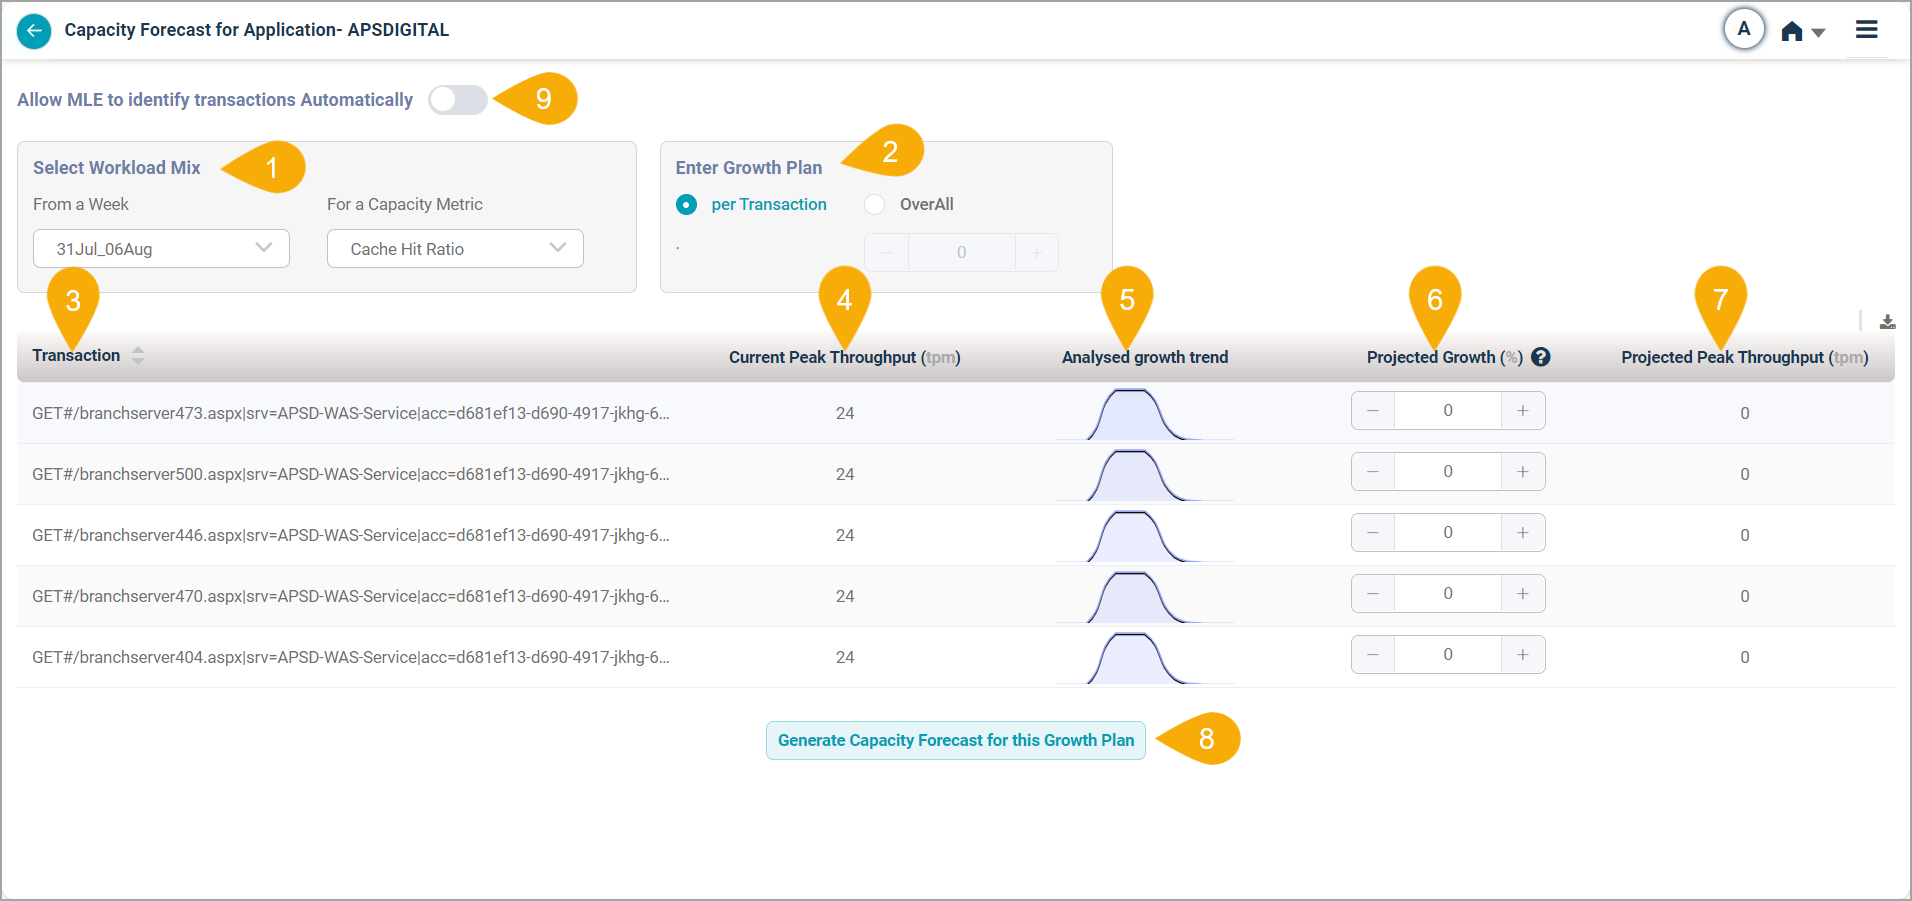
Capacity Forecast for Application
Field | Description |
|---|---|
1 – Select Workload Mix | You can select a workload mix in the following ways:
|
2 – Enter Growth Plan | For any listed transactions, you can input a growth plan. Alternatively, you can input an overall growth plan for all transactions by specifying a percentage increase in transaction volume. |
3 – Transaction | Depending on the selected Workload Mix, a corresponding list of Transactions is loaded. In cases where workload data is unavailable, the list displays the instances in the Transactions. |
4 – Peak Throughput | The Peak Throughput refers to the highest volume of transactions that occurred within the period analyzed. |
5 – Analysed Growth Trend | The spark line represents the daily volume of each transaction for a selected week, giving a visual representation of transaction activity over the course of the week. |
6 – Growth Plan | The growth percentage can be adjusted using the slider up to one thousand. |
7 – Projected Peak Throughput | The Projected Peak Throughput is based on the current volume of transactions and the anticipated increase in transaction volume. |
8 – Generate Capacity Forecast | Select Generate Capacity Forecast for this Growth Plan to generate the Capacity Forecast heat map. |
9 – Allow MLE to identify transactions automatically | Enabling this button, MLE will automatically identify and categorize transactions for you, reducing manual input and ensuring more accurate transaction classifications. |
Generate Capacity Forecast for Growth Plan
Initiating the Forecast Generation
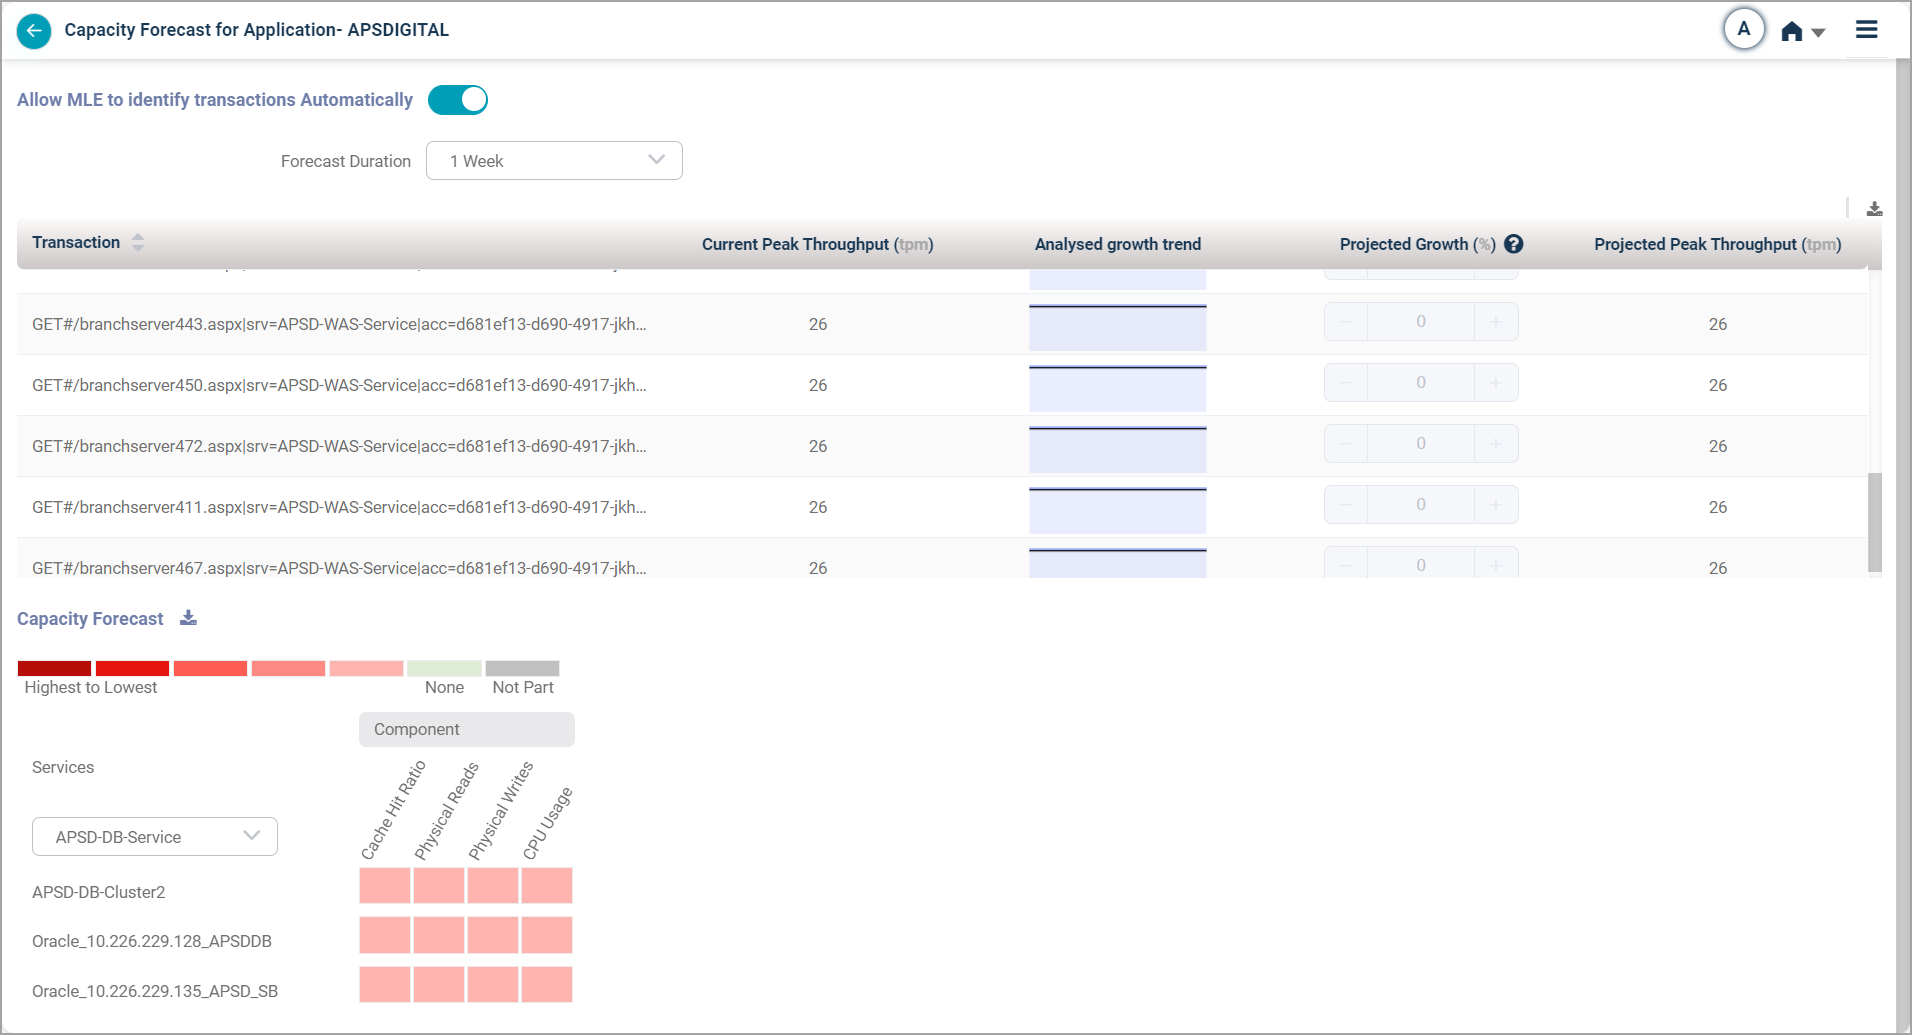
Locate and select the “Generate Capacity Forecast for this Growth Plan” option.
Upon selection, the application will load a Capacity Forecast heat map at the bottom of the screen.
Downloading the Capacity Growth Forecast
To download the forecast details, locate and click on the download icon.
An .xlsl file will be downloaded containing the following information:
Transaction
Current Peak Throughput (tpm)
Analysed Growth Trend
Projected Growth (%)
Generate Capacity Forecast for Growth Plan
Initiating the Forecast Generation
Locate and select the “Generate Capacity Forecast for this Growth Plan” option.
Upon selection, the application will load a Capacity Forecast heat map at the bottom of the screen.
Downloading the Capacity Growth Forecast
To download the forecast details, locate and click on the download icon.
An .xlsl file will be downloaded containing the following information:
Transaction
Current Peak Throughput (tpm)
Analysed Growth Trend
Projected Growth (%)
Projected Peak Throughput (tpm)
Generate Capacity Forecast for Growth plan
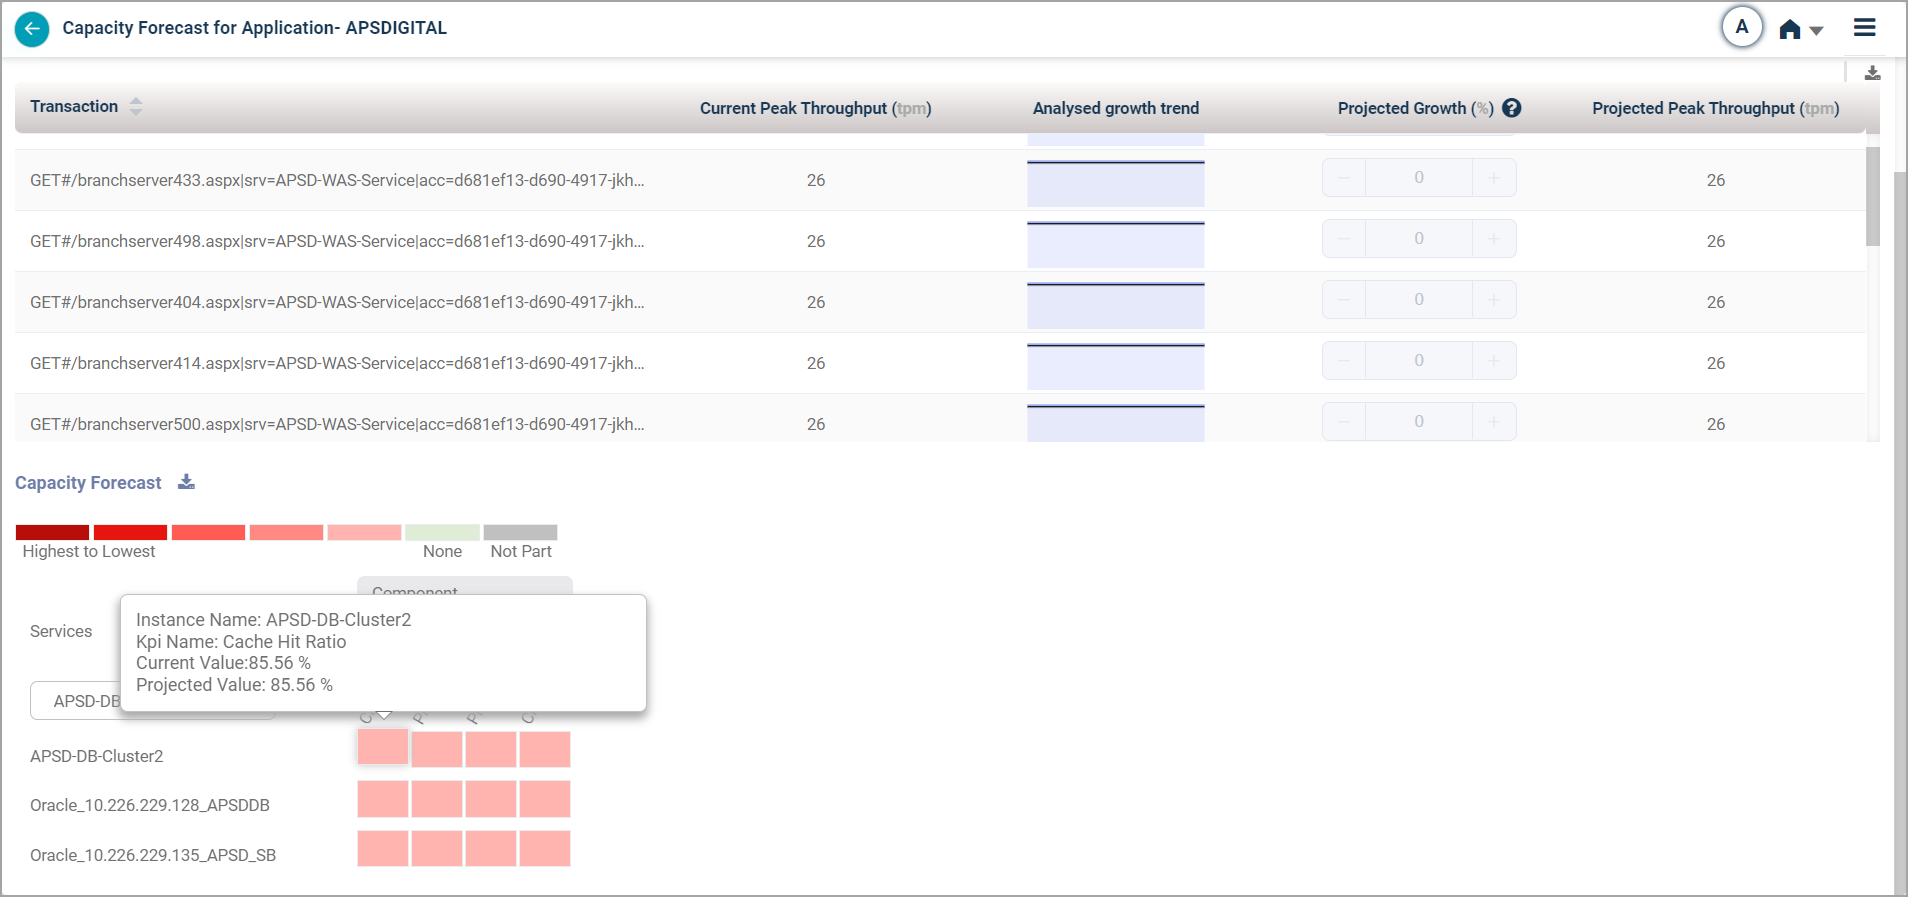
KPI in Heat Map
Hover over a KPI in the heat map to display a pop-up. This pop-up will display:
Instance Name: The name of the instance.
KPI Name: The name of the metric.
Current Value: The current value of the metric.
Projected Value: The projected value for the metric.
- Projected Peak Throughput (tpm)
KPI in Heat Map
MLE Automatic Transaction Trend Prediction
By default, the Allow MLE to identify transactions Automatically slider is disabled requiring you to manually adjust the slider in the Projected Growth column to input the transaction volume.
However, if you enable this slider, MLE automatically predicts the transaction trend, eliminating the need for manual input. MLE also automatically forecasts the Peak Throughput for the transactions.
The projected growth for the transactions is calculated as follows:
Projected Growth % = ((Projected Peak Throughput – Current Peak Throughput)*100)/Current Peak Throughput
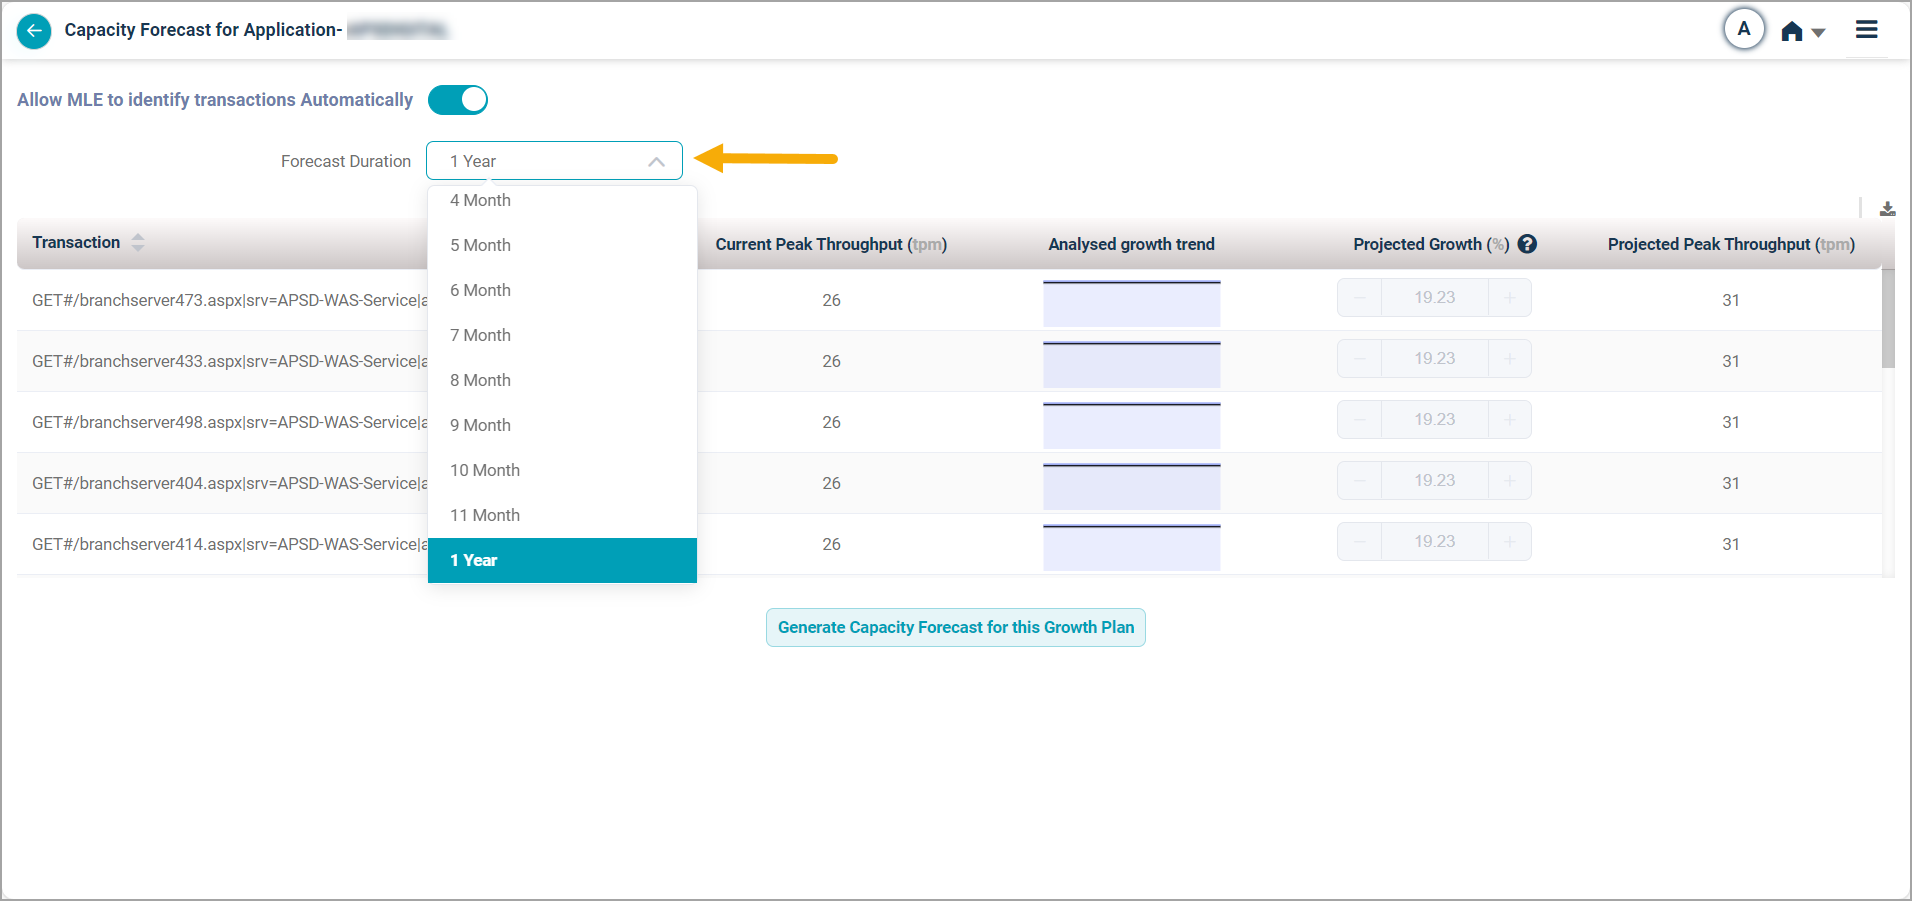
Selecting the Forecast Duration
On the Capacity Forecast screen, you can find a dropdown menu labeled “Forecast Duration.”
Click on the dropdown to view the available durations.
Select your desired duration, with options available up to 1 year.
Based on the duration you select, MLE automatically predicts the percentage growth for the transaction using historical trends.
Capacity Forecast for Application
Allow MLE to Identify Transactions Automatically