How Can We Help?
Introduction
HEAL displays the key performance-related data of Android and iOS mobile applications. HEAL displays details like CPU utilization, memory usage, network usage, etc. This gives insights into past performances or the performance in a small, medium, or large time scope.
Performance Details in HEAL UI
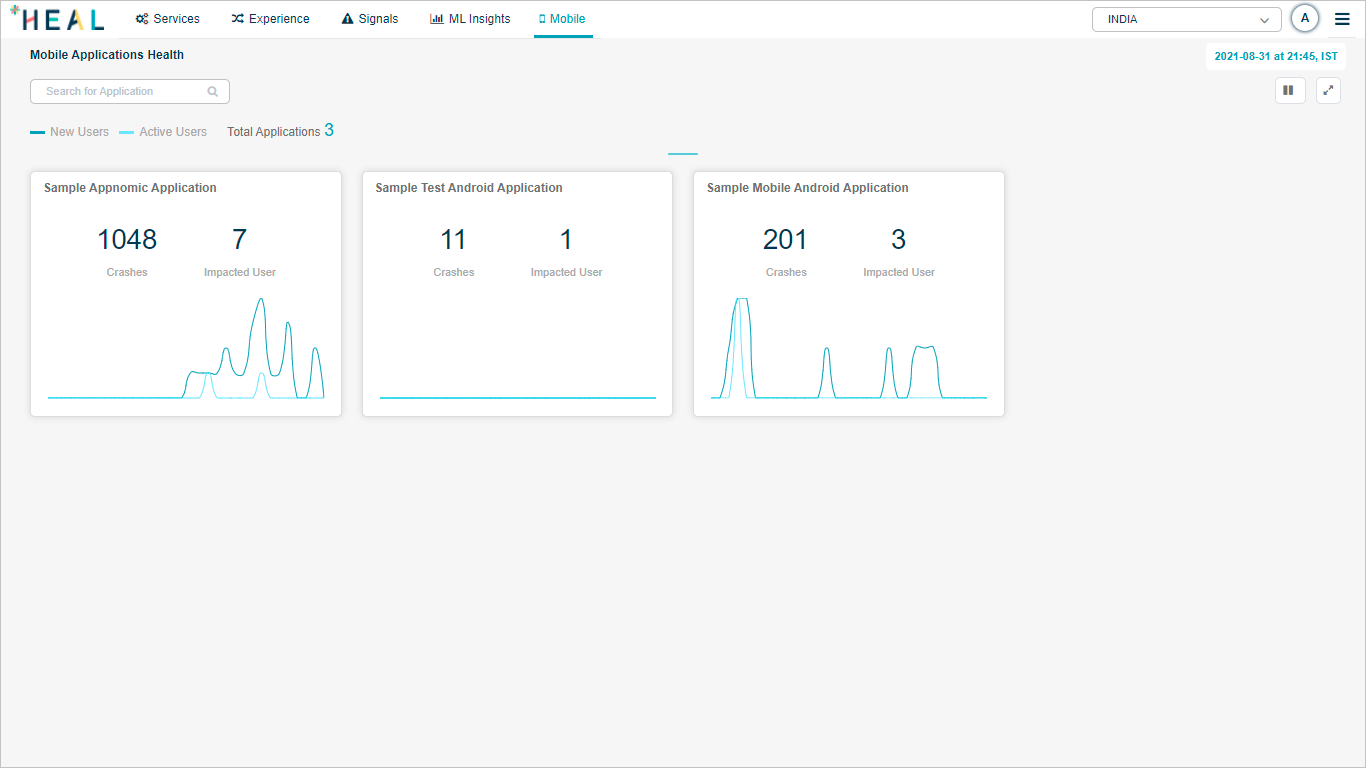
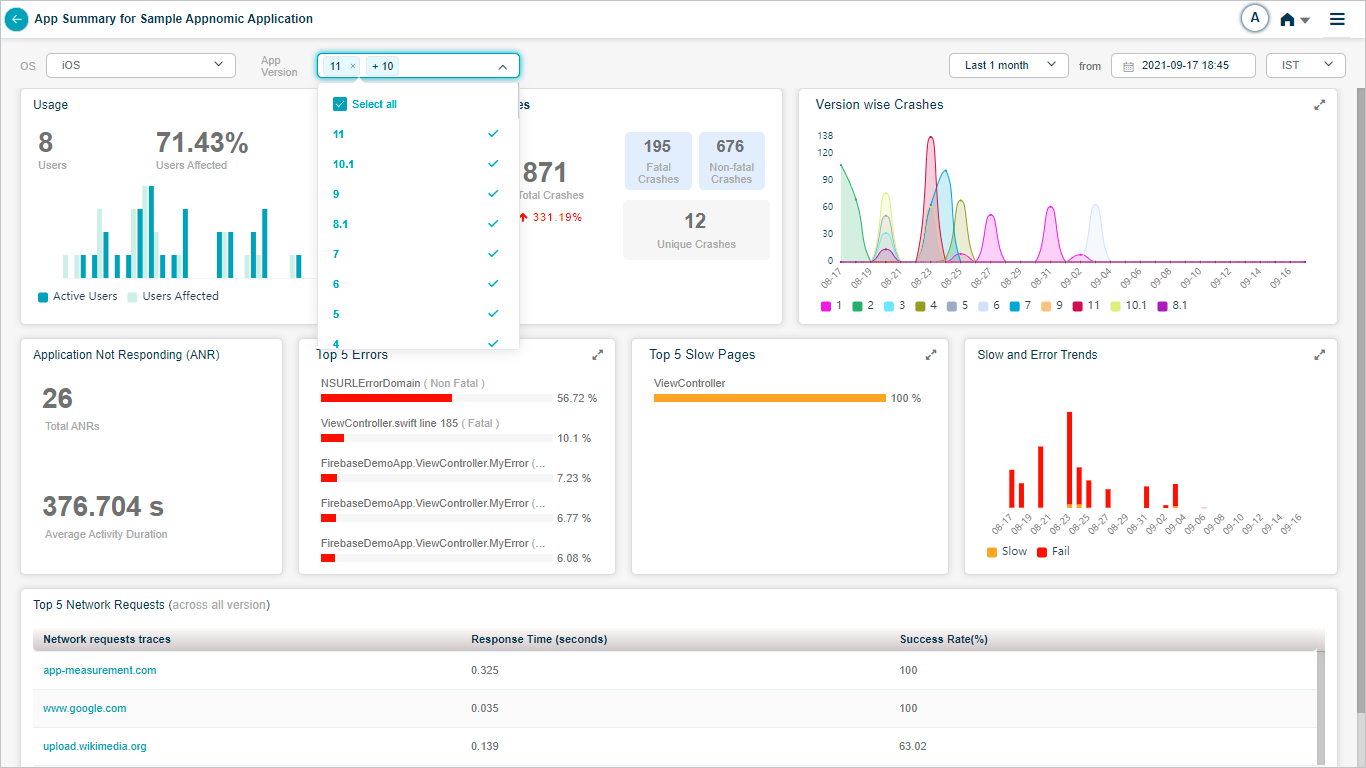
HEAL displays details of multiple mobile applications. You can choose an application to view the details about. HEAL displays the trend of New vs Active users for mobile applications. HEAL displays how many new users registered for the application and how many of those users are active. Select the application pod to view the performance details of the respective application.
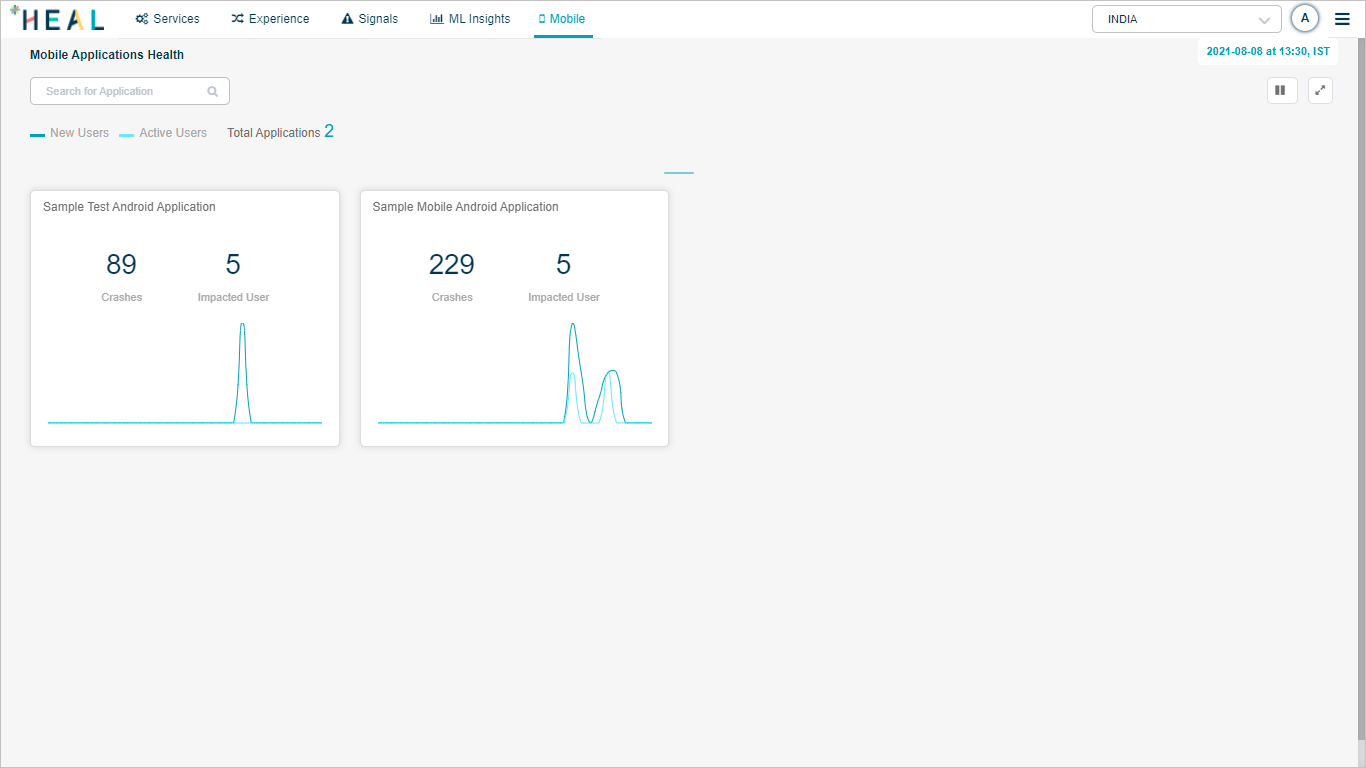
Mobile Applications Health
HEAL displays following screen.
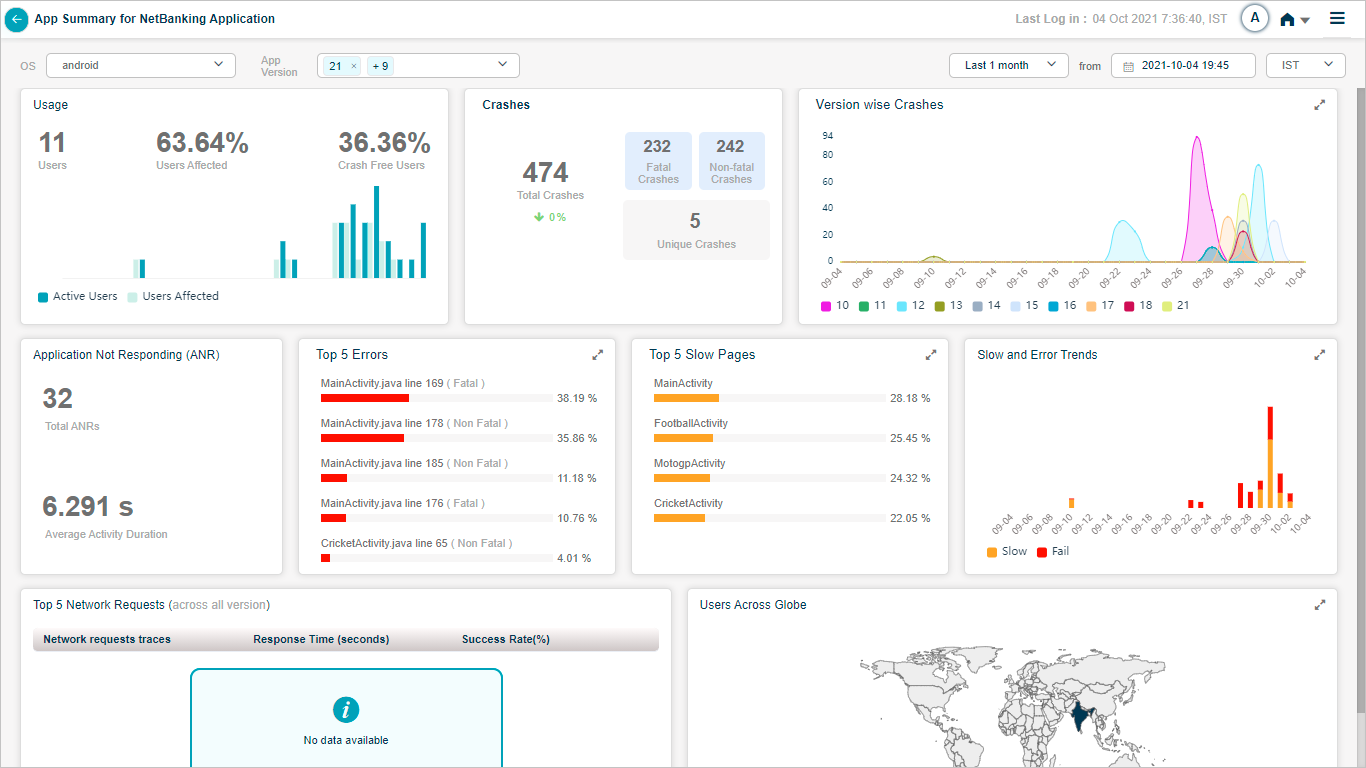
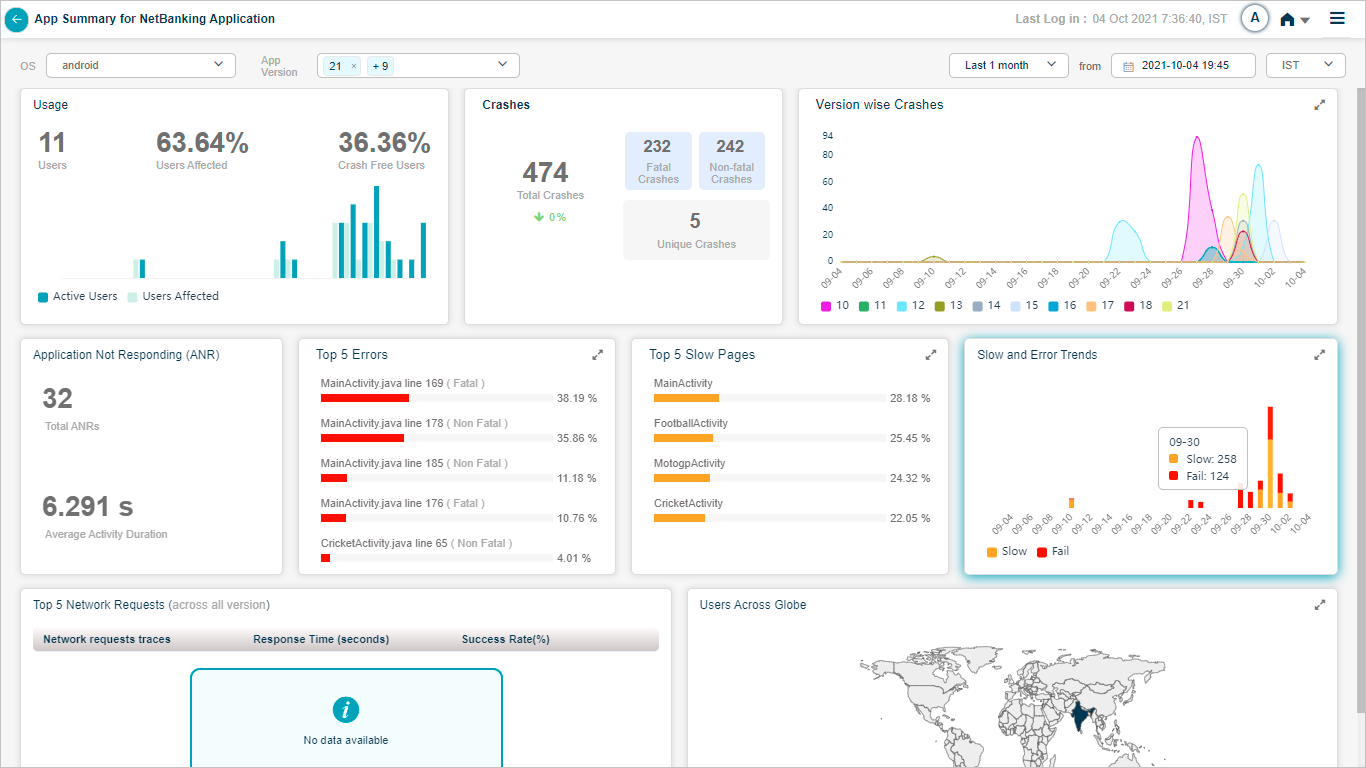
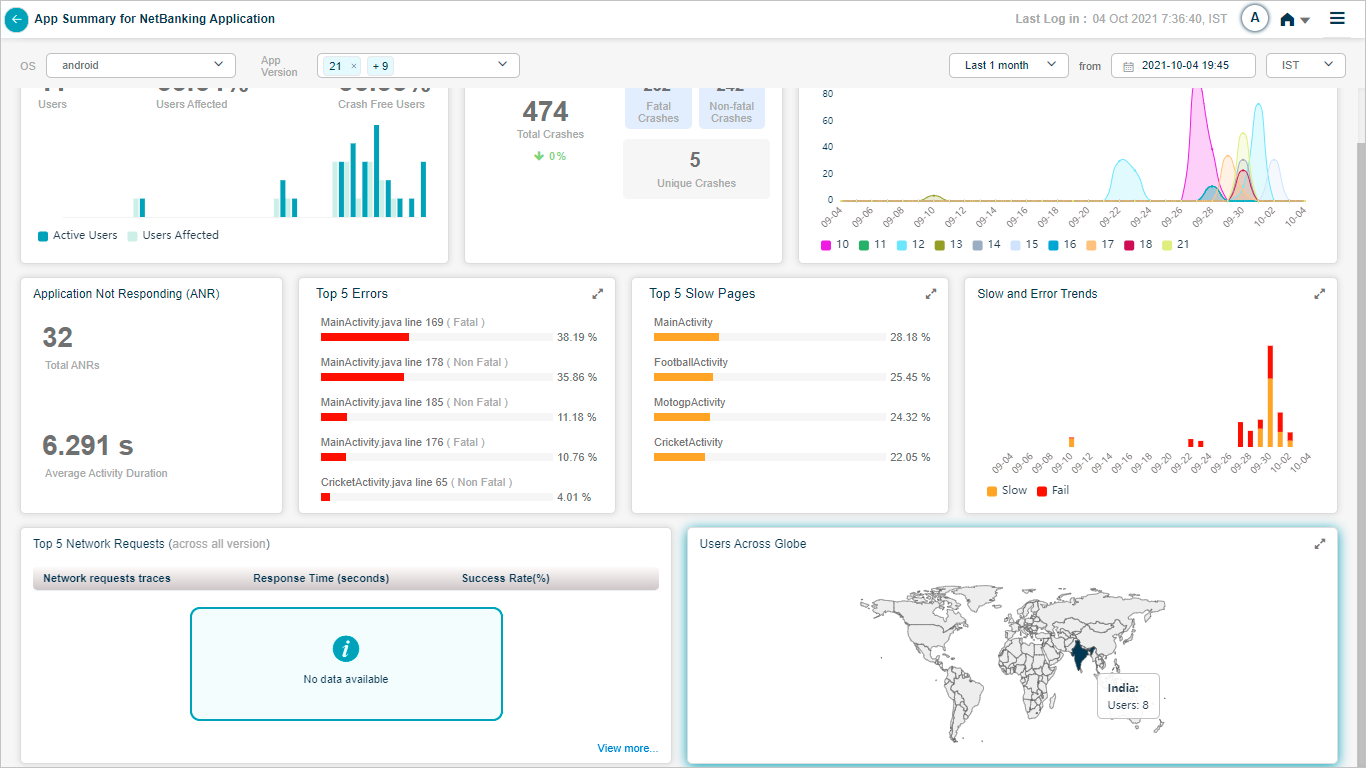
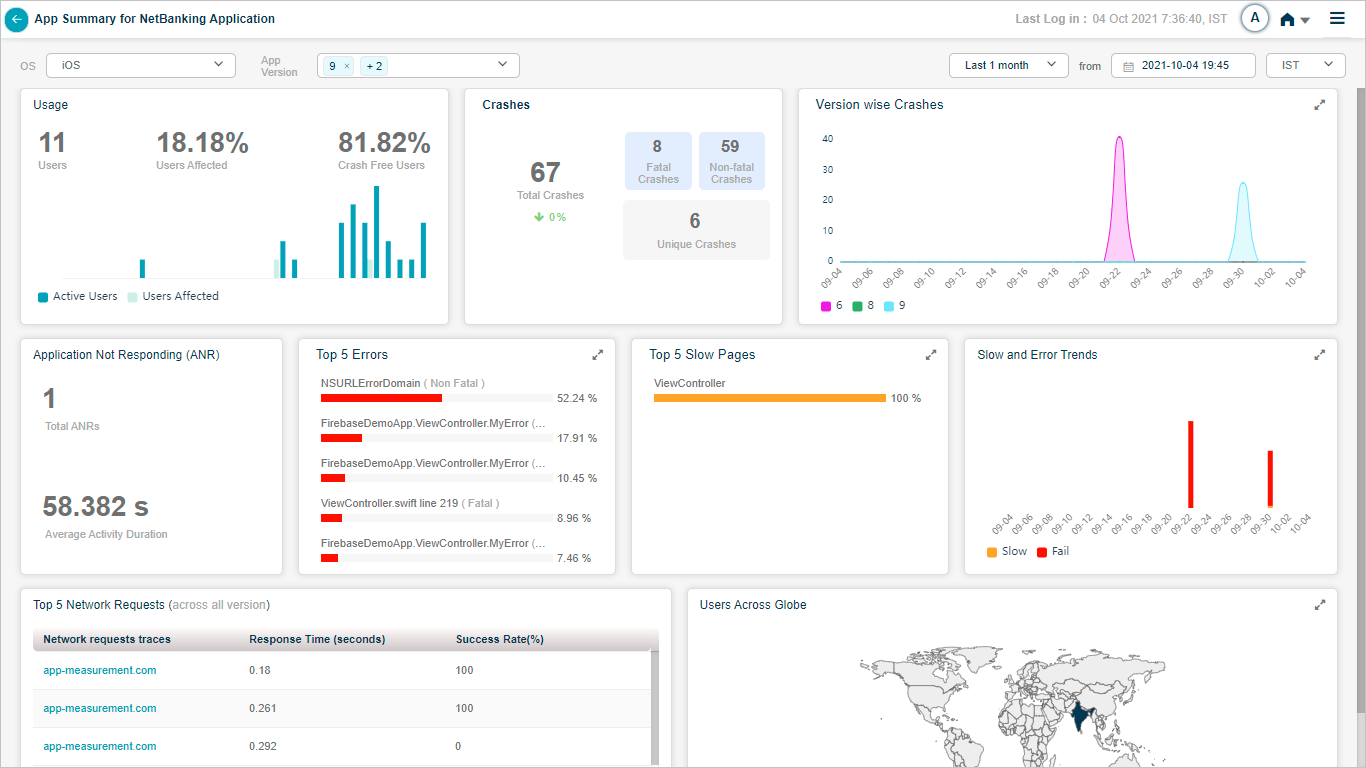
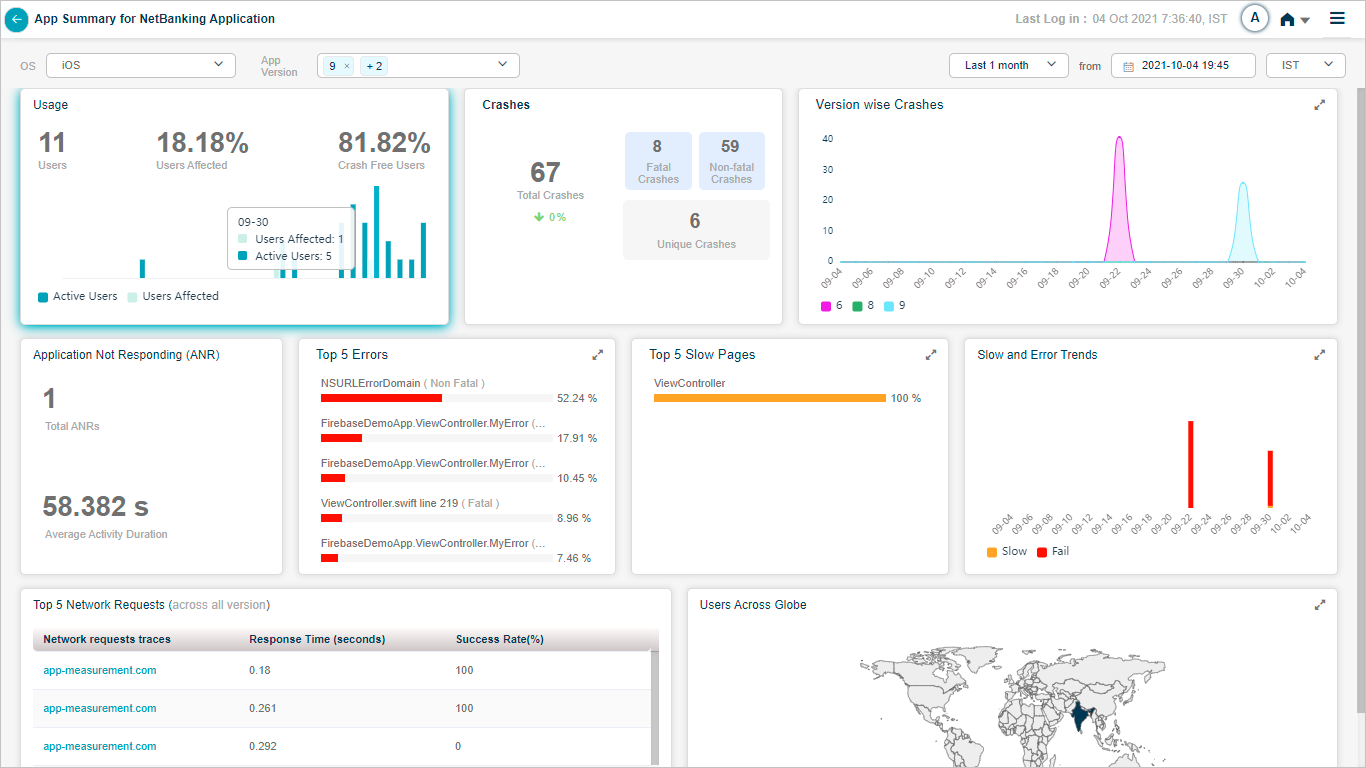
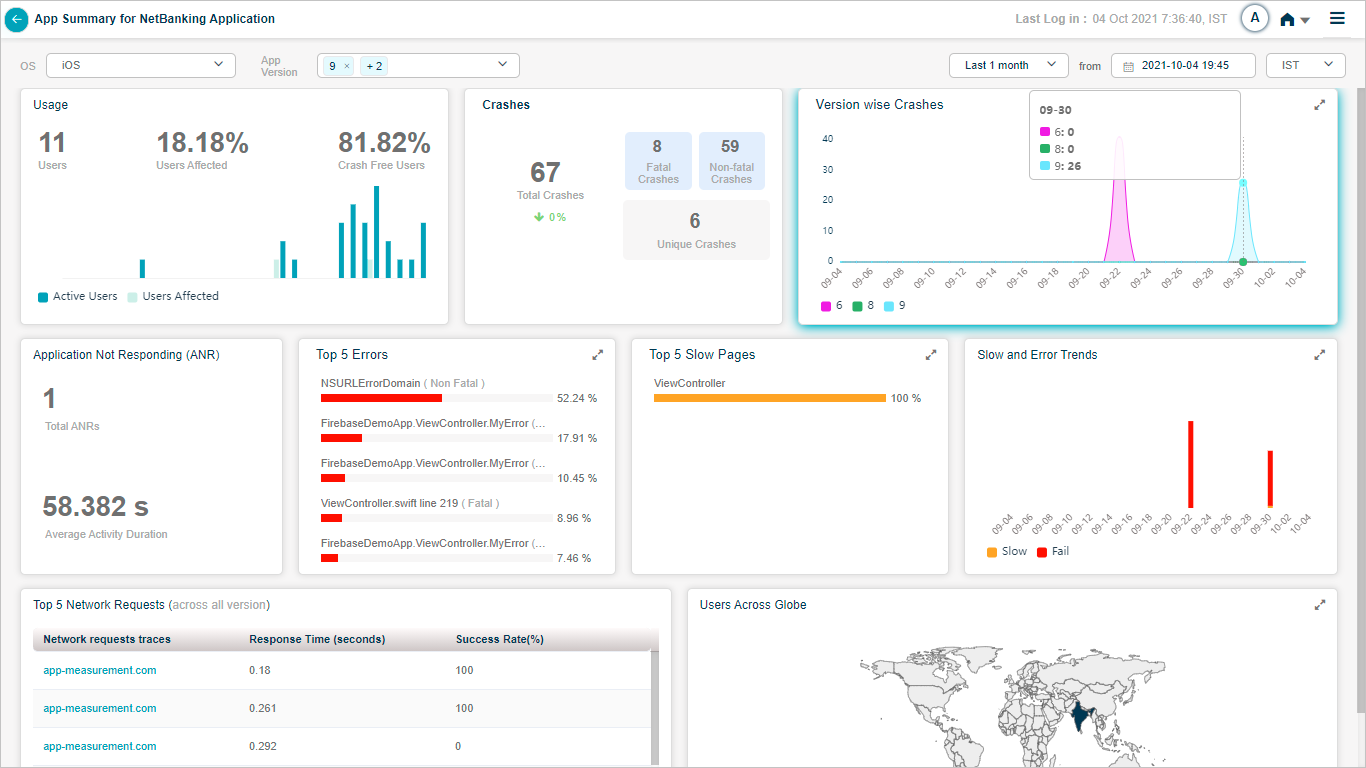
App Summary
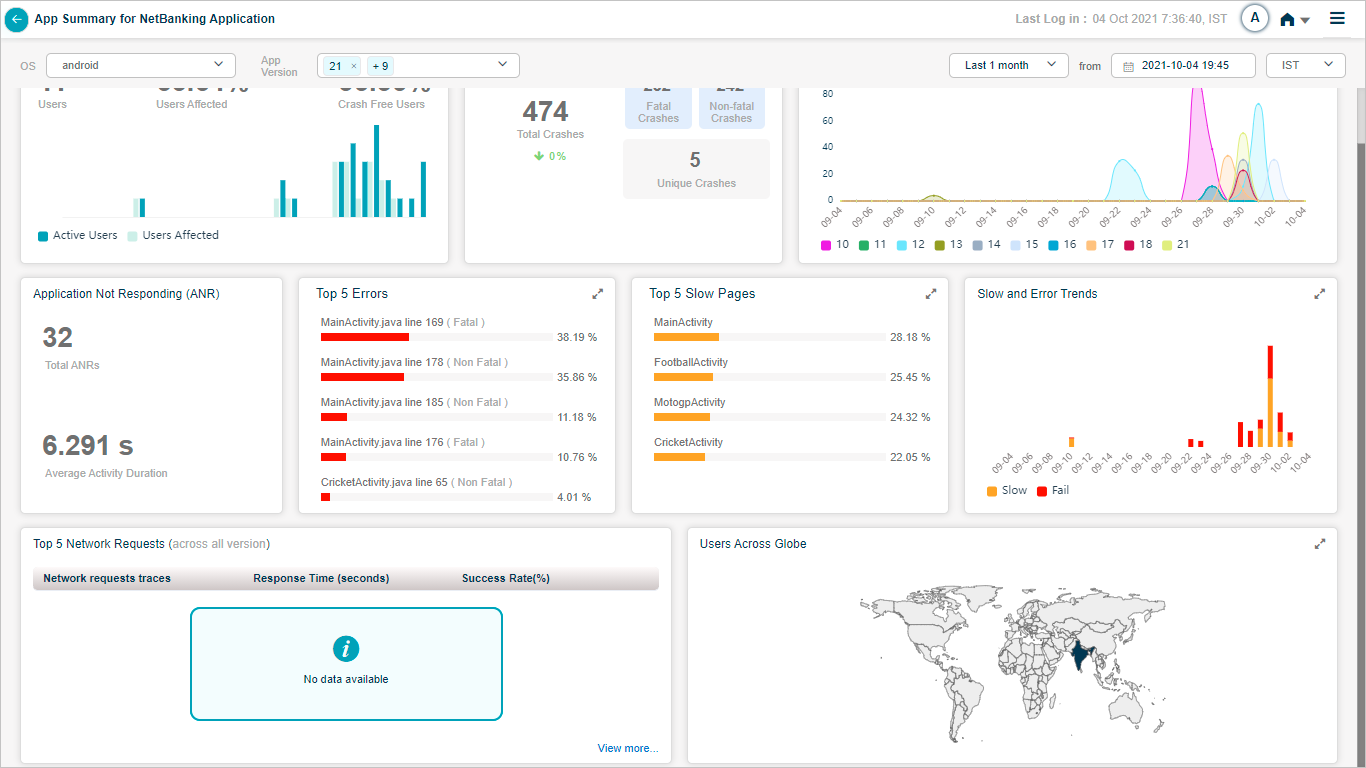
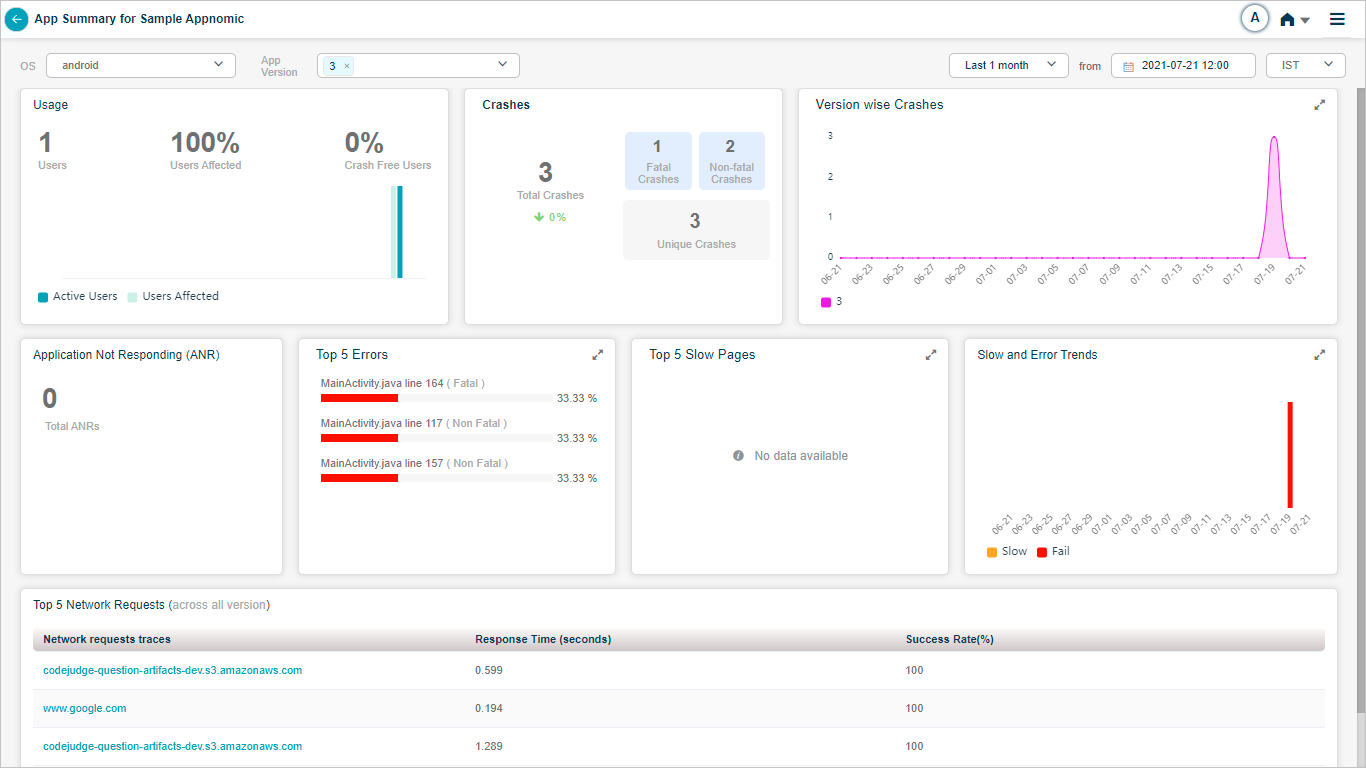
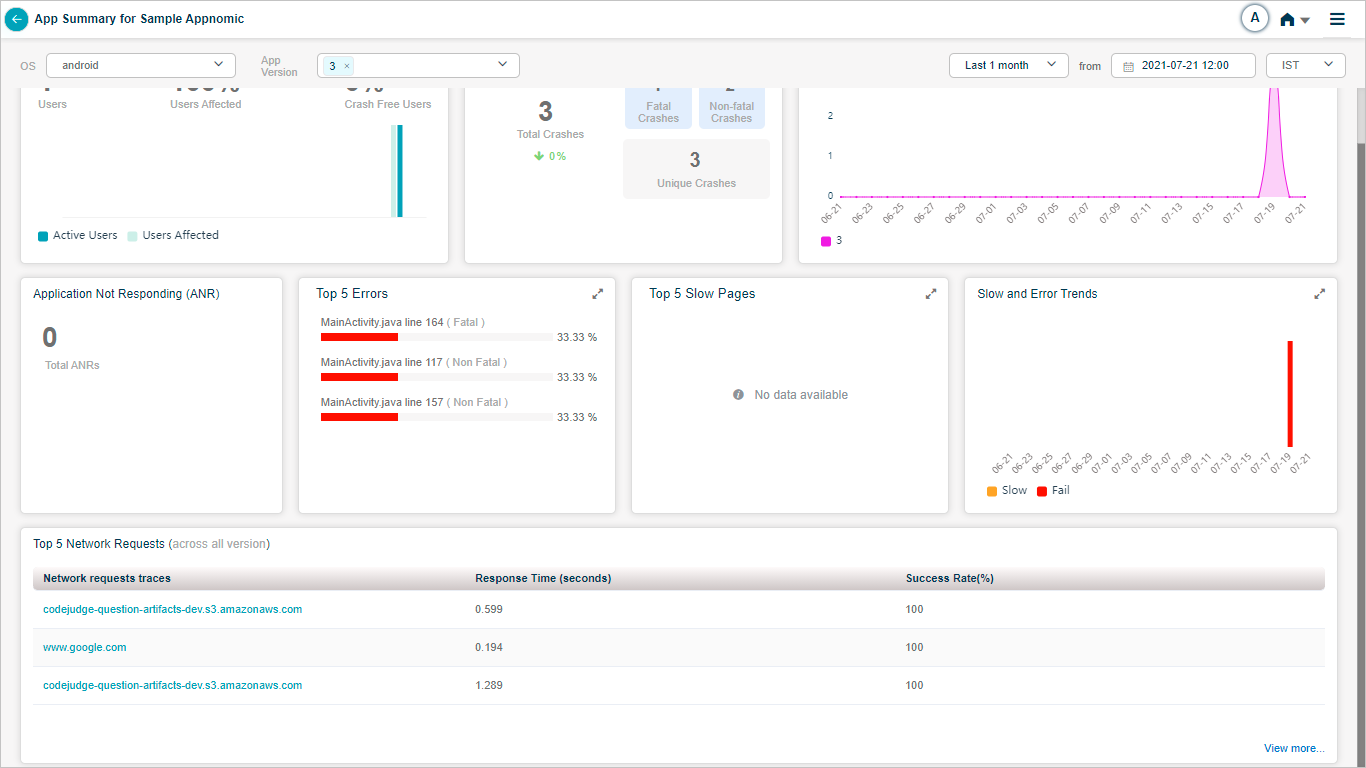
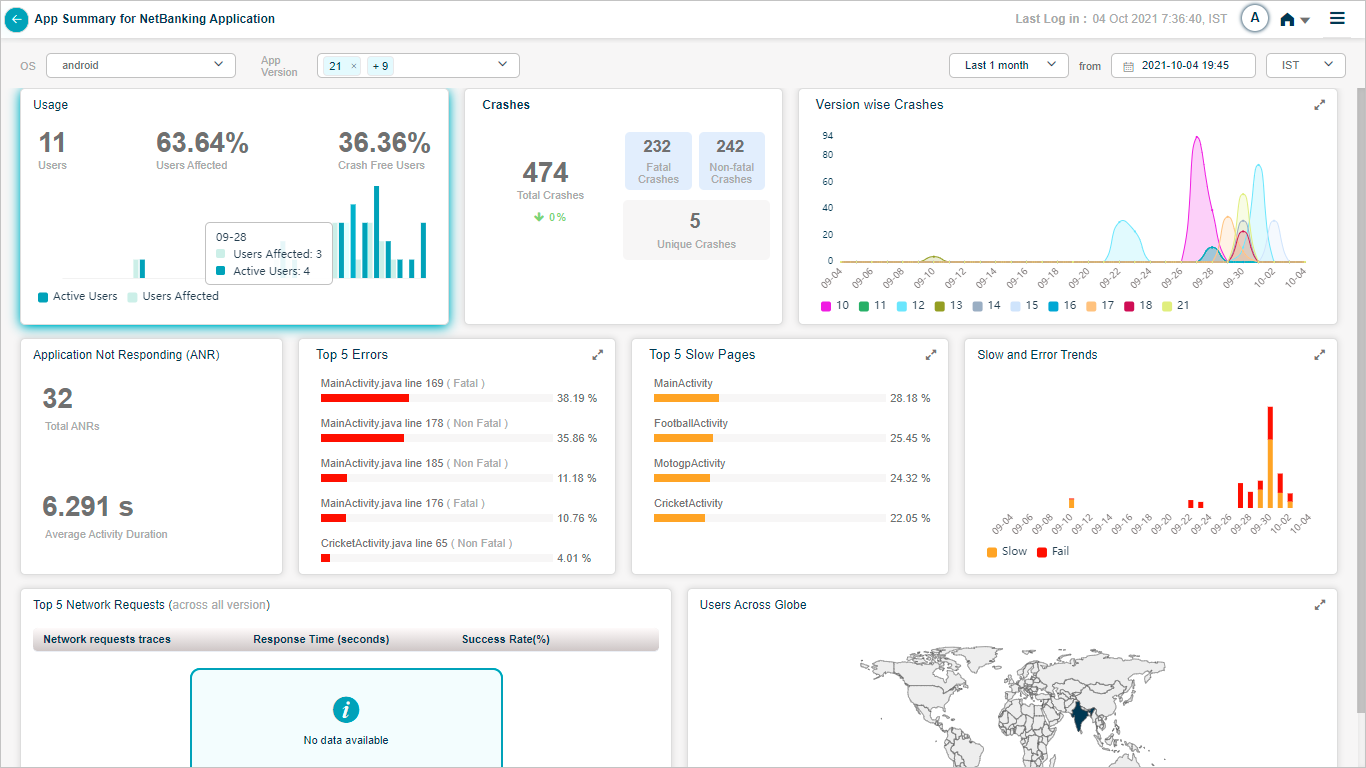
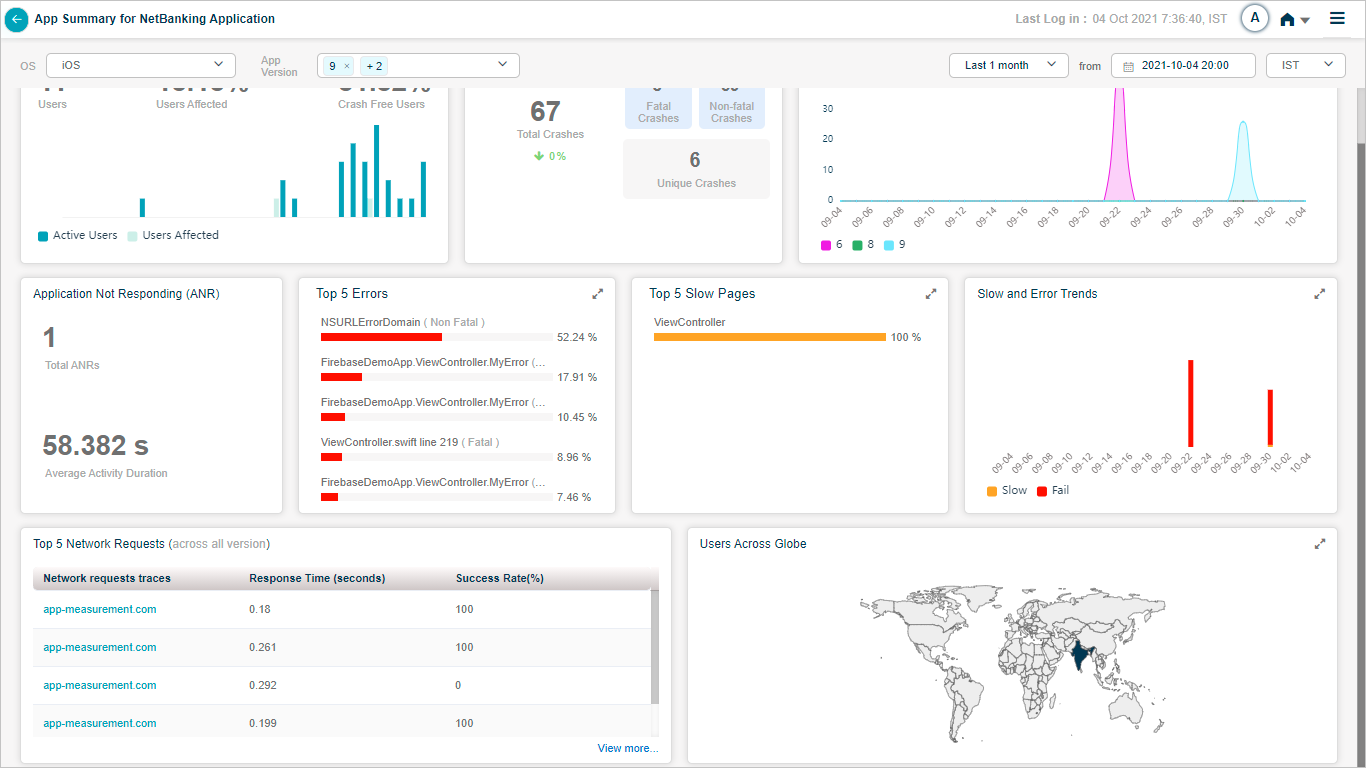
Usage pod displays the total number of users, percentage of users which got affected because of the crashes, and percentage of users which did not observe the crashes on their mobile handsets. HEAL displays the graph of Active vs Affected users.
HEAL displays total number of crashes, number of unique, fatal, and non-fatal crashes in Crashes Pod.
Fatal Crash – Mobile application stops functioning due to fatal crash.
Non-fatal Crash – Mobile application keeps functioning.
Unique Crash – This can be a fatal or a non-fatal crash. This is like a first time crash. It is a non-repeat crash. If there is increase in percentage of crashes, then HEAL displays the arrow mark in red color pointing upwards. If the percentage of crashes is normal, then HEAL displays the arrow mark in green color pointing downwards.
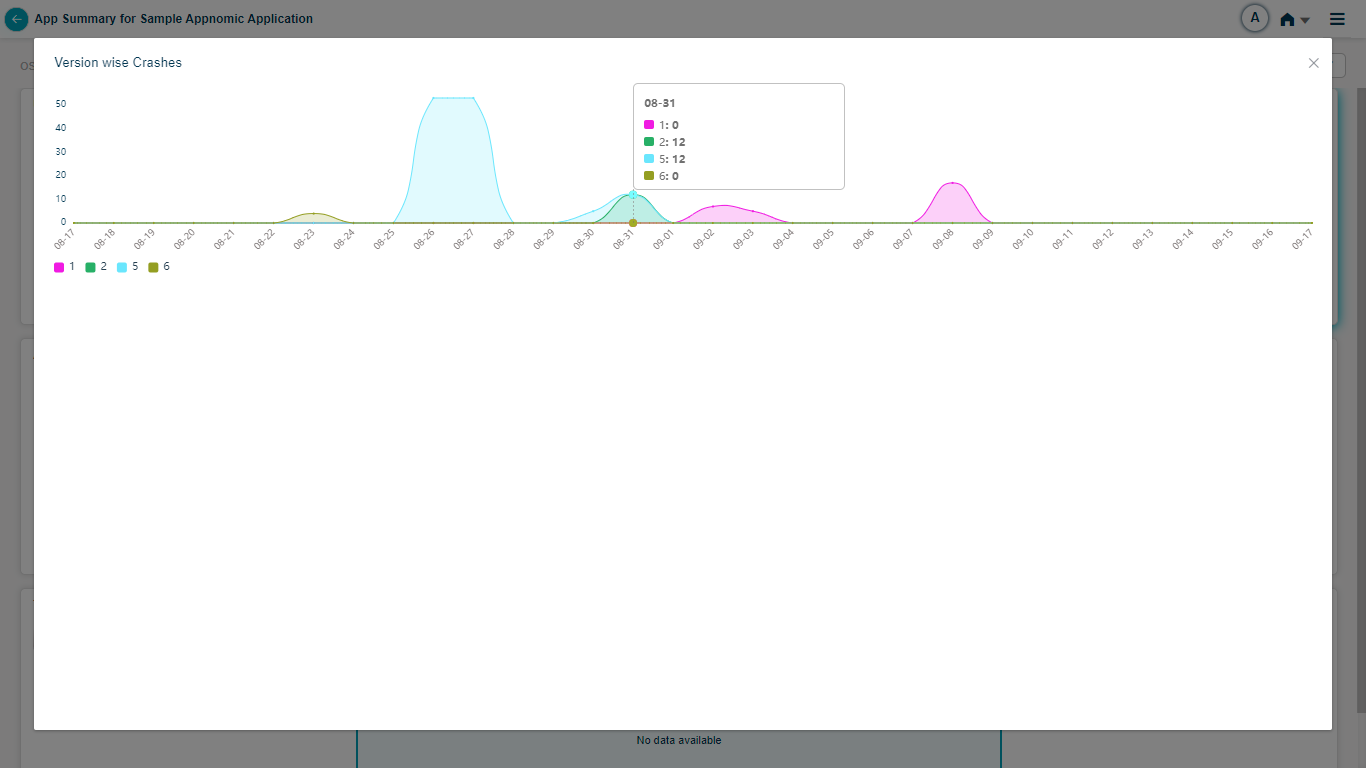
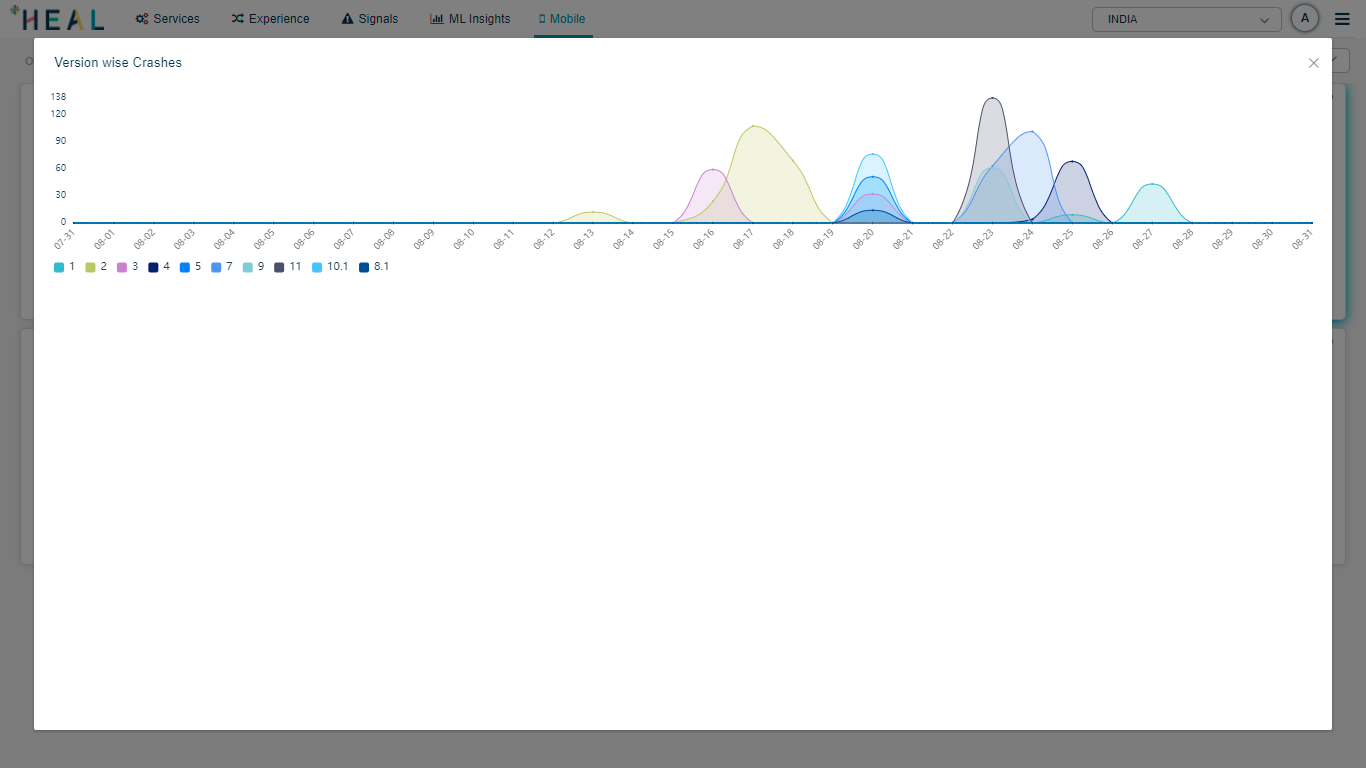
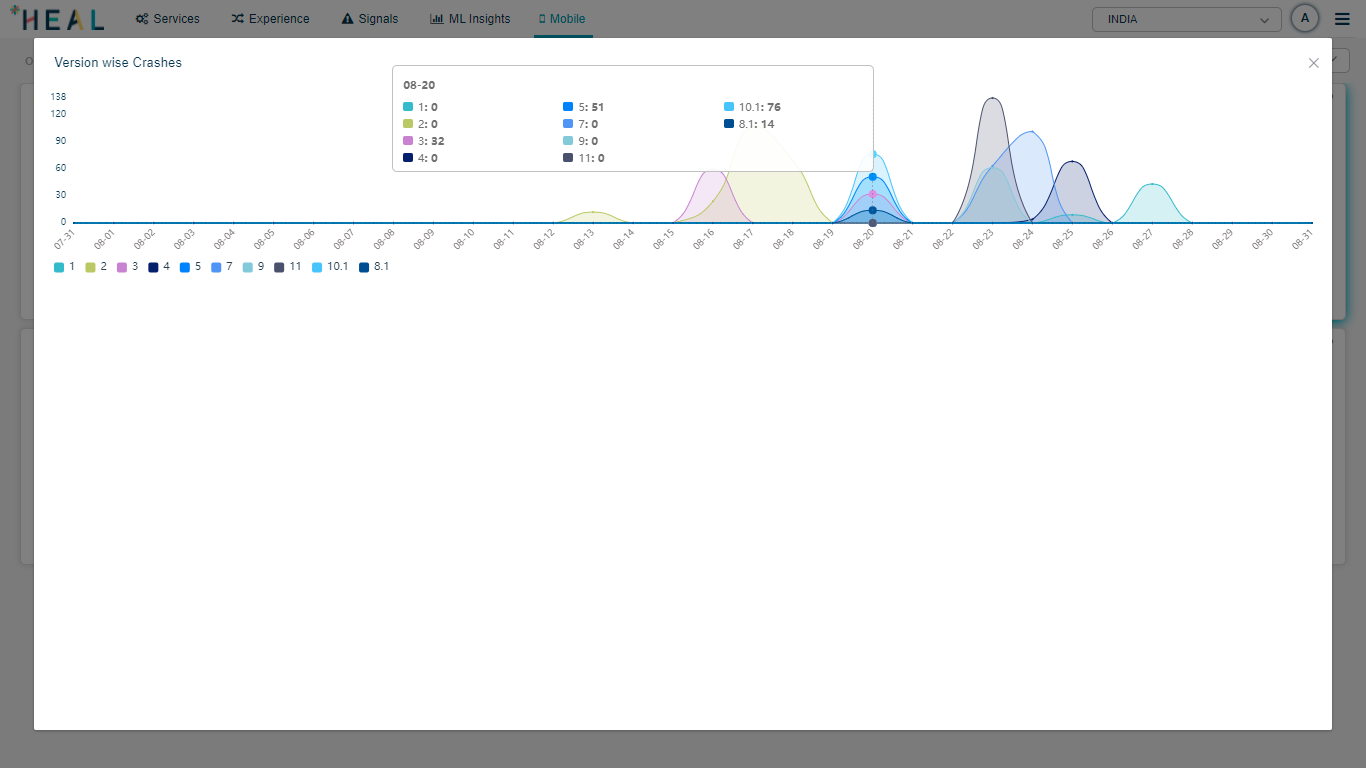
HEAL displays the number of crashes for all the versions that you select for the application in Version wise Crashes pod.
HEAL displays top five activity pages from the mobile application having errors in Top 5 Errors pod. Any page in the mobile application is an activity. HEAL displays the activity name i.e. the screen name, line number with error, type of the error, and percentage error for the activity. Percentage value indicates the occurrence of this error out of the total number of errors. In Android, each screen is a Java class file. Out of the total number of crashes you observe in the mobile application, x% of crashes happen due to some line number in a particular Java file. All these details are helpful to application developers.
HEAL displays top five slow running activity pages out of all the slow running pages from the mobile application in Top 5 Slow Pages pod. HEAL displays the top five activity names and the percentage slowness of these activities.
HEAL displays the time-series trend of slowness and errors in the mobile application in Slow and Error Trends pod.
Hover on a data point in Usage pod to view the number of active and affected users at that point in time. All these analytics are for global users.

App Summary
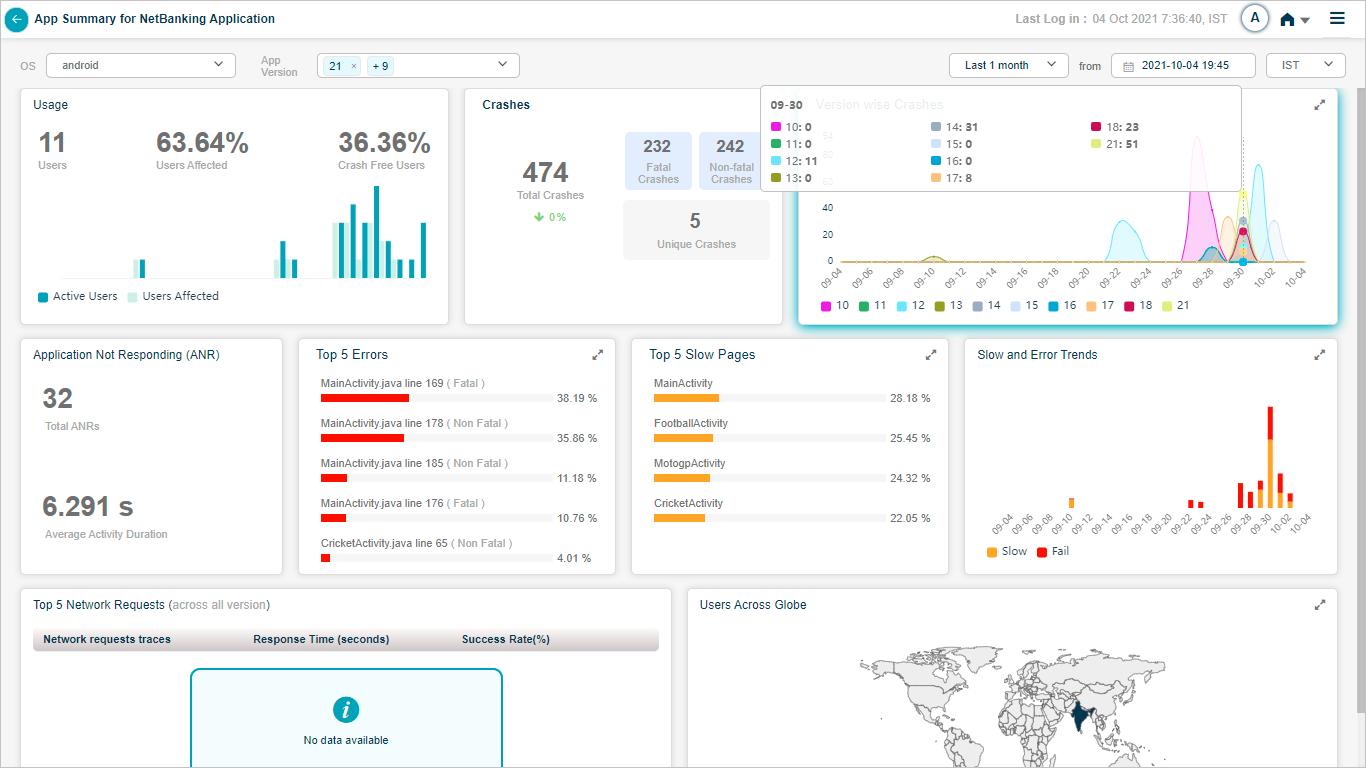
Hover on a data point in Version wise Crash pod to view the number of crashes for each of the versions you select for the mobile application.
App Summary
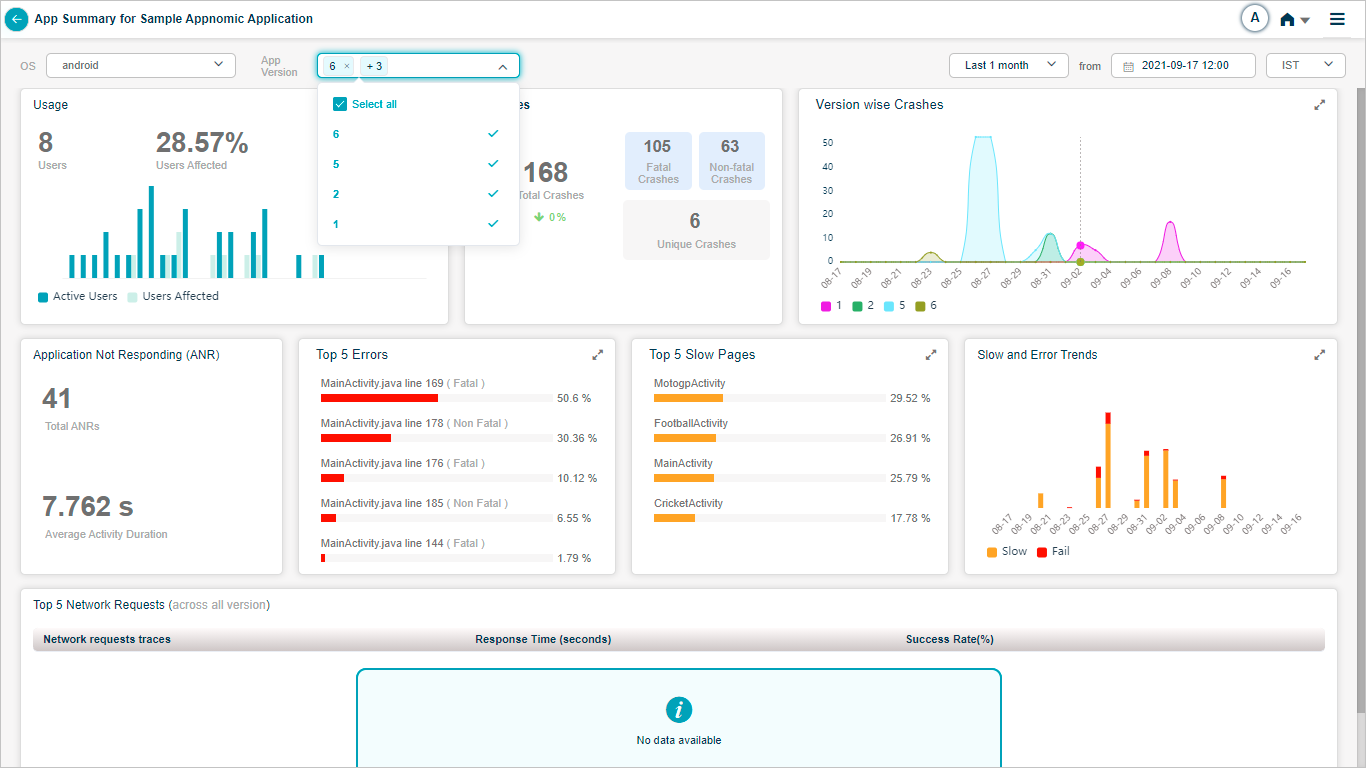
You can select any version of the application. You can select all versions as well.
App Summary
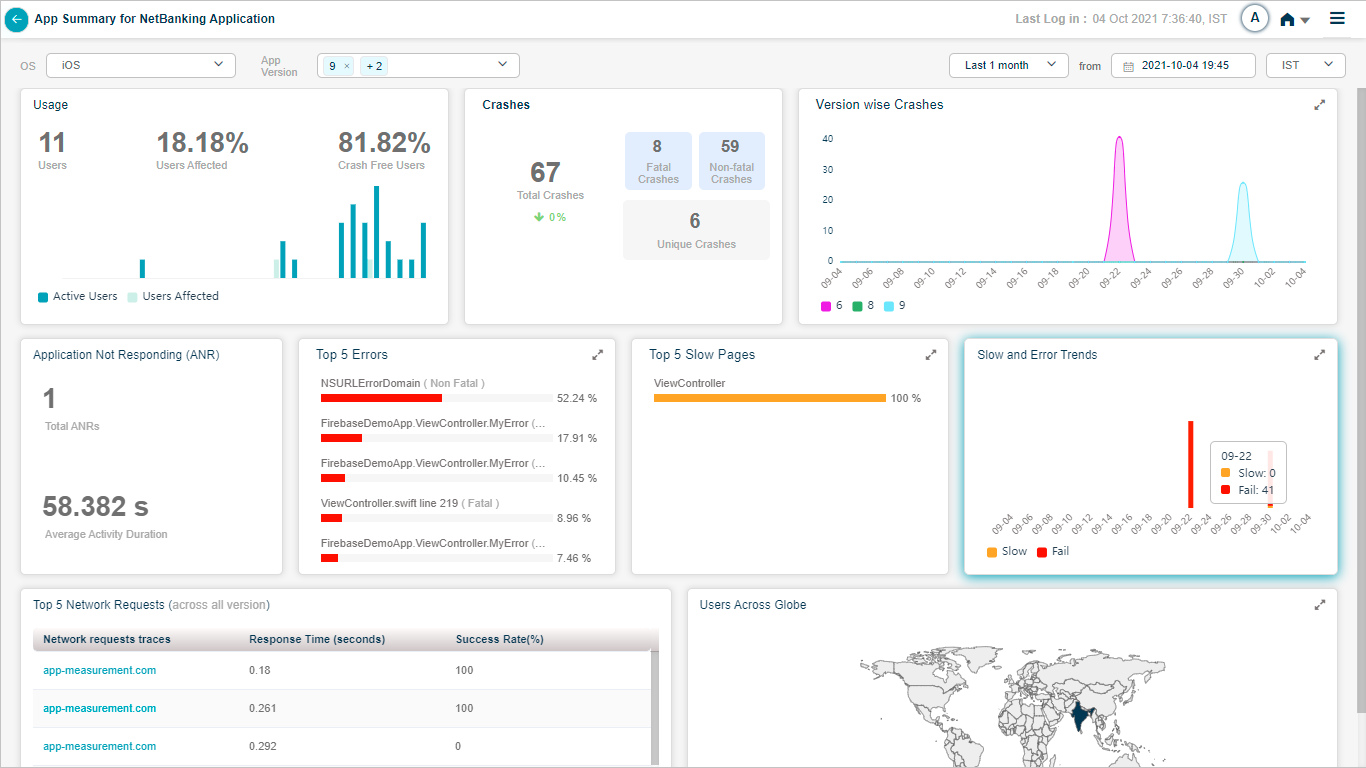
Hover on a data point in Slow and Error Trends pod to view the number of screens with errors and number of slow screens.
App Summary
Select on the icon in top right corner of any pod to view the full screen view of that pod.
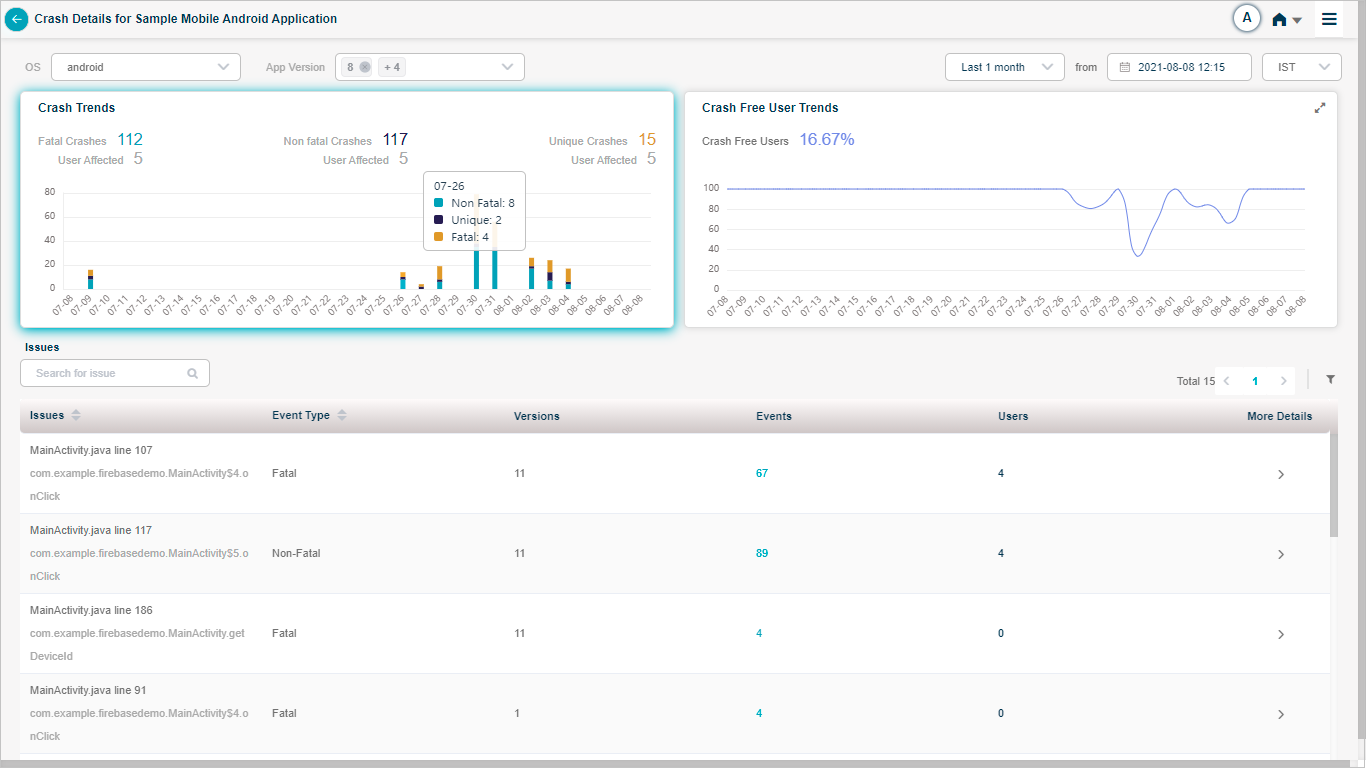
Crash_Detailed View
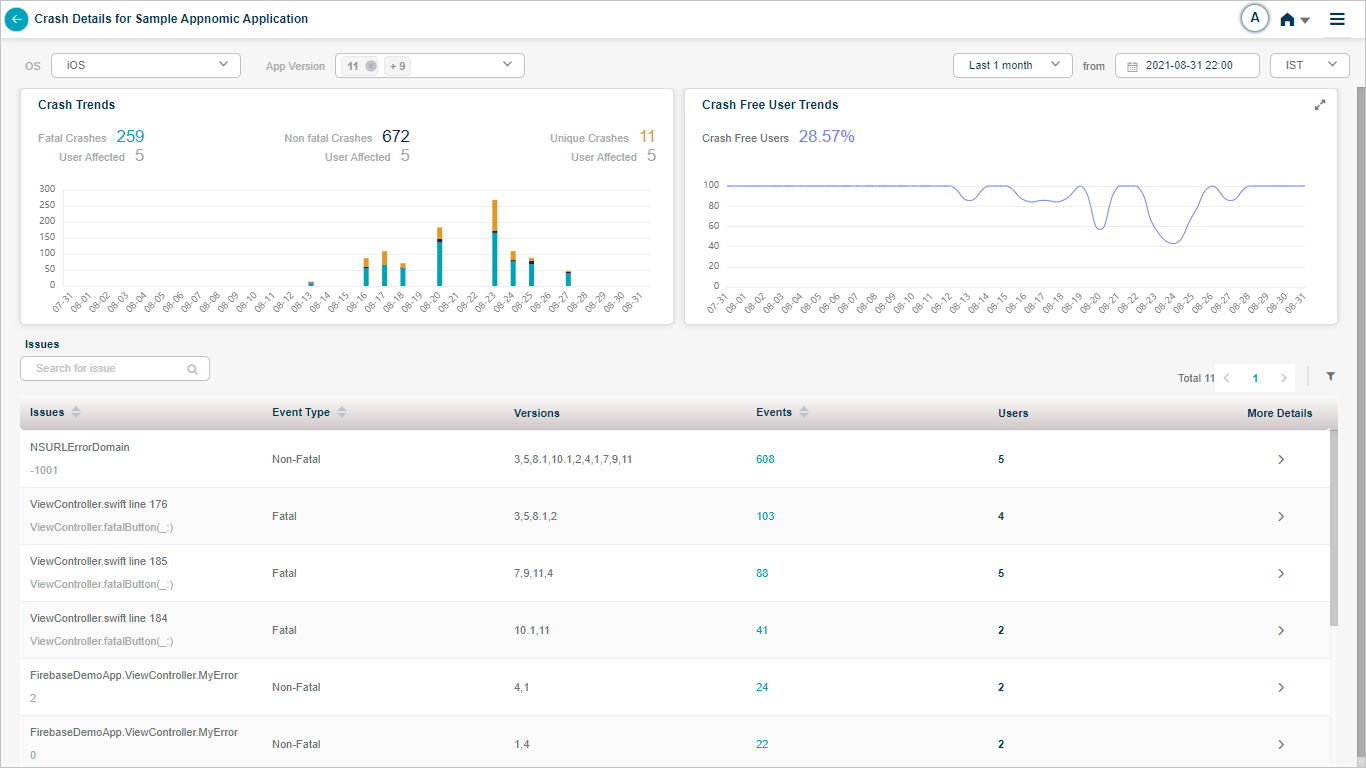
Crash Analytics
Select on Crashes pod to view the crash details for the mobile application.
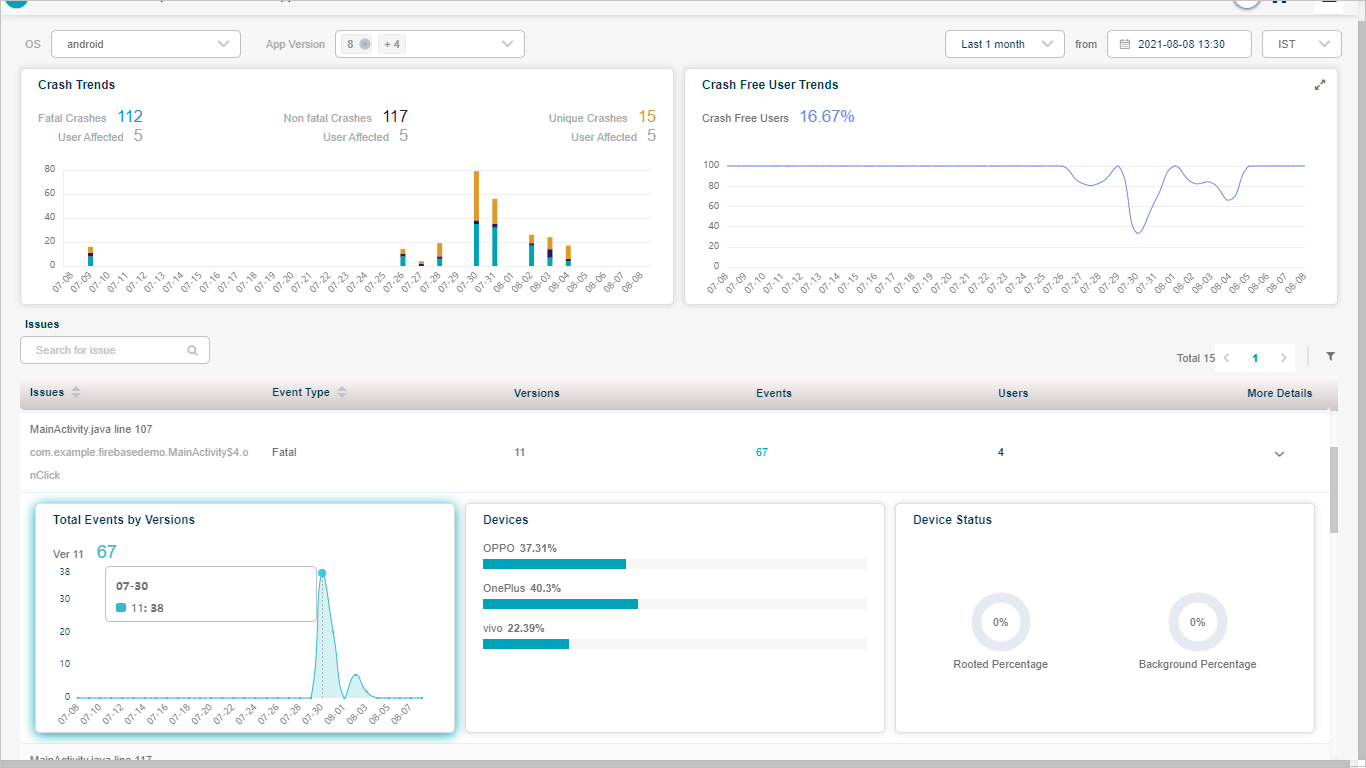
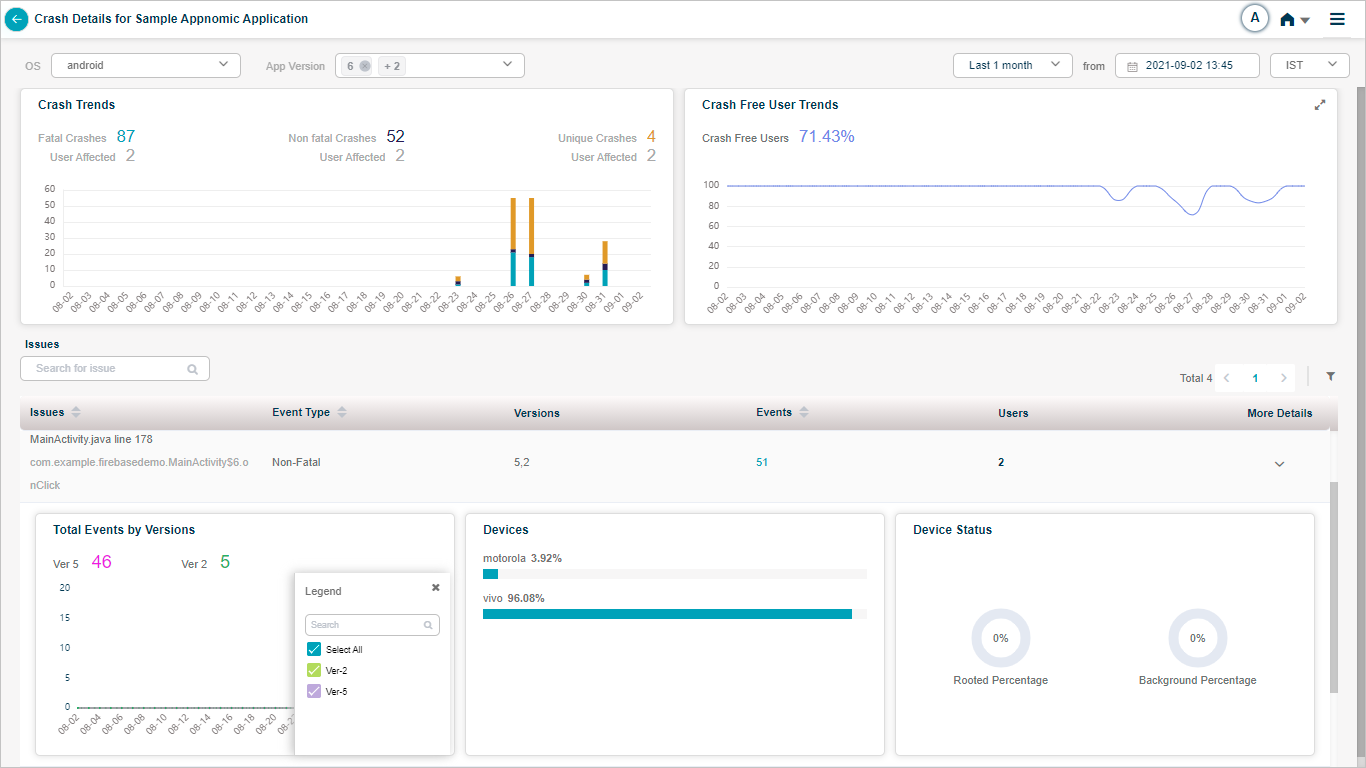
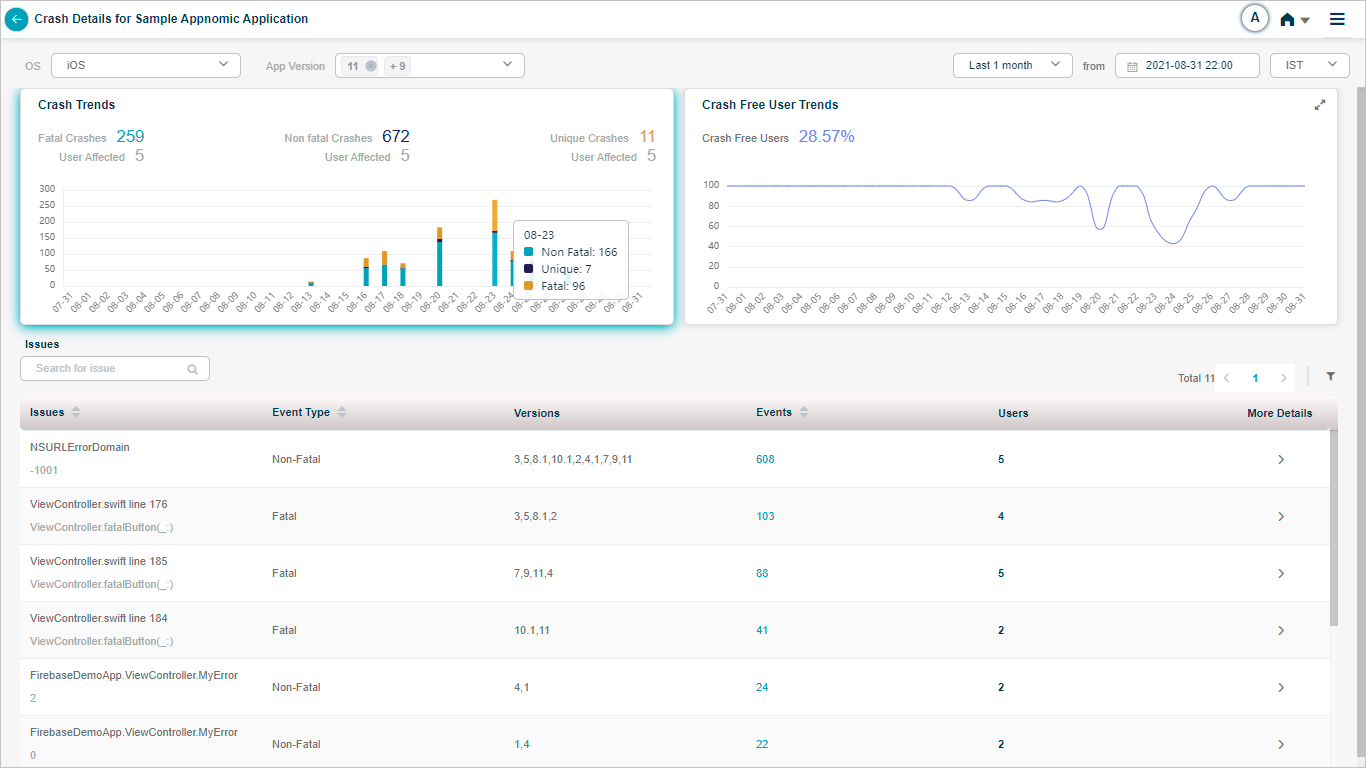
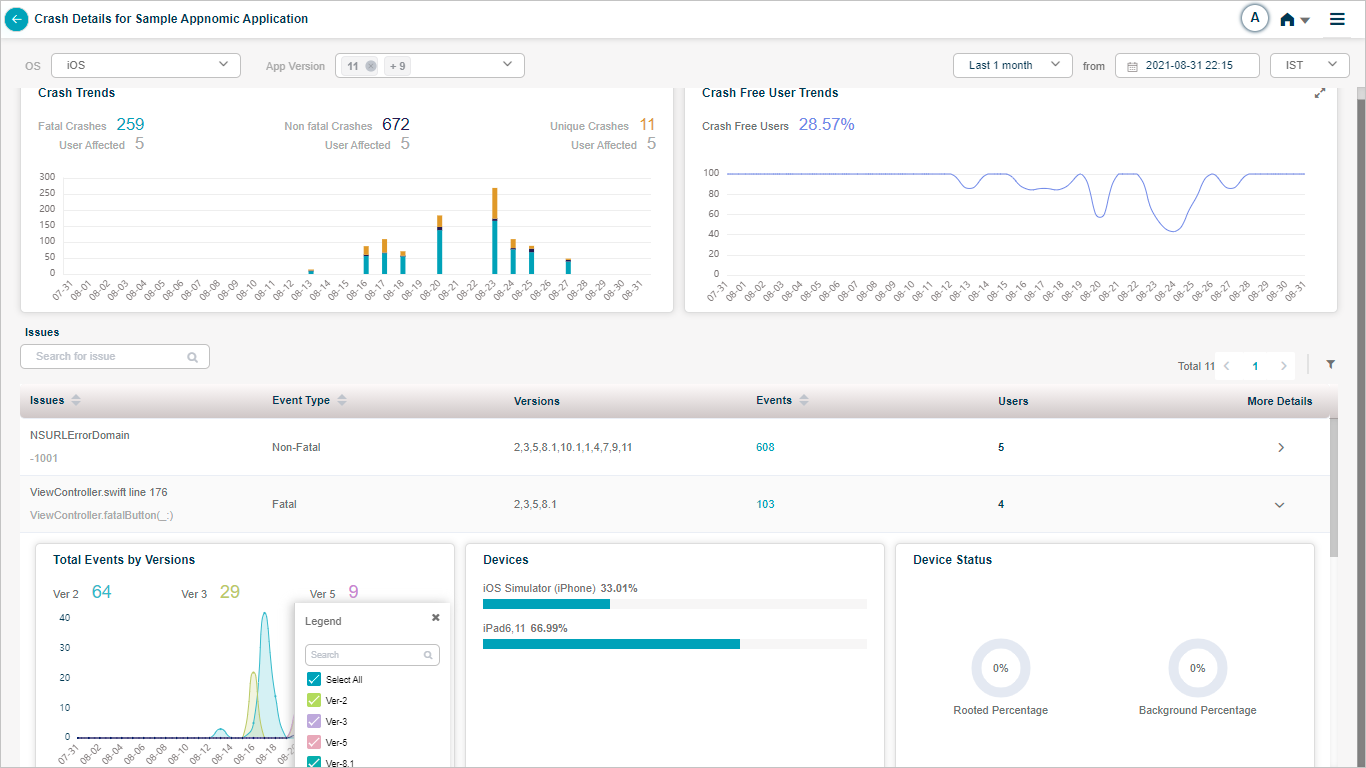
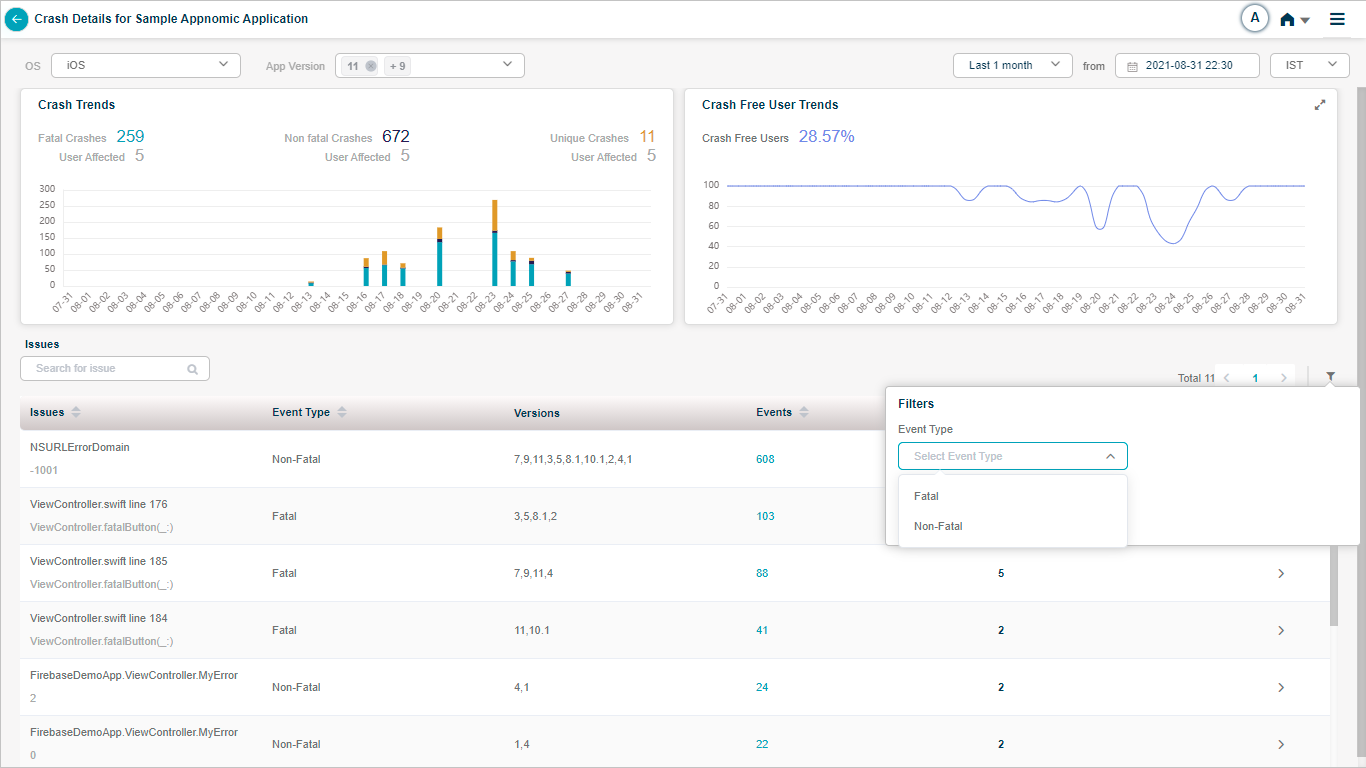
Crash details are as follows.
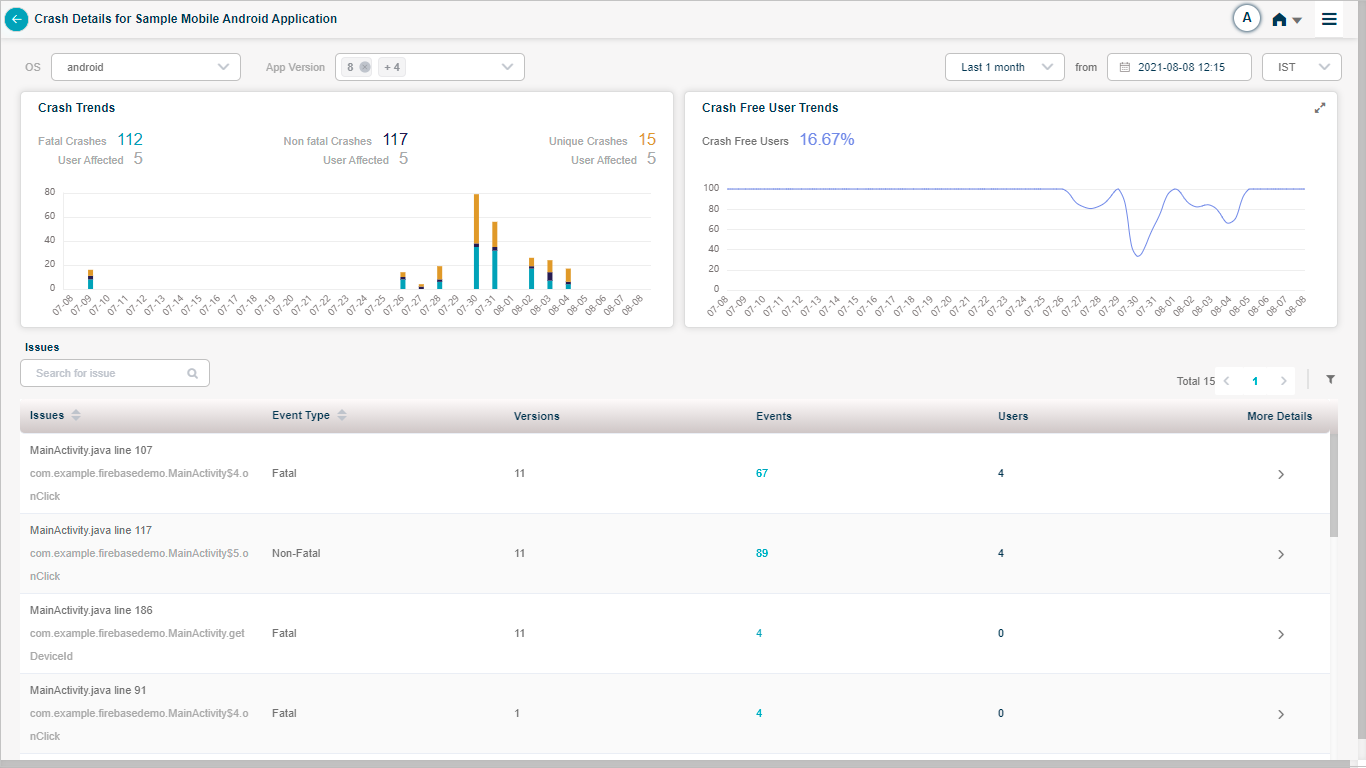
Crash Details
Hover on a data point in Crash Trends pod to view the number of non-fatal, fatal, and unique crashes at a point in time. You can view the count of crashes and corresponding counts of users which are affected due to these crashes.
Crash Details
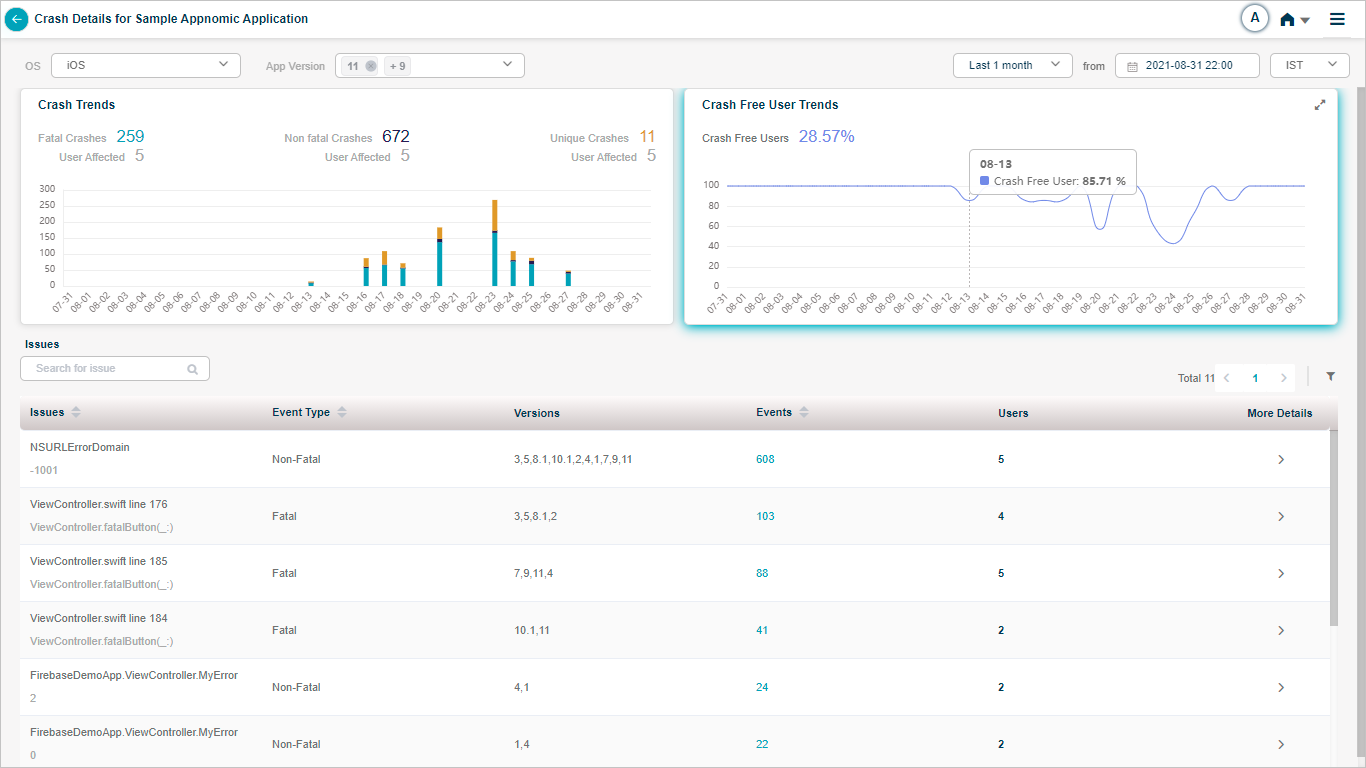
Hover on a data point in Crash Free User Trends pod to view the number of users which did not observe any crash at a point in time.
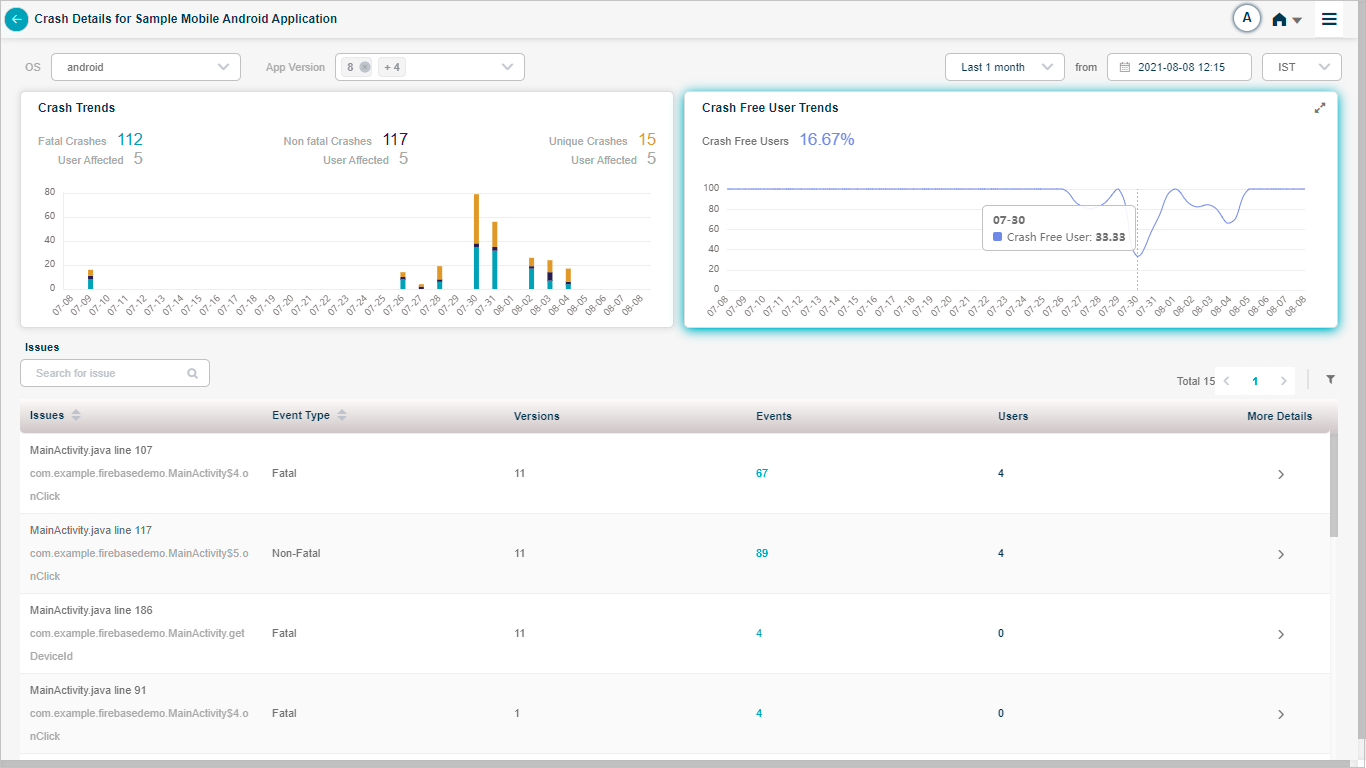
Crash Details
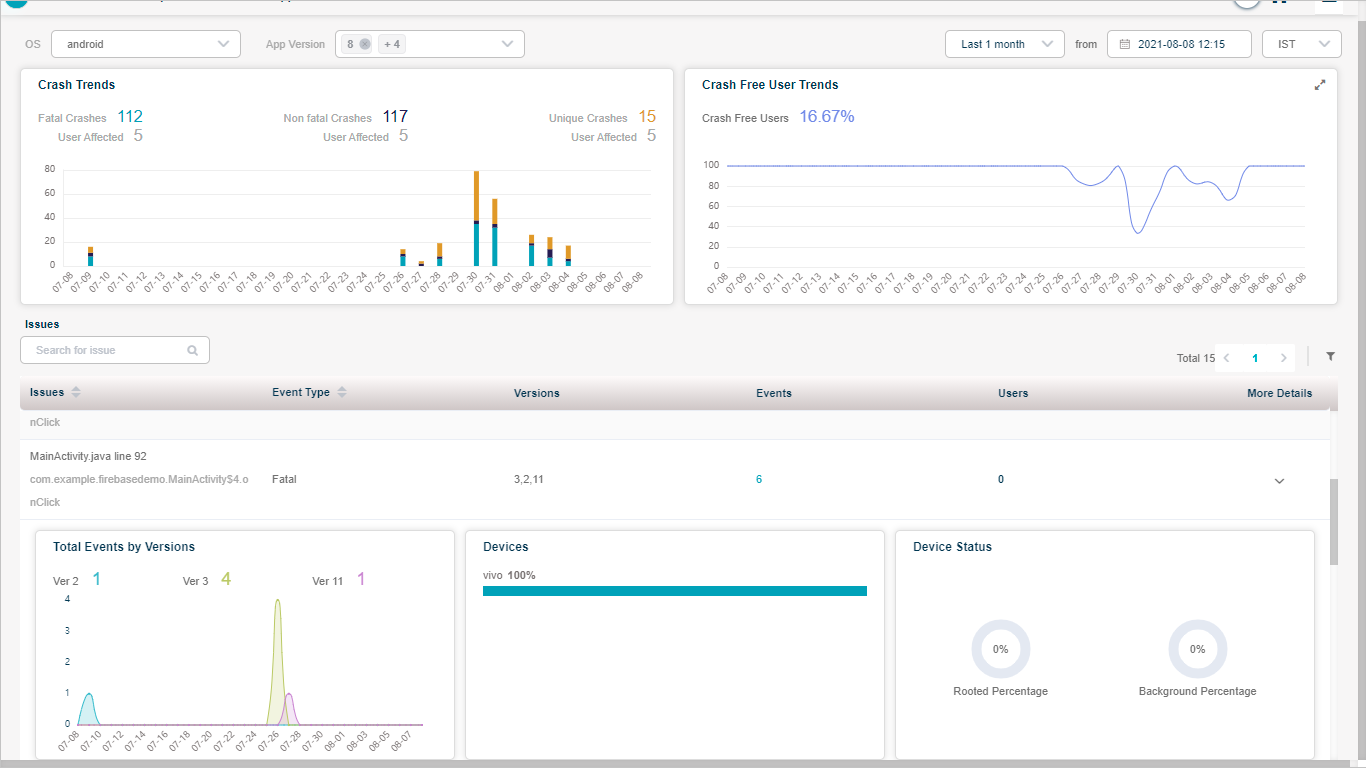
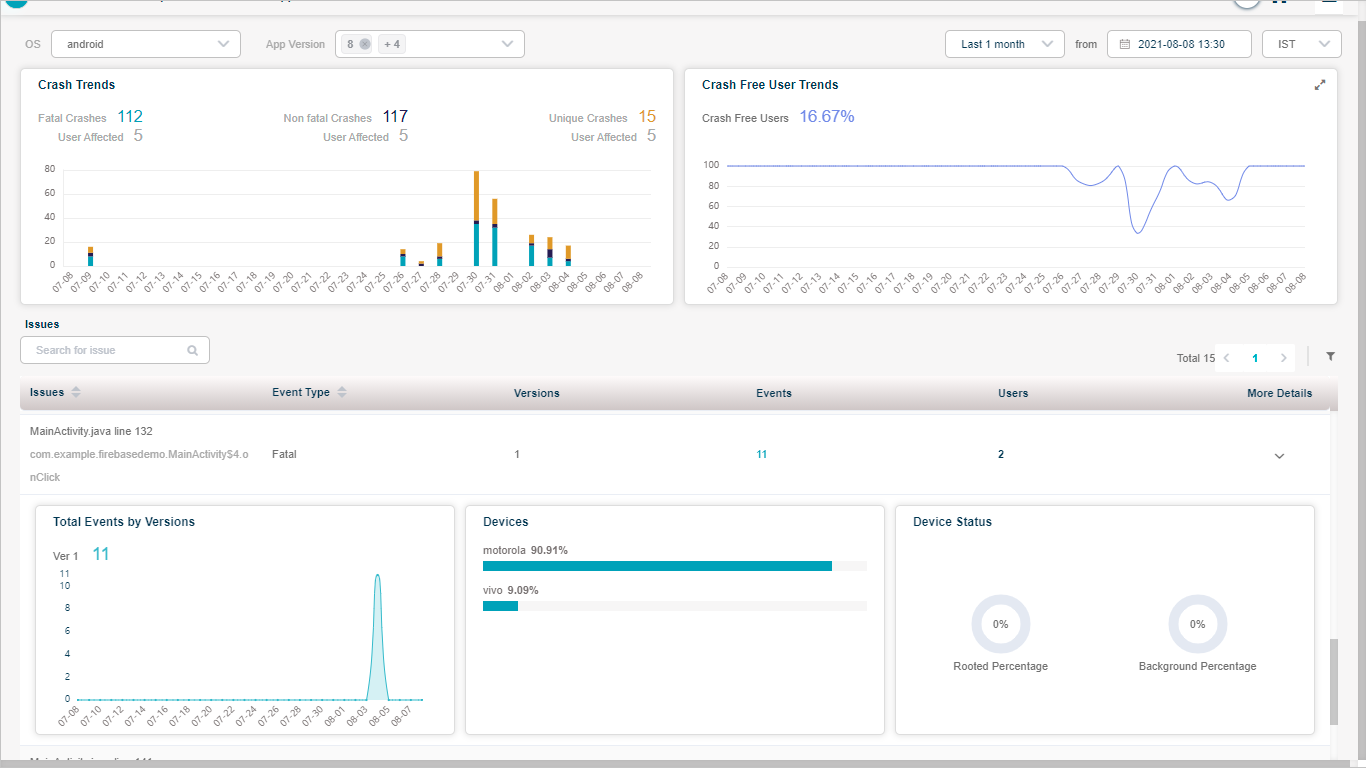
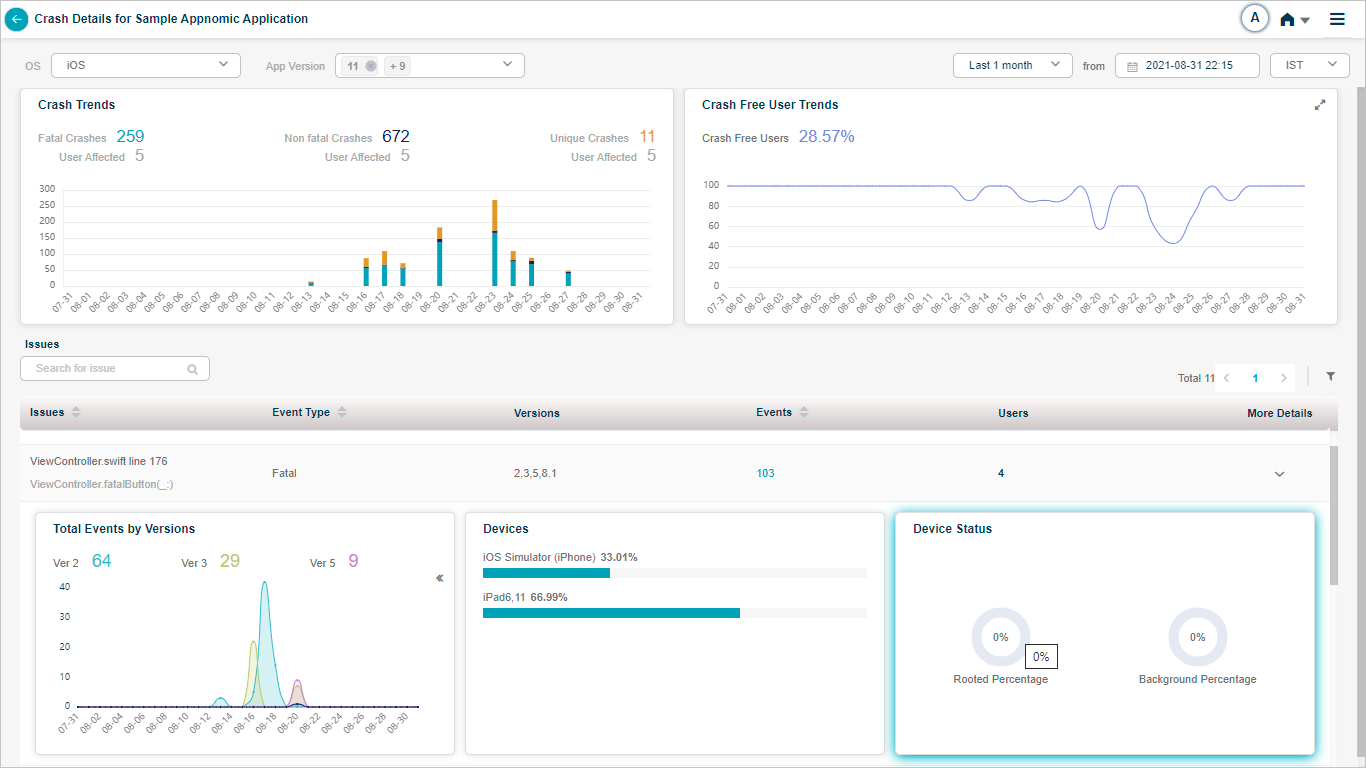
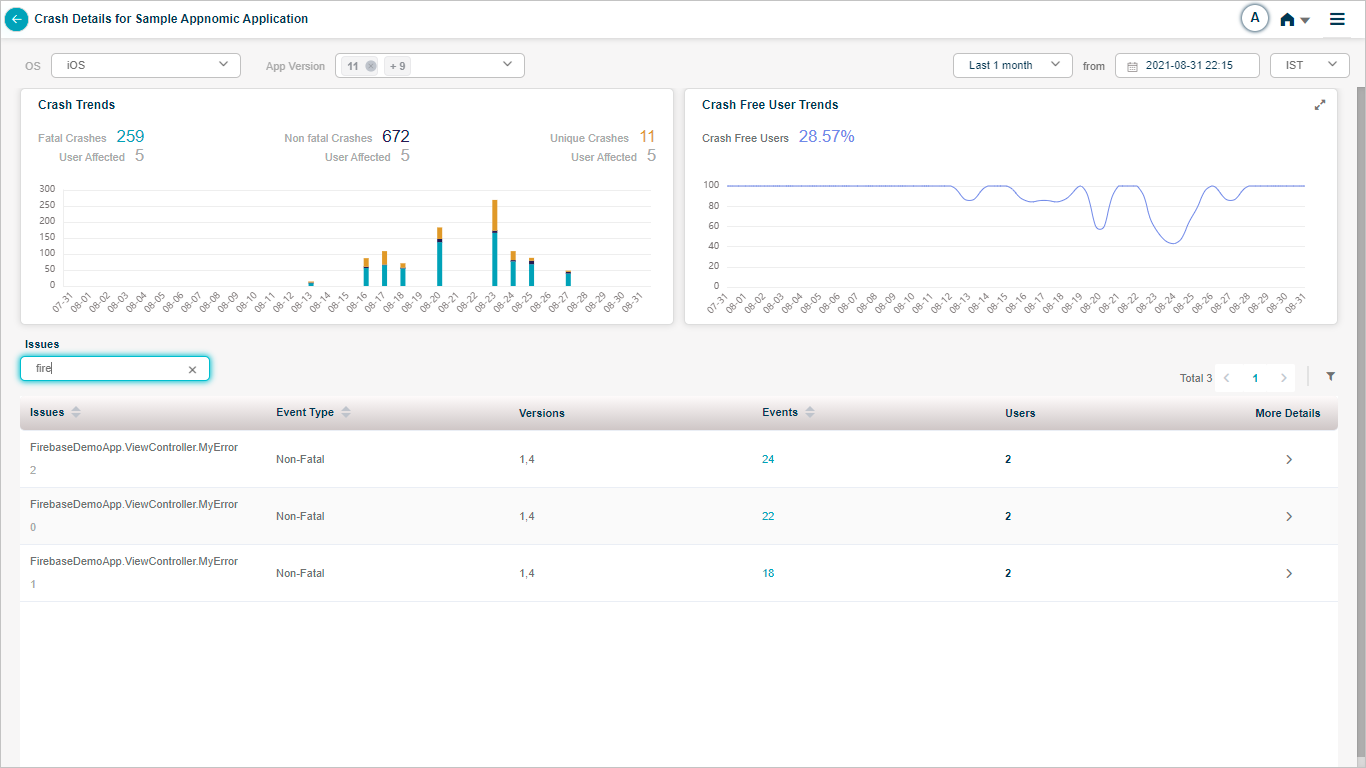
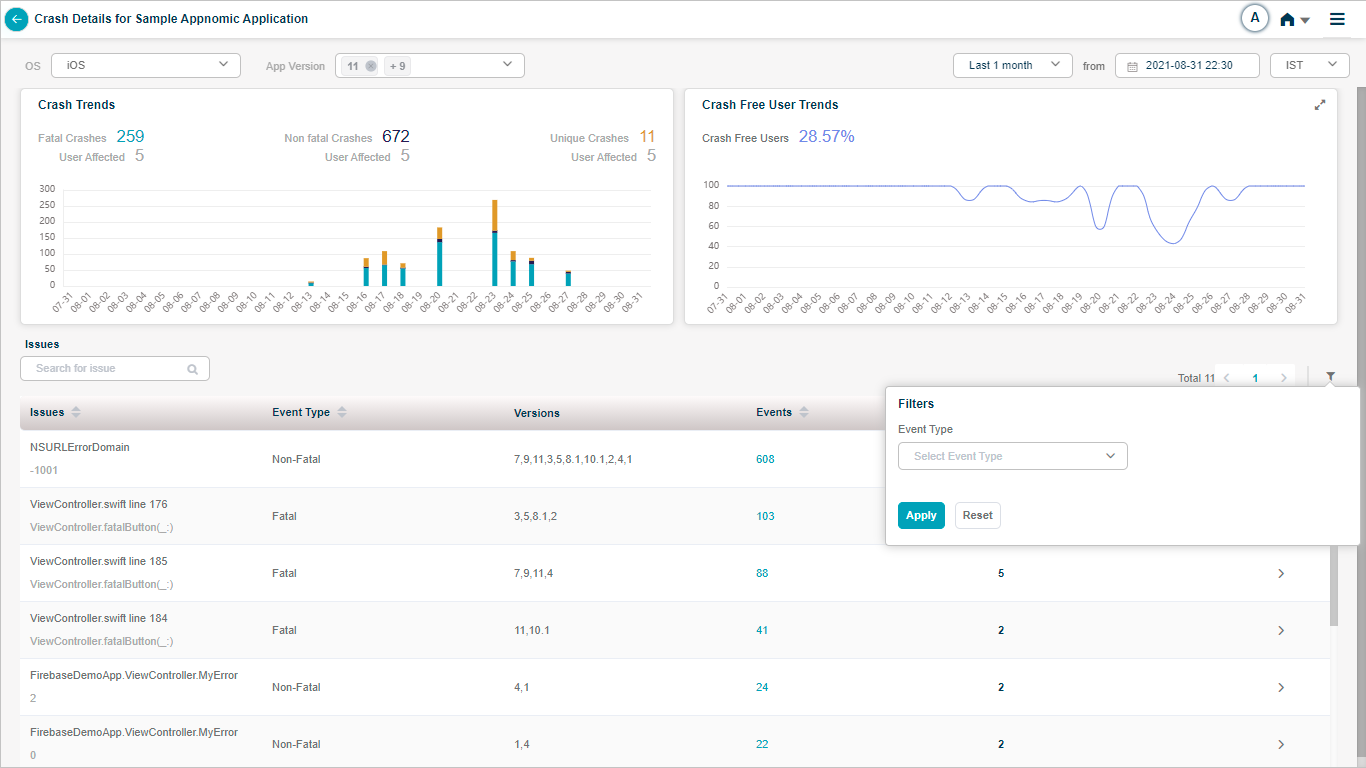
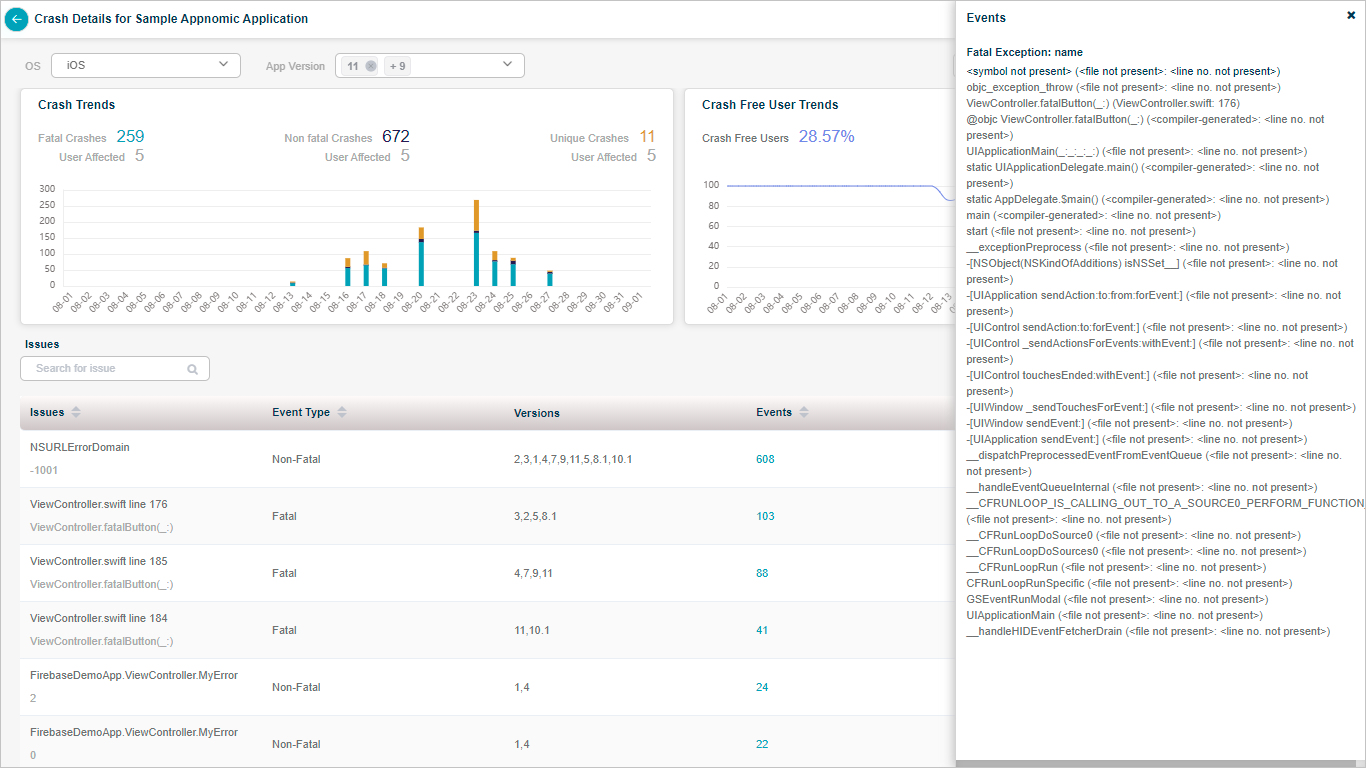
Issues are a group of similar events (crashes). HEAL displays details about all the issues in Issues section. Issues column gives the name of the blame frame which caused the crash along with the line number. You can view the type of the crash, comma separated version numbers of the mobile application which got affected due to the crash. Event is an occurrence of the crash. Event indicates the number of occurrences of the crashes. Value in the Users column indicates the number of affected users due to the crashes.
Crash Details
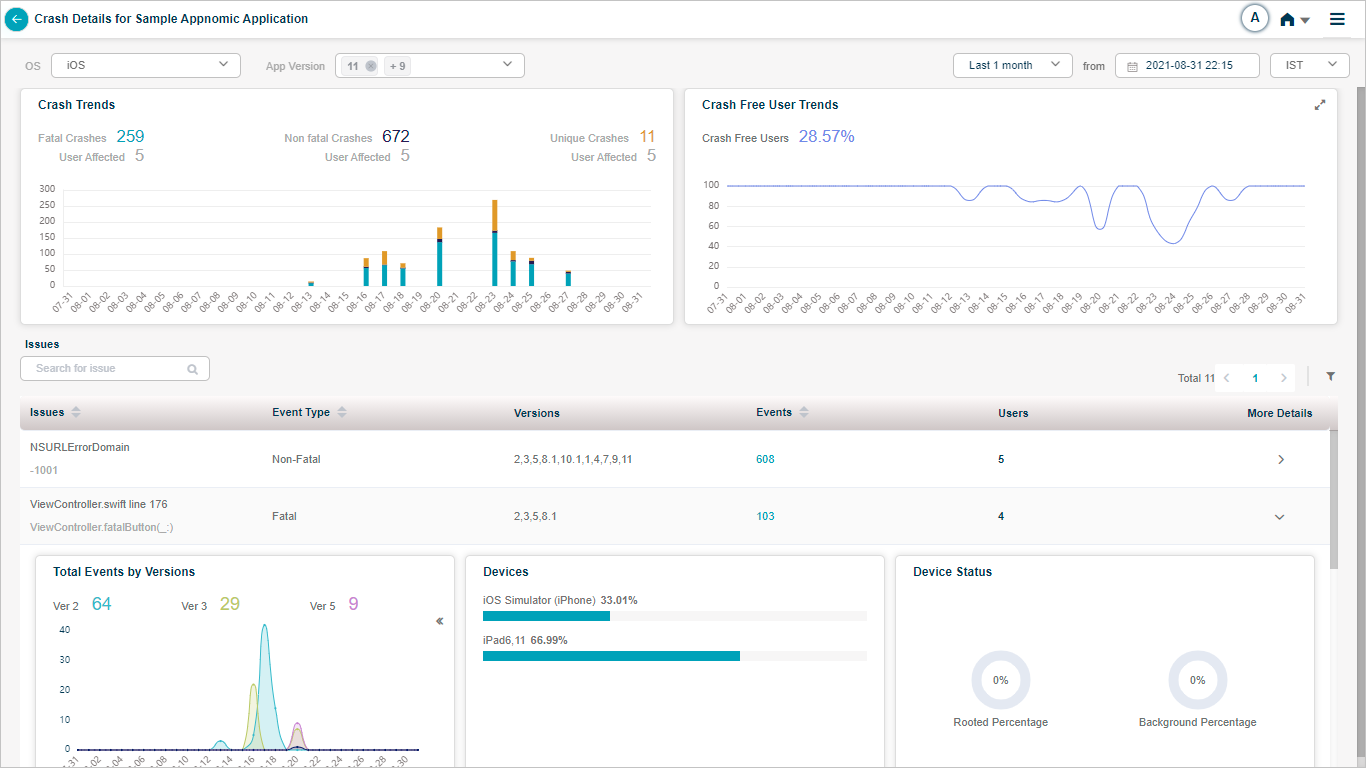
HEAL displays the names of devices which are affected due to the crashes. HEAL also displays the percentage of crashes happened in the device.
Crash Details
Select on the count in Events column to view the stack trace. It displays the thread of exceptions.
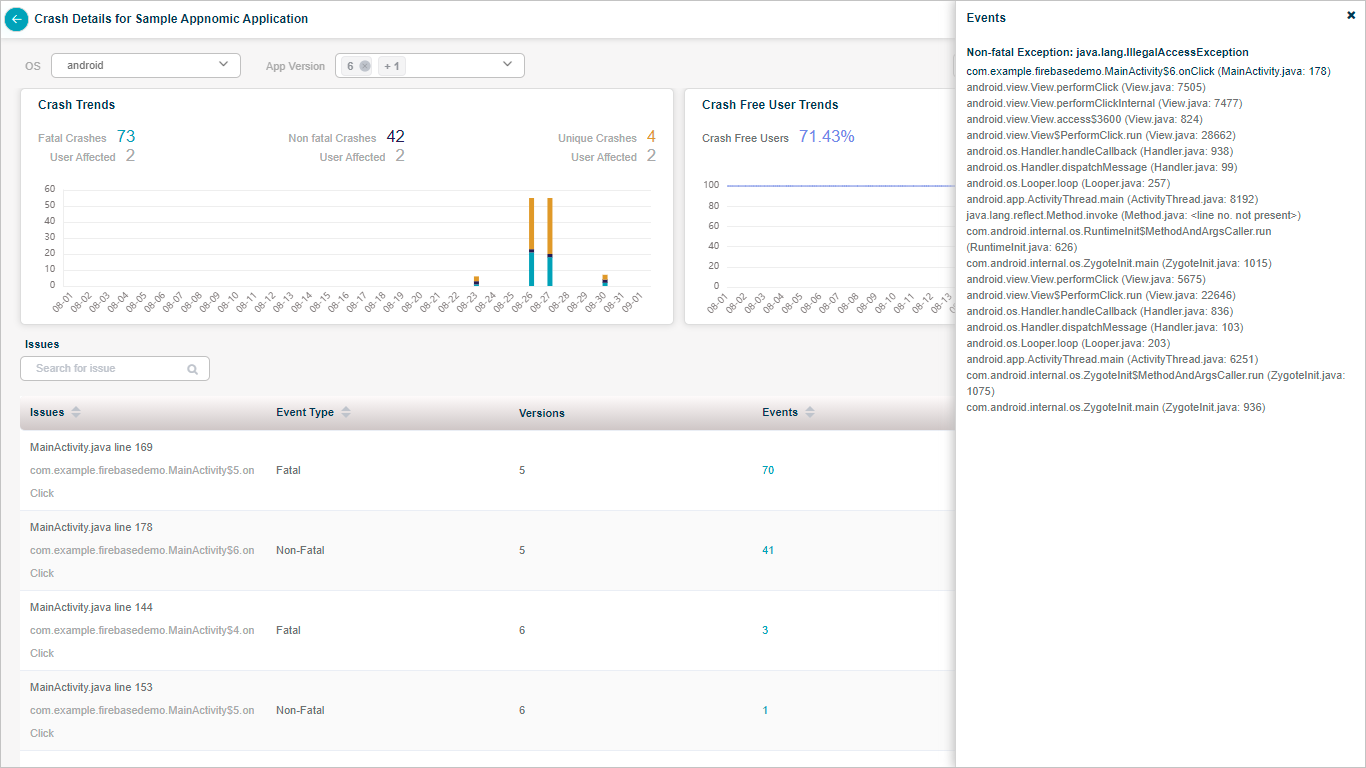
Crash Details
Crash Details
Crash Details
Crash Details
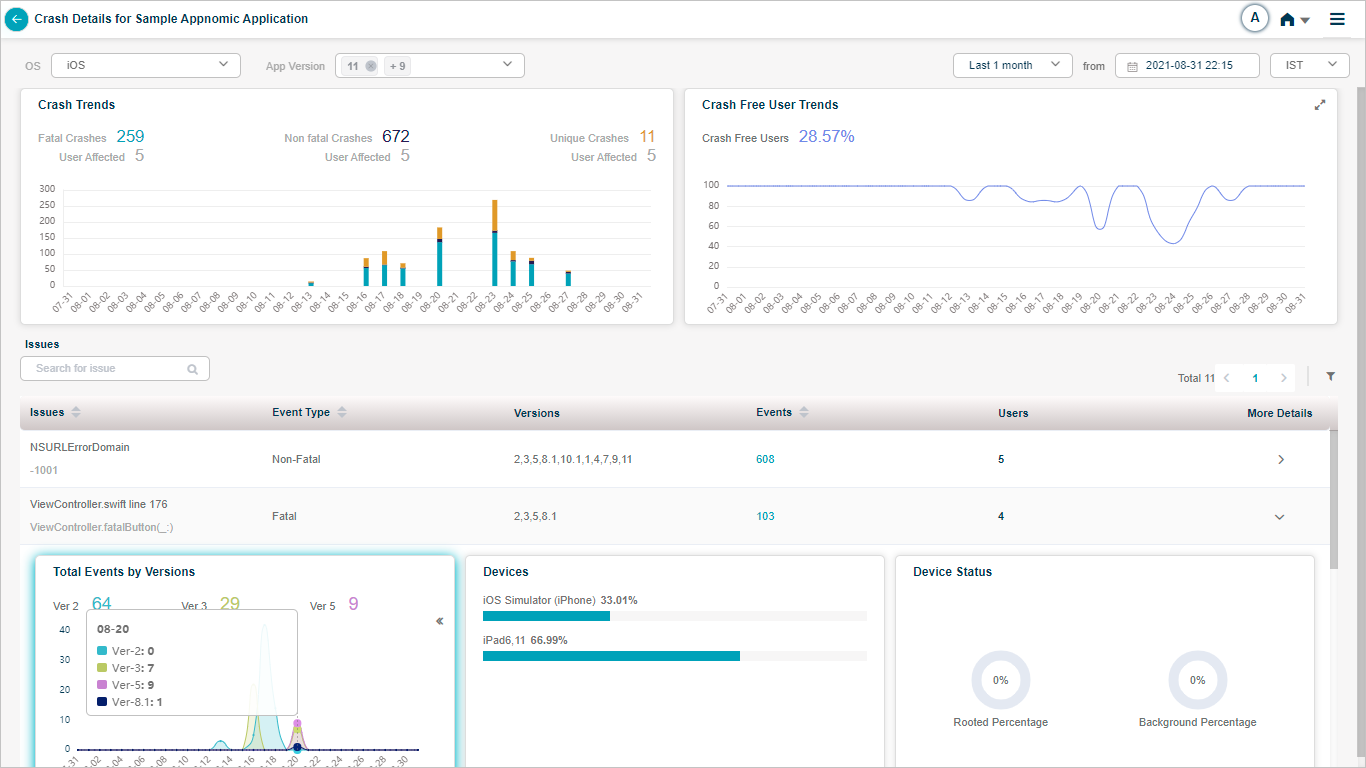
You can view top three versions in Total Events by Versions pod by maximum crashes incurred. Using legends, you can view data for other versions too which you select in App Version box.

Crash Details
Crash Details
Application Not Responding
Application Not Responding (ANR) pod indicates the total number of times an application went in not responding state. You may access multiple screens of an application. It gives the summation of the number of times each of those screens were unresponsive. Average Activity Duration indicates average time in seconds you spent in the screens during the time interval you chose in top right corner.
App Summary
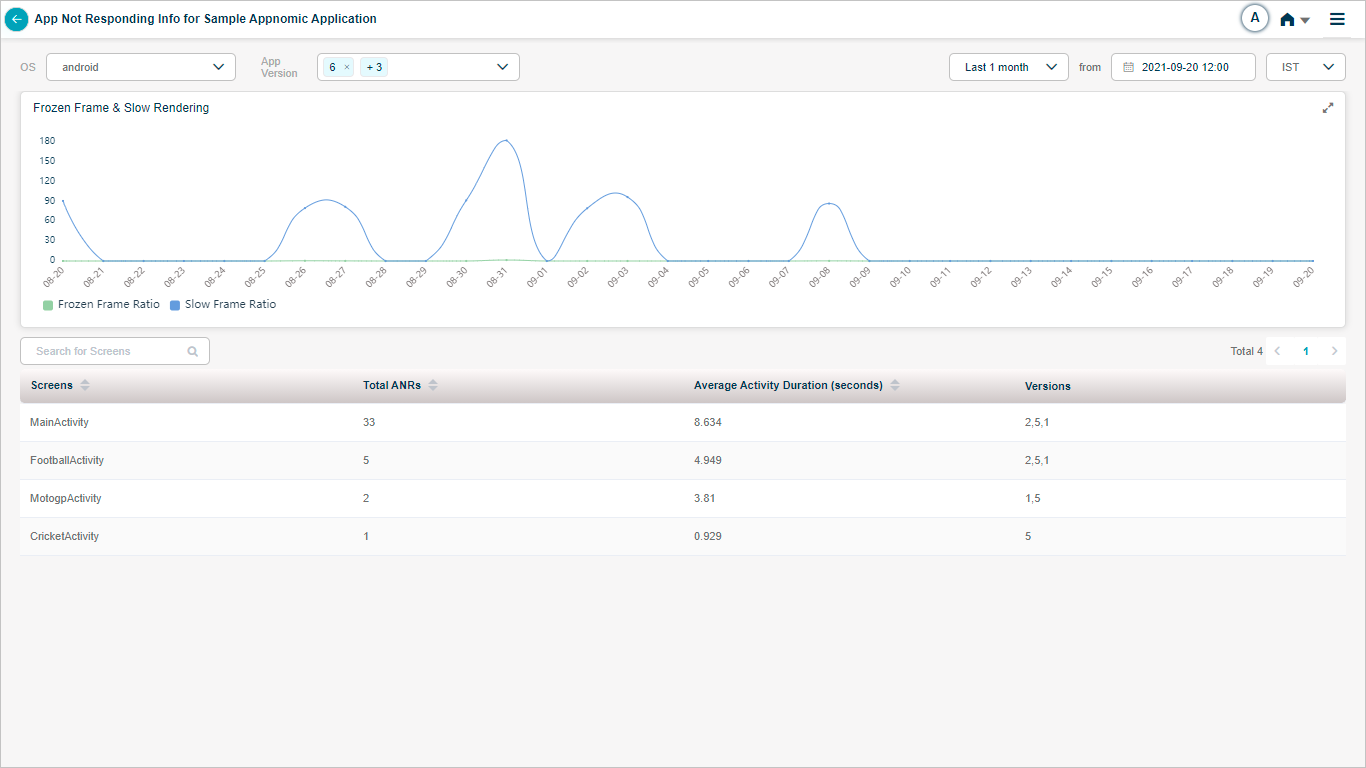
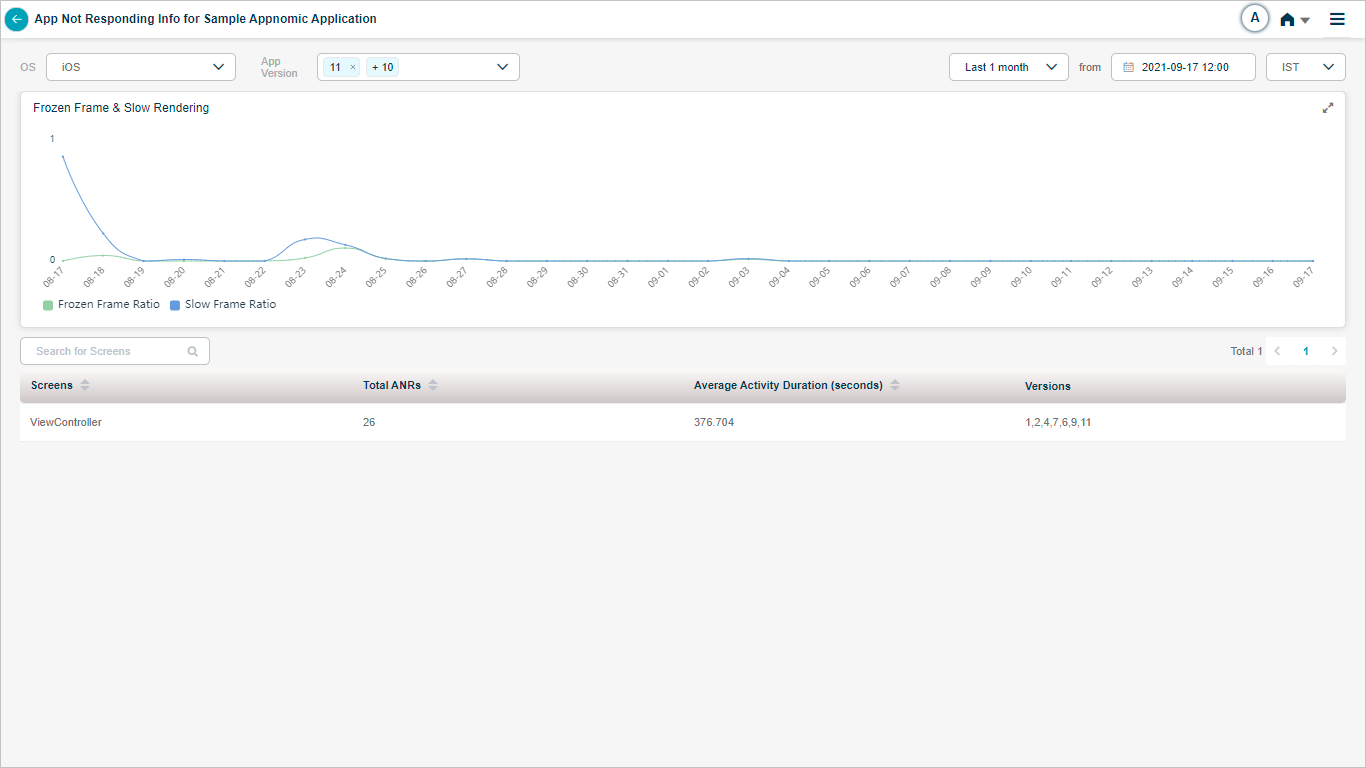
HEAL displays following screen when you select on ANR pod. It displays the screen names you accessed in selected time duration, total number of times each of those screens were unresponsive, average time in seconds you spent in each of those screens, versions of the application which got affected.
If an application gets hung when you navigate between the screens in that application and if takes more than 700 milliseconds (ms) to render the screen, then HEAL considers that as frozen frame. When a particular screen takes more than 16 ms to render 60 frames per second then HEAL considers that as slow rendering page.
App Summary
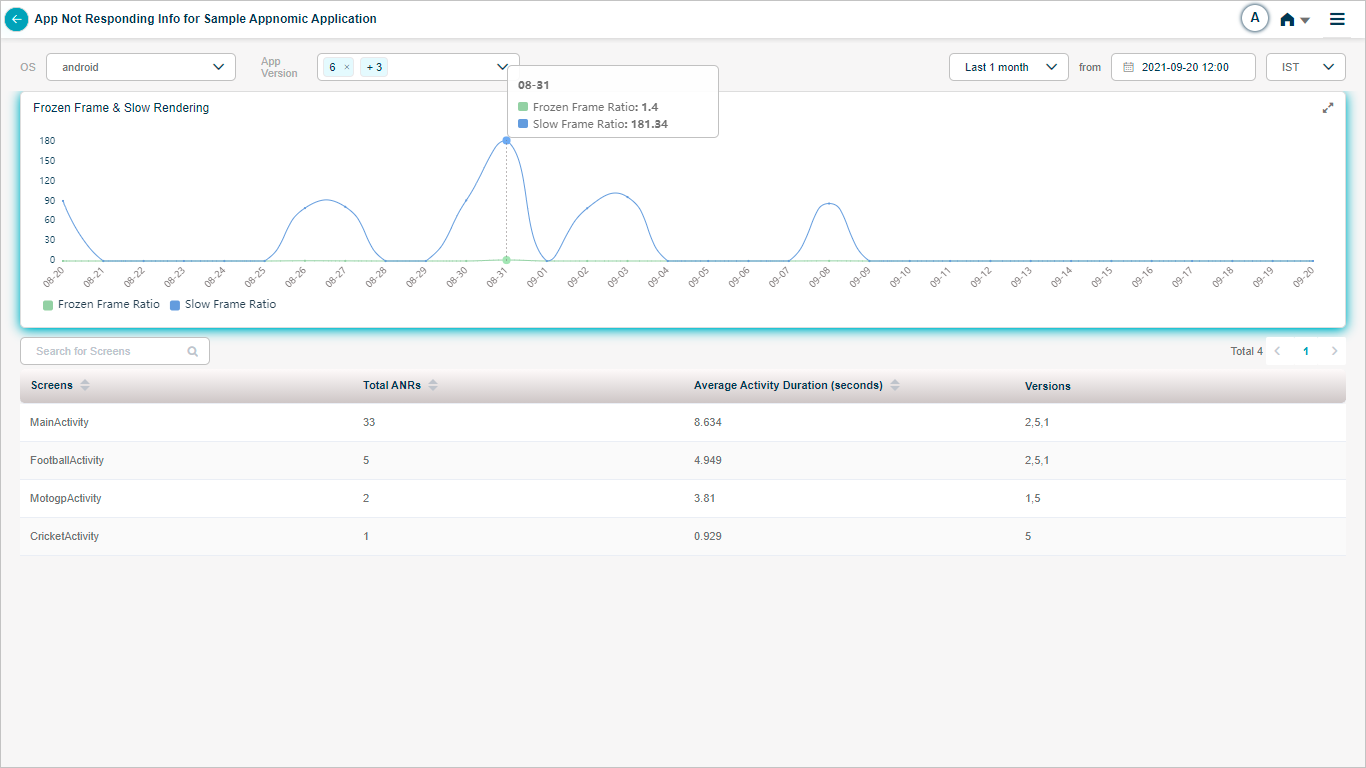
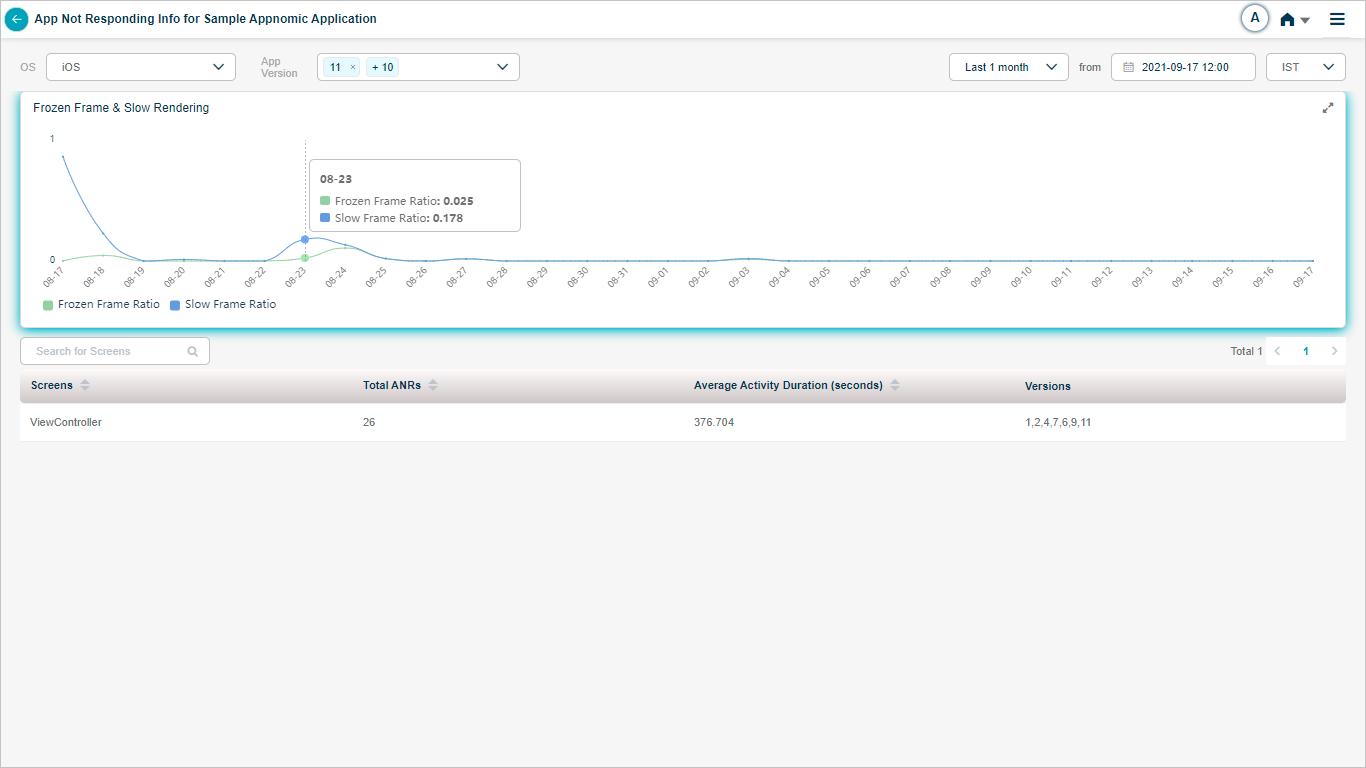
Application displays following screen when you hover on a data point in Frozen Frame & Slow Rendering graph. It displays the ratios with respect to the time. Frozen Frame and Slow Frame ratios indicate the average ratios for a specific day.
App Summary
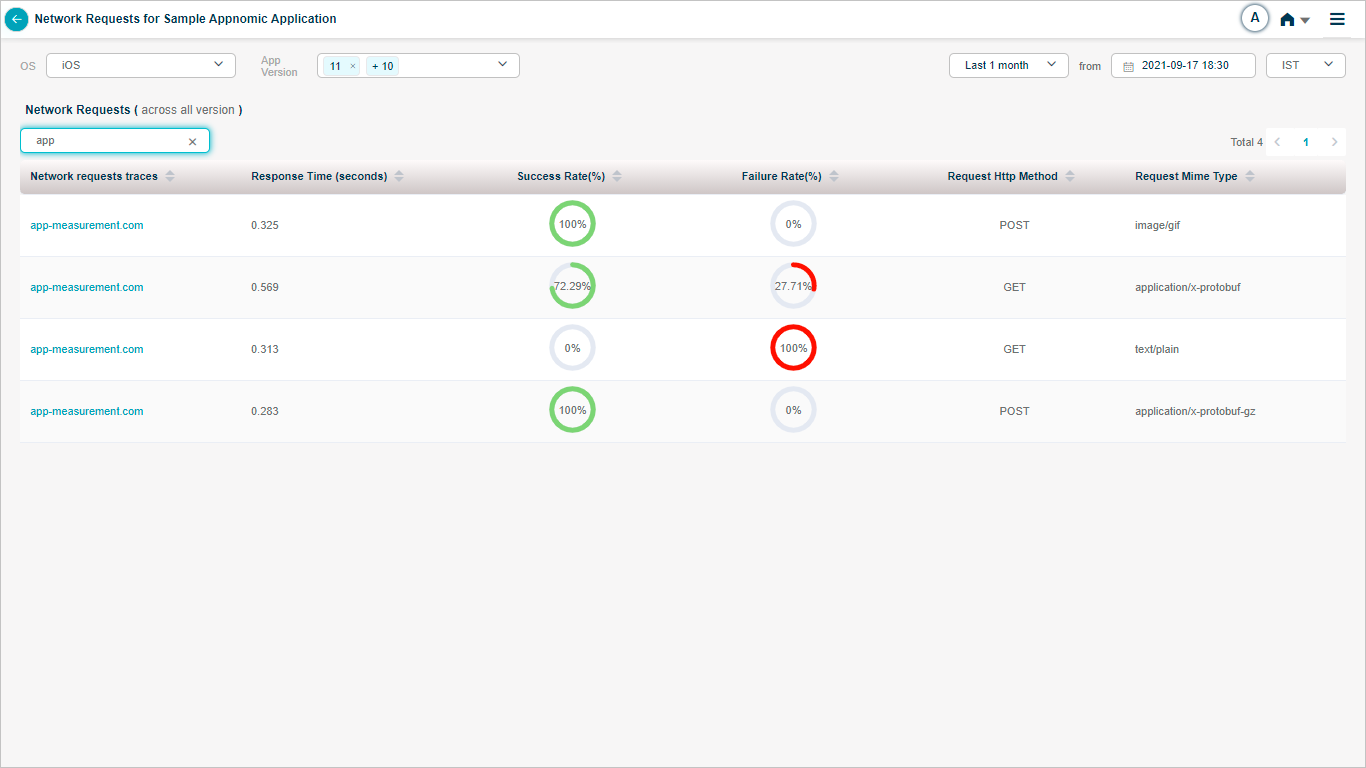
Network Requests
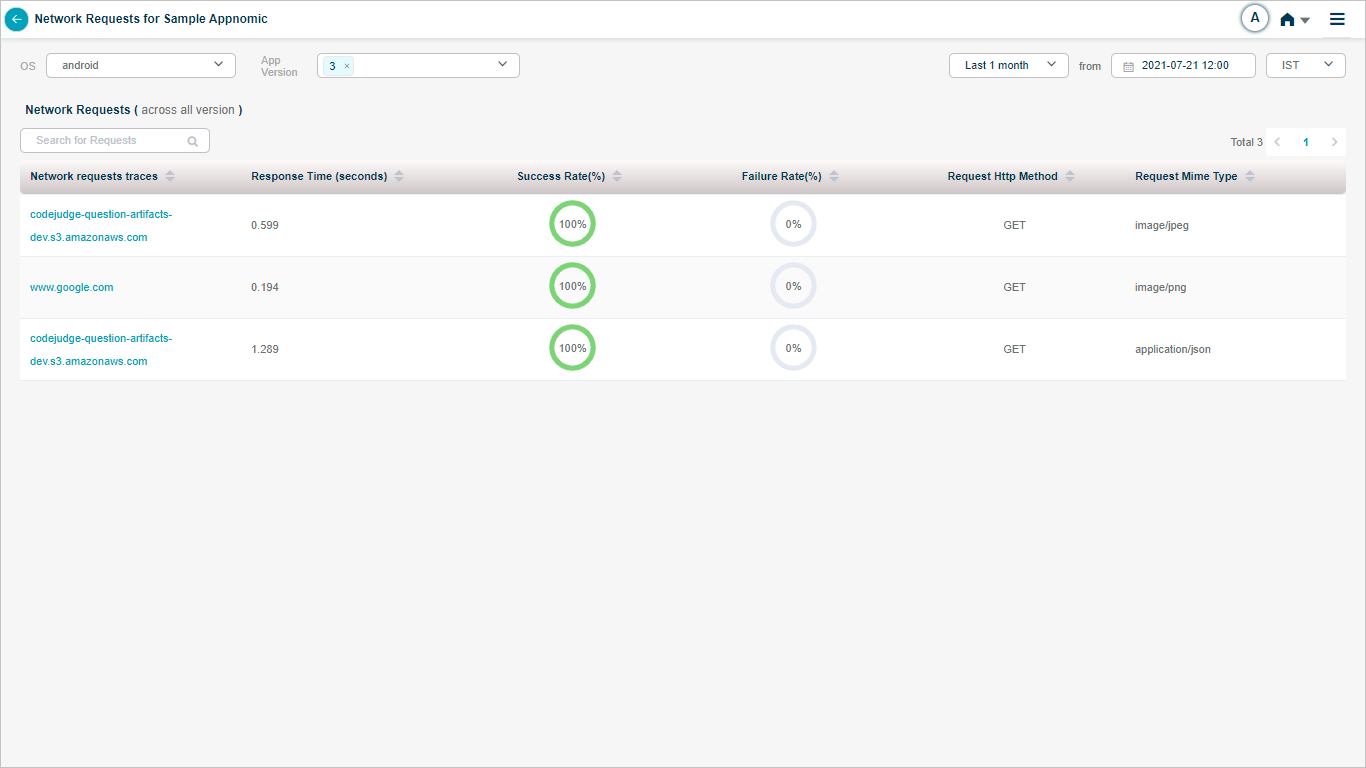
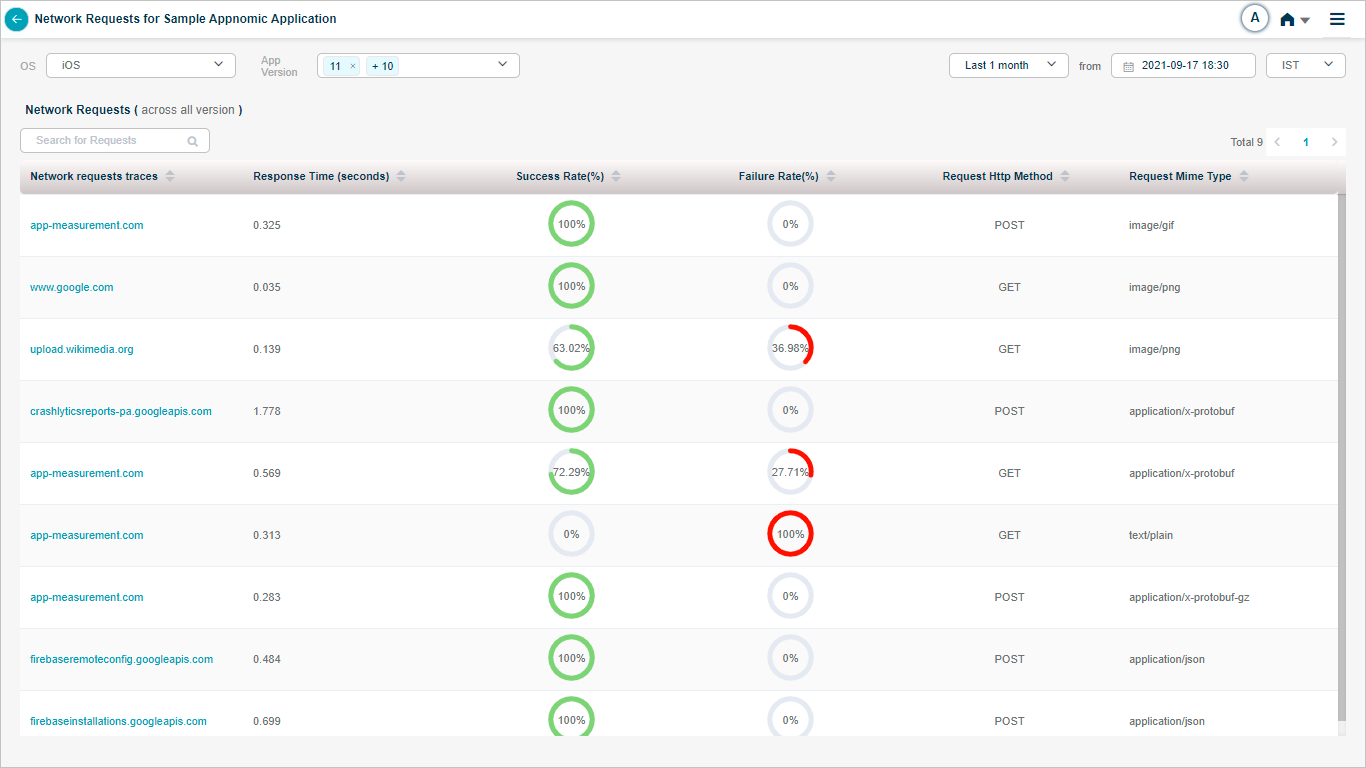
HEAL displays the top five network requests at the bottom pane with respect to the volume.
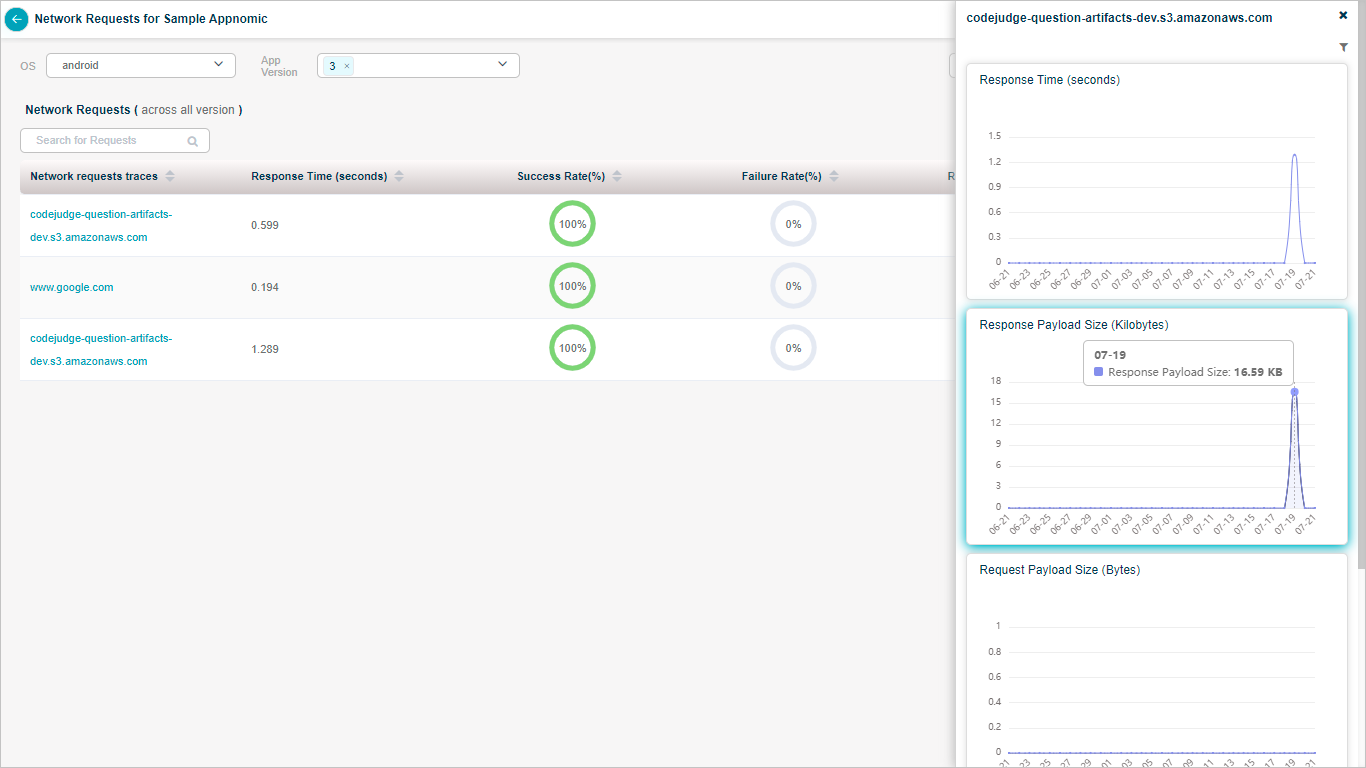
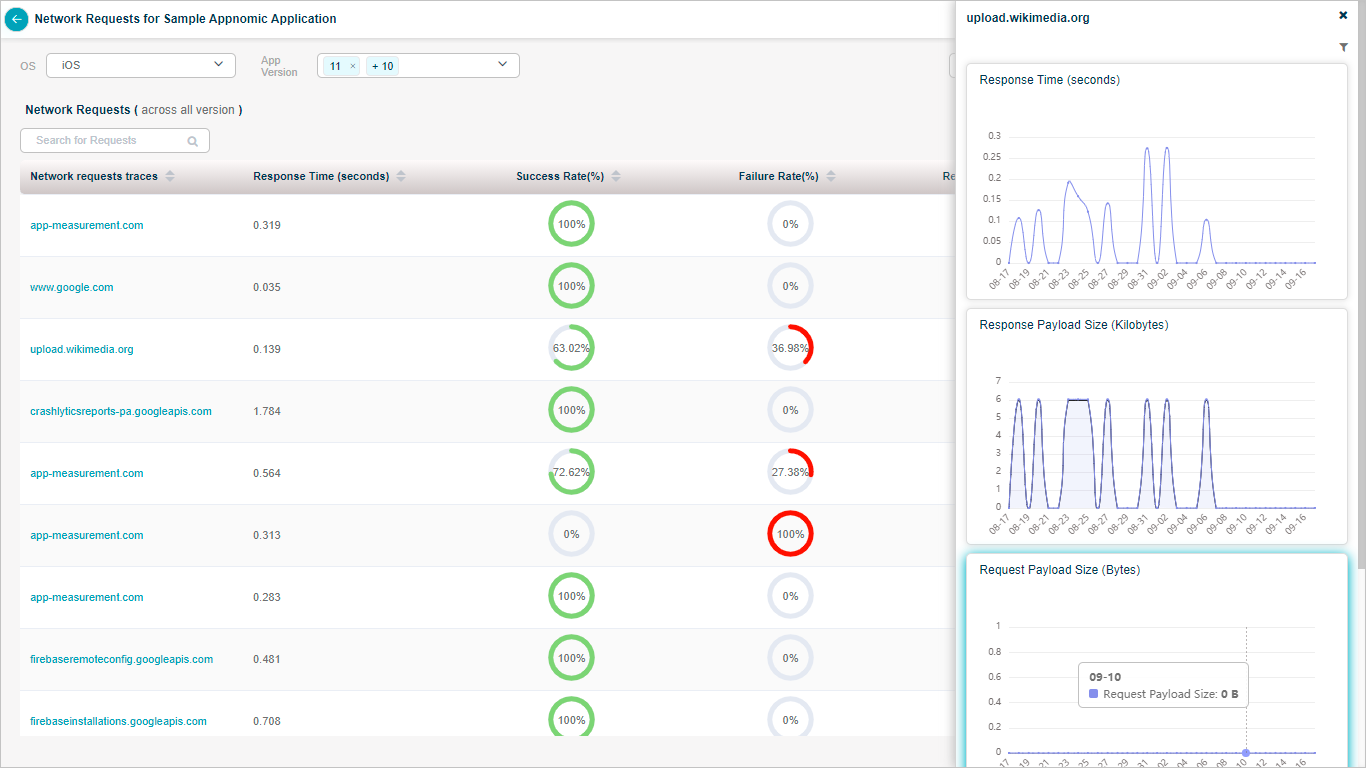
Network requests traces column displays the URLs which the application triggers. When you navigate through the screens in an application, few URLs open up; these are the ones which are shown in this column. Network request trace traces the performance of HTTP/S request from the point you make the request till you receive the response.
Response Time column displays the latency between request and response in seconds for the URL. This is an aggregated value.
Success Rate column indicates percentage of successful completion of a particular request.
Failure Rate column indicates percentage of failure of a particular request. Failure could be because of NW issues, malformed URL etc.
Request Http Method column indicates GET, POST, DELETE, PUT methods for the requests.
Request Mime Type column indicates the format of the document or any file which you get from the response.
For Example: JPG, PNG, DOC, GIF, PDF etc.
App Summary
App Summary
Select View more to view the details of all the network requests.
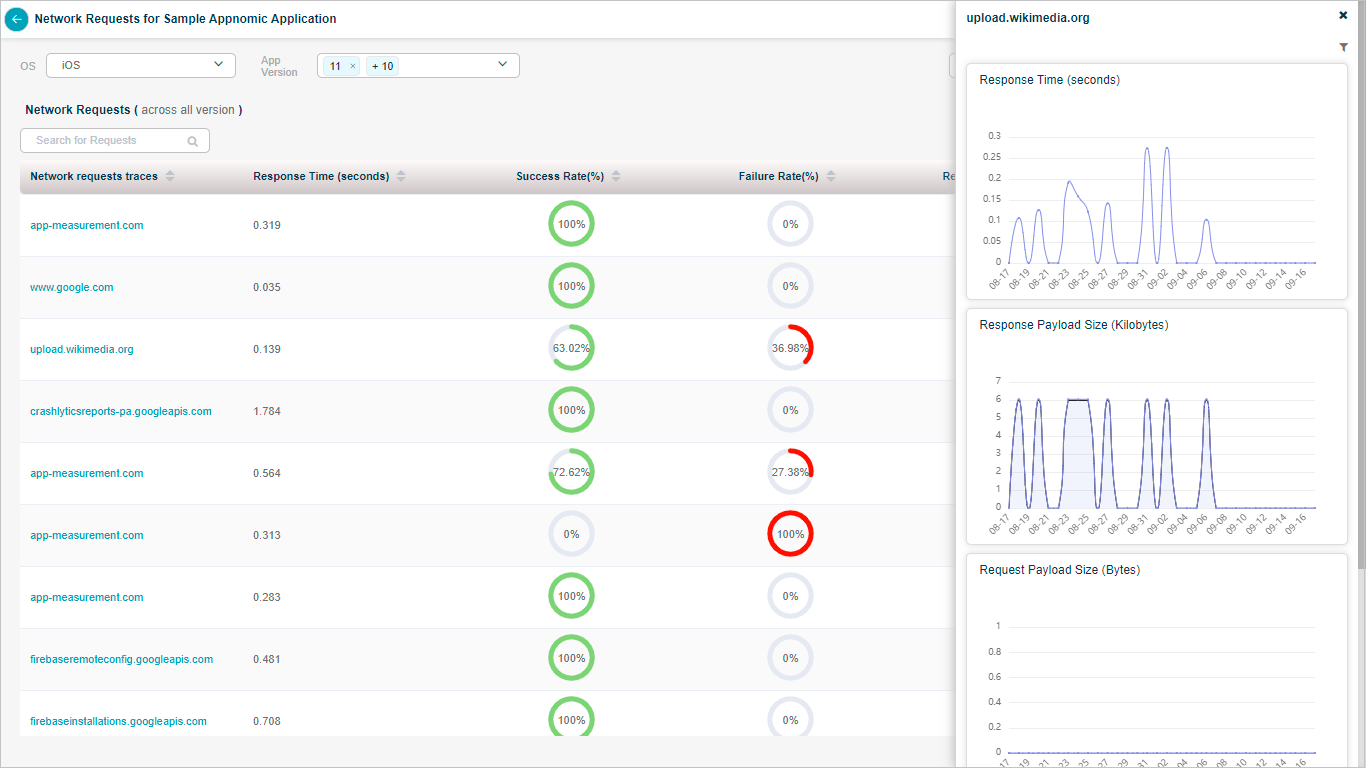
Network Requests
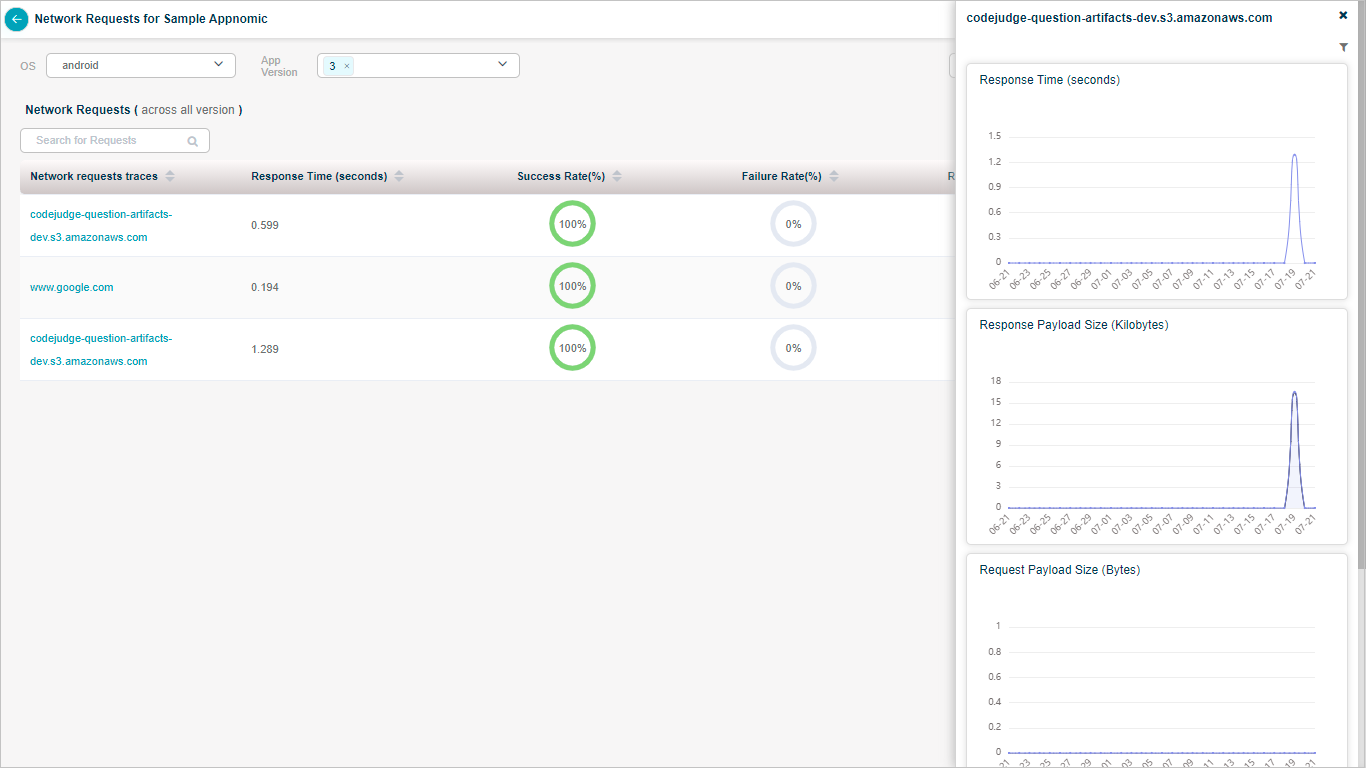
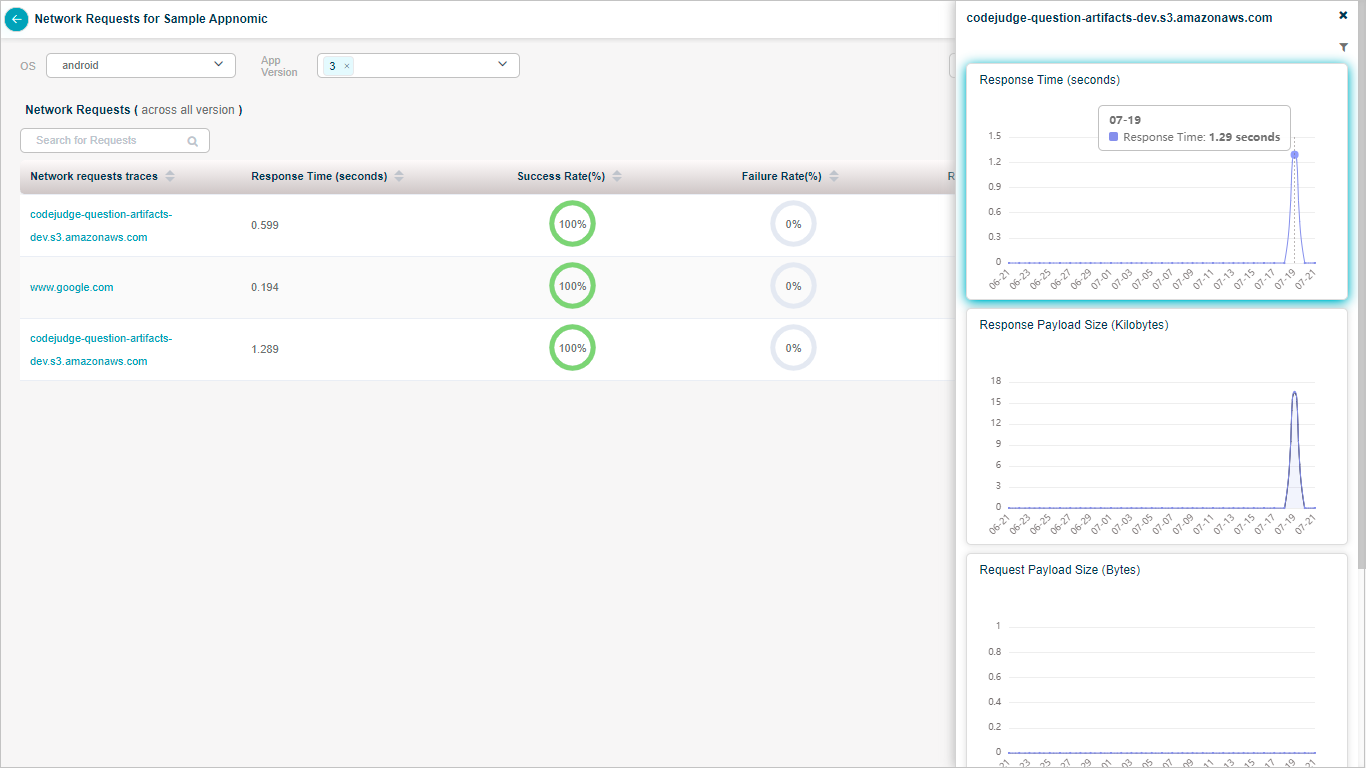
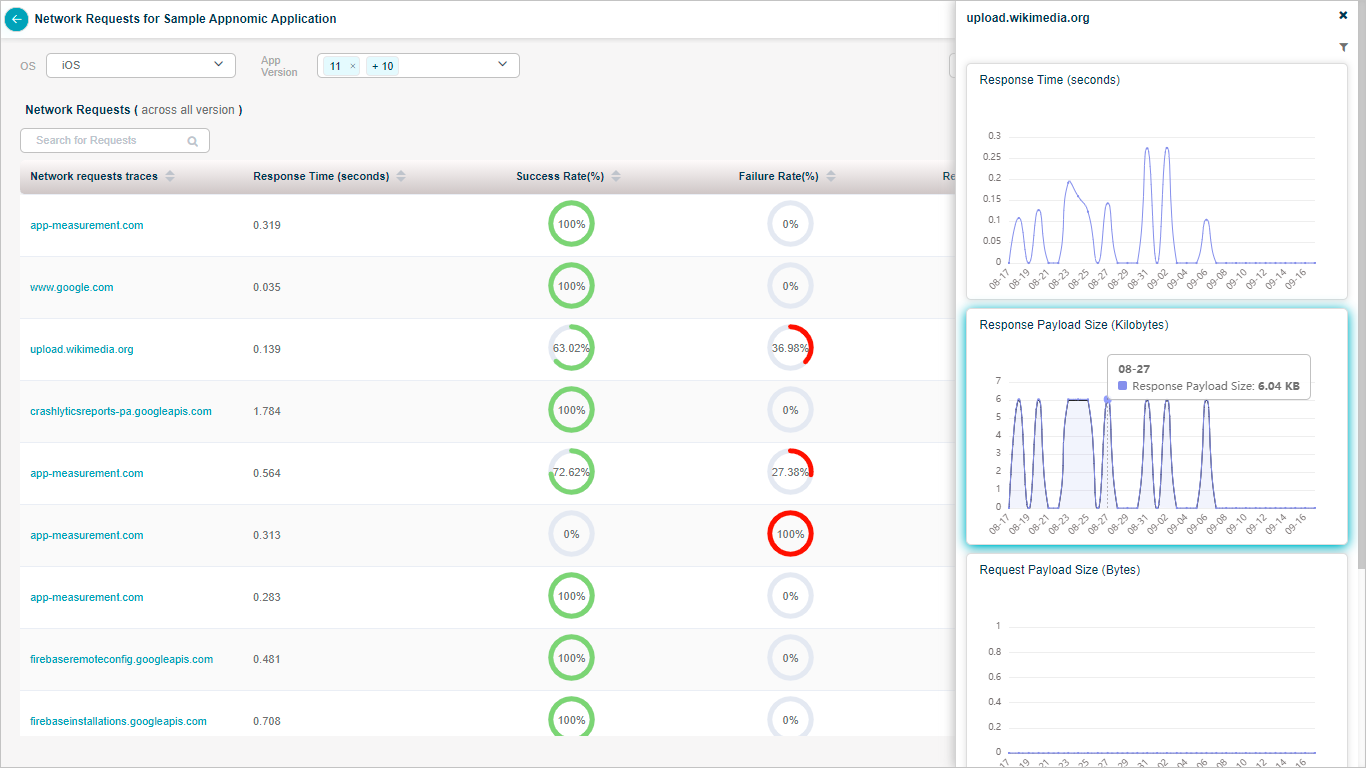
When you select on any request URL, then HEAL displays following screen. Graphs display time-series data.
Response Payload Size indicates the size of packets received in the response in KBs.
Request Payload Size indicates the size of packets received in the request in Bytes.
Network Requests
You can hover on a data point to get the value with respect to time.
Network Requests
Network Requests
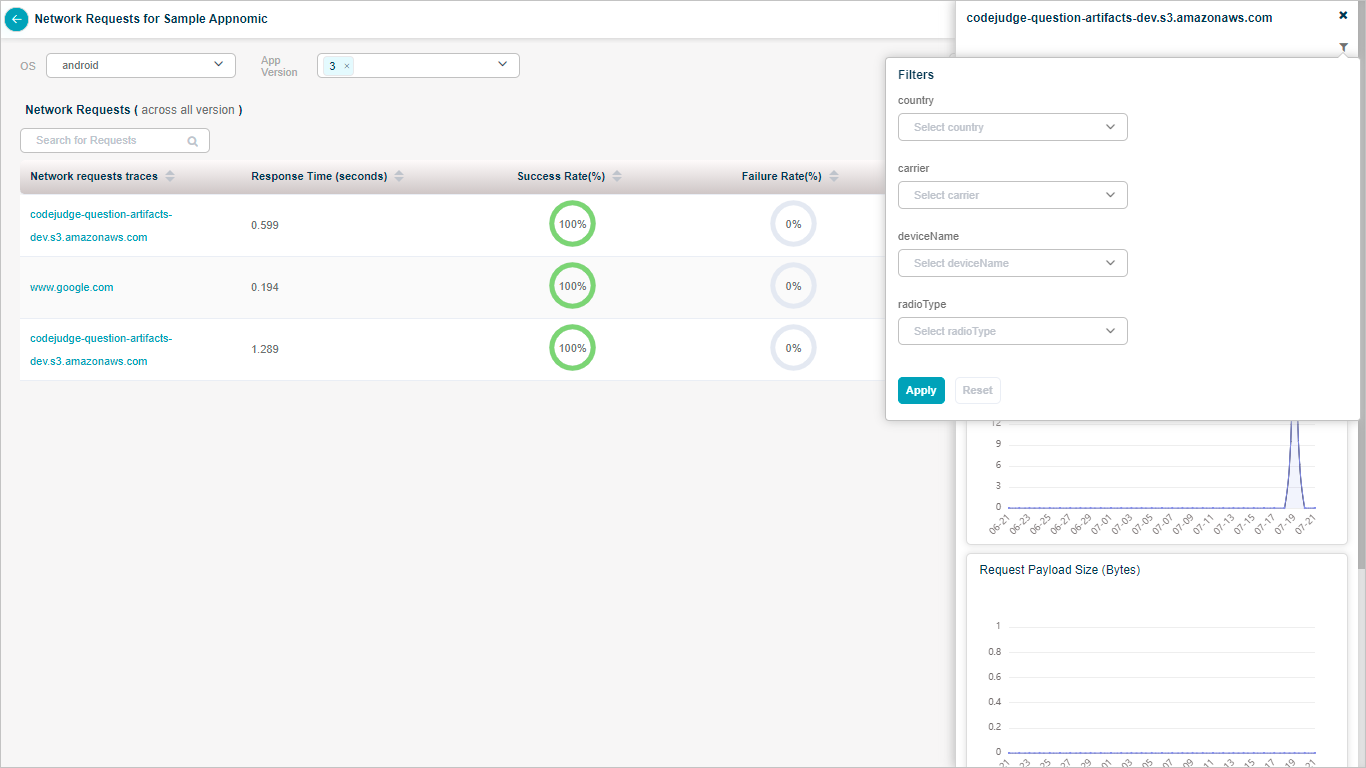
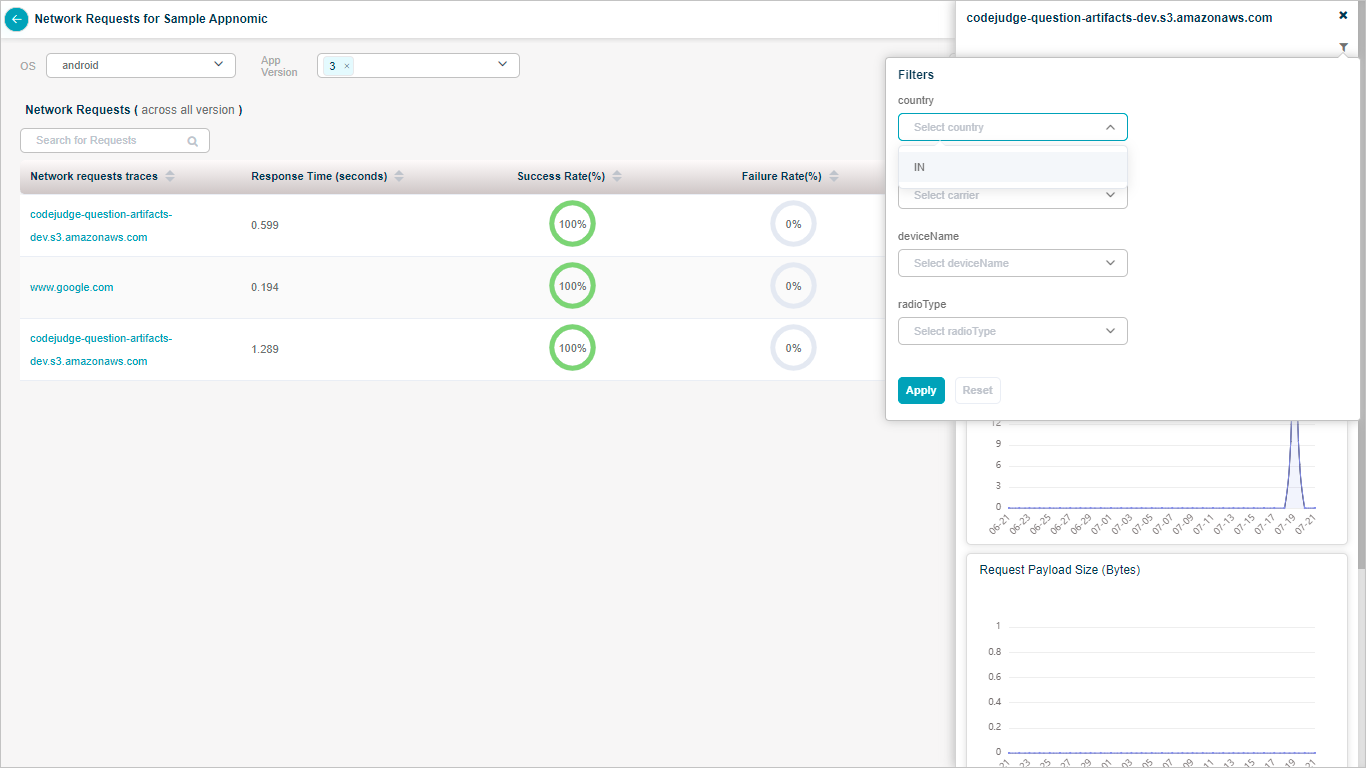
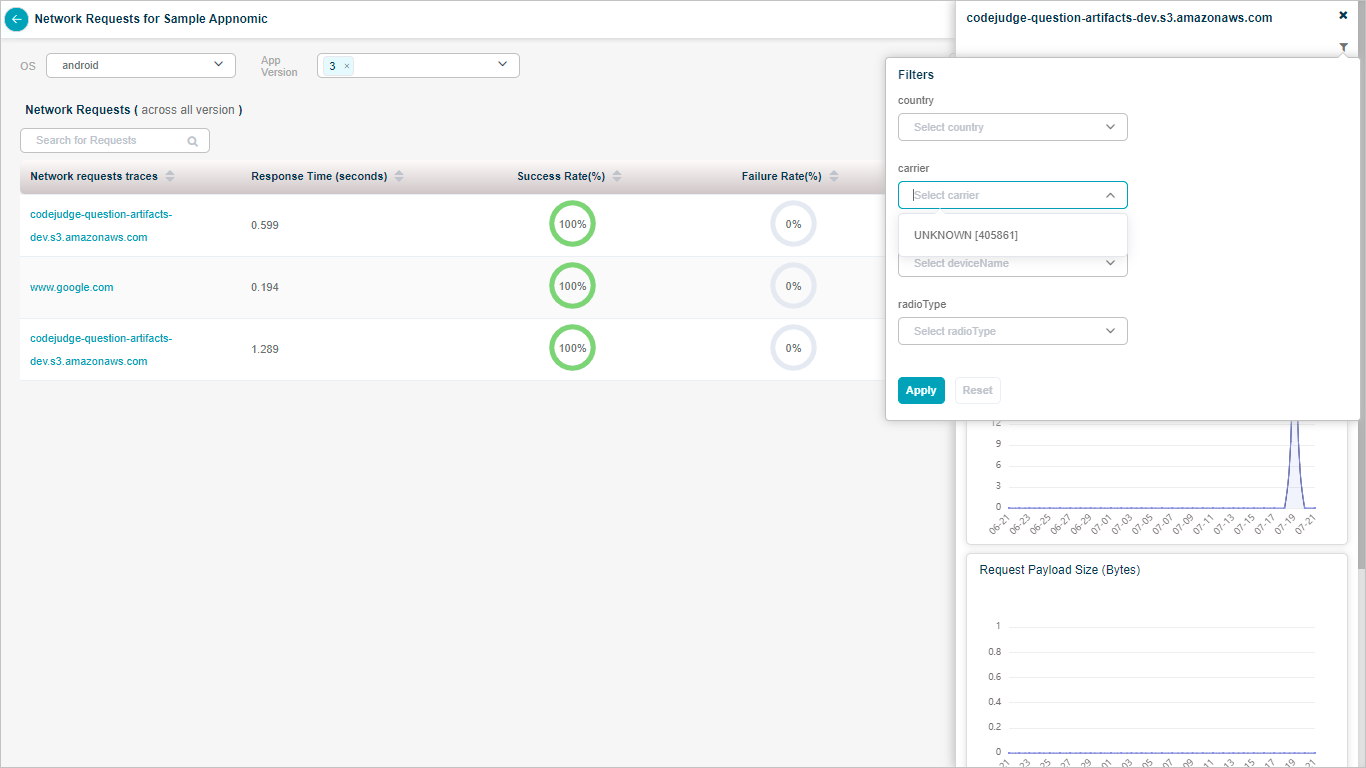
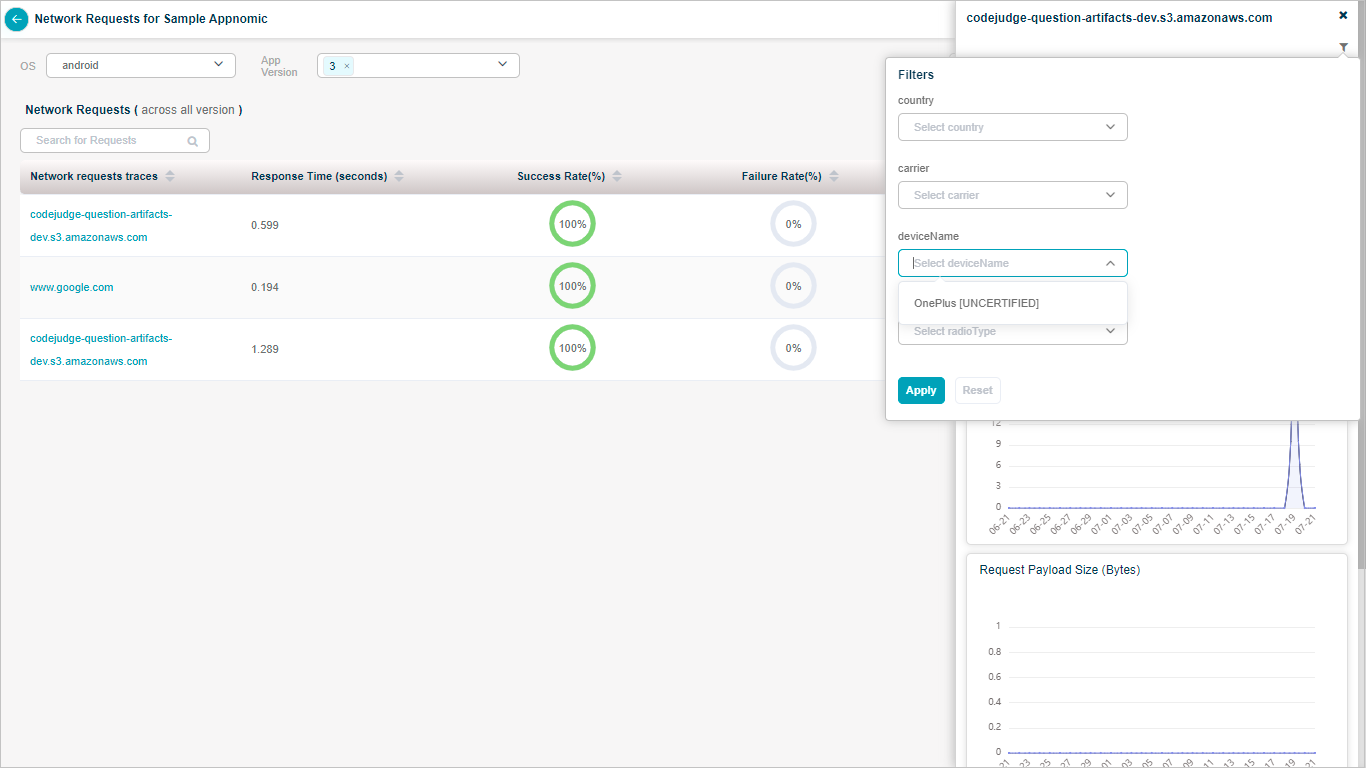
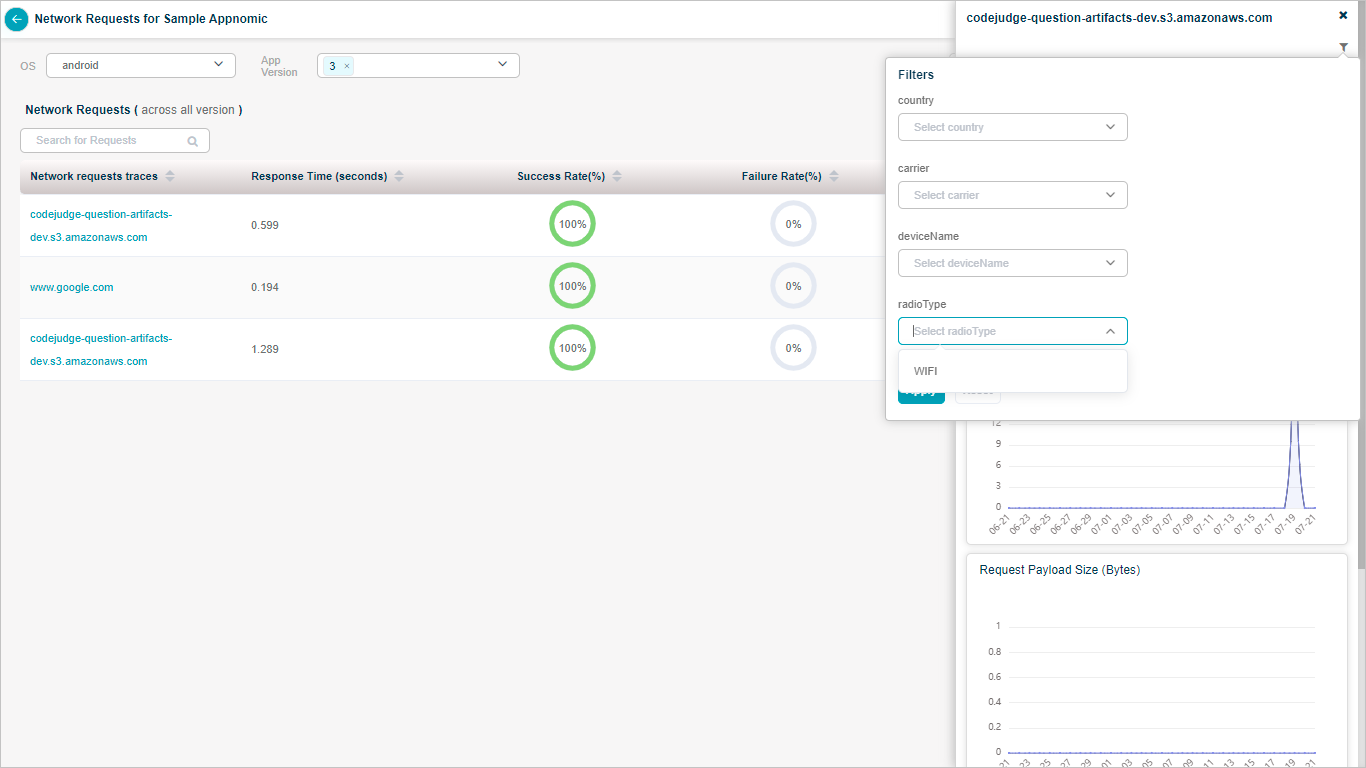
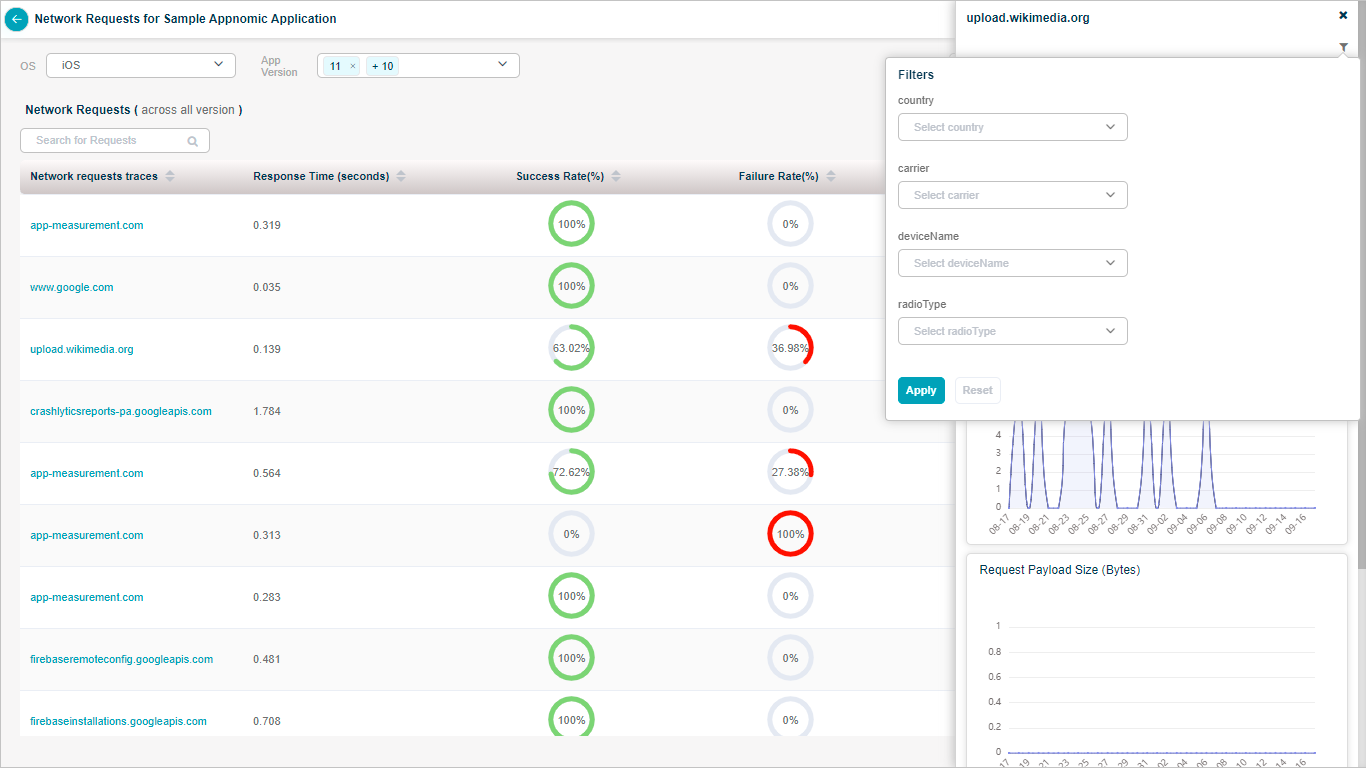
You can filter the data in the graphs as per your criteria.
- Carrier – NW provider.
For Example: Airtel, Vodafone etc.
- Device name – Mobile handset model.
- Radio type – It can be mobile data or WIFI.
Network Requests
Network Requests
Network Requests
Network Requests
Network Requests
Application Usage
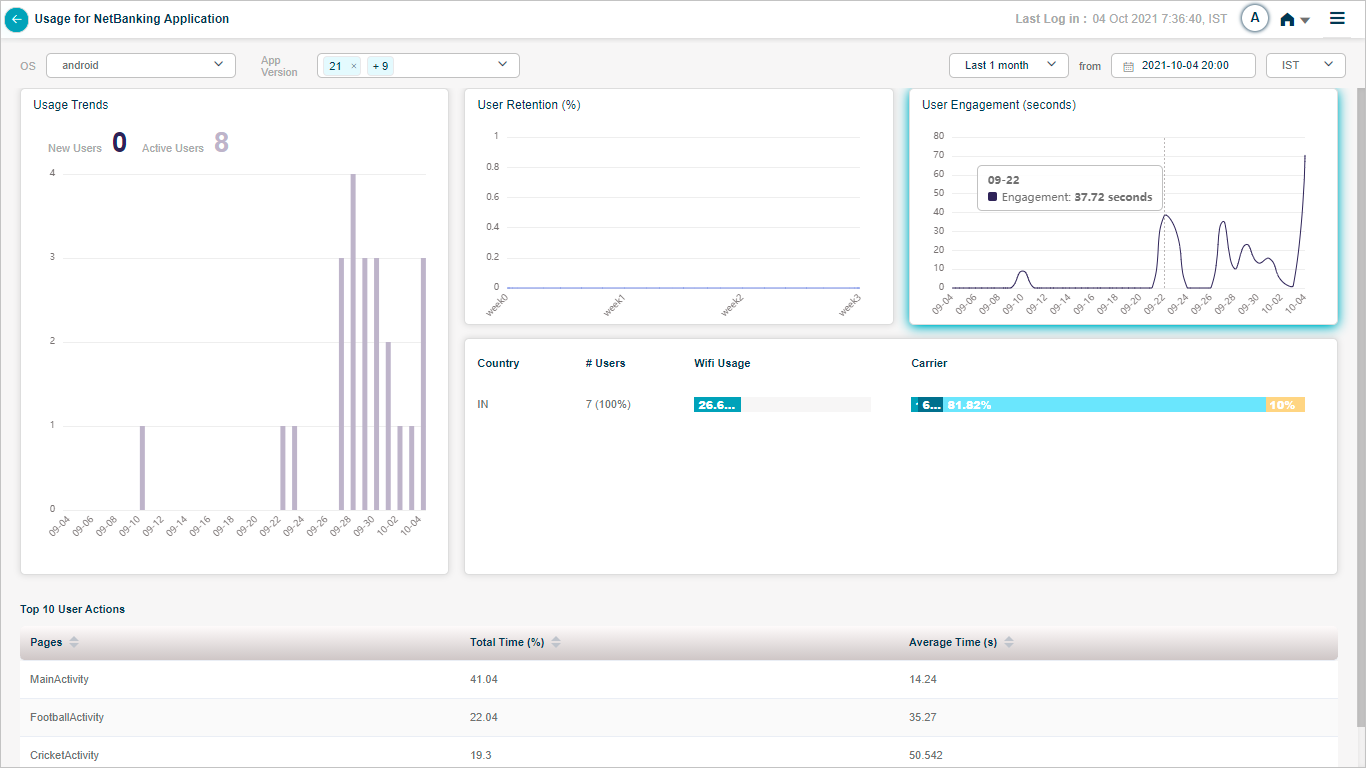
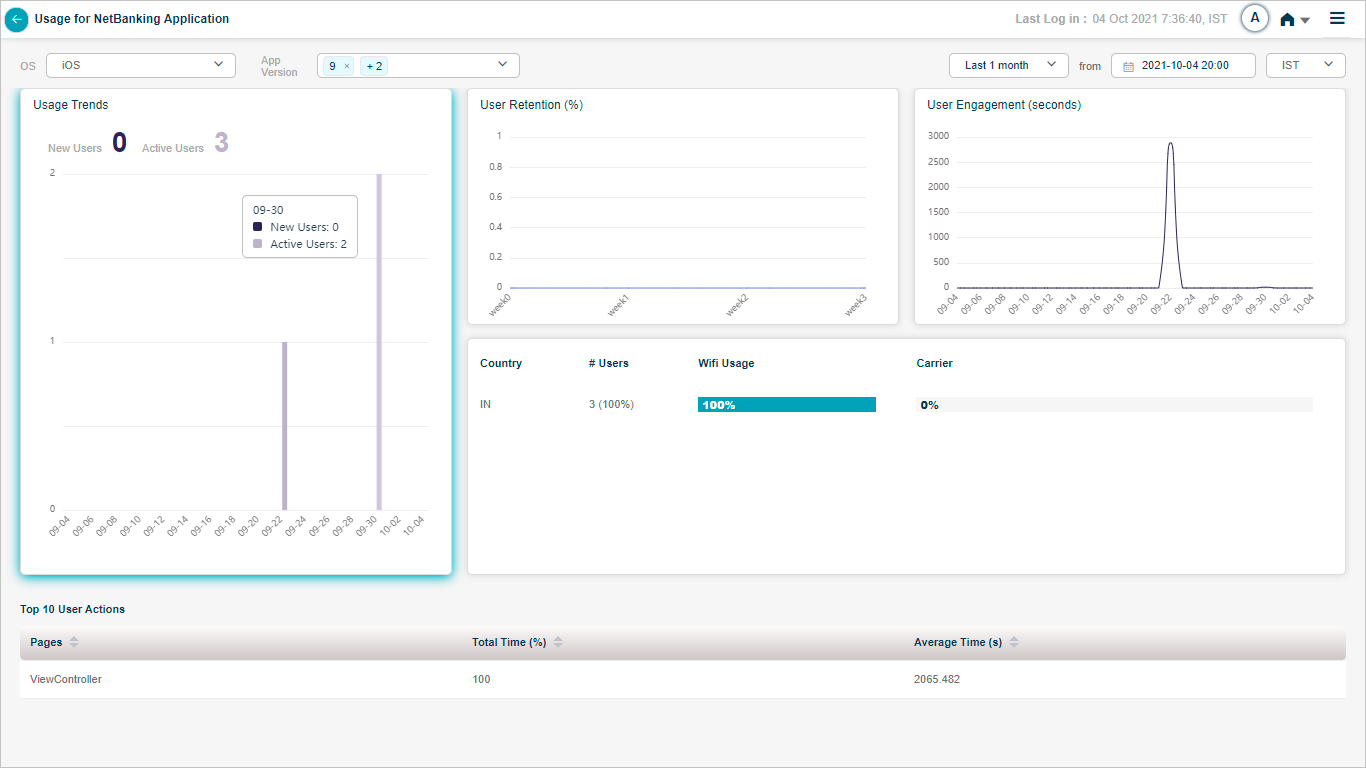
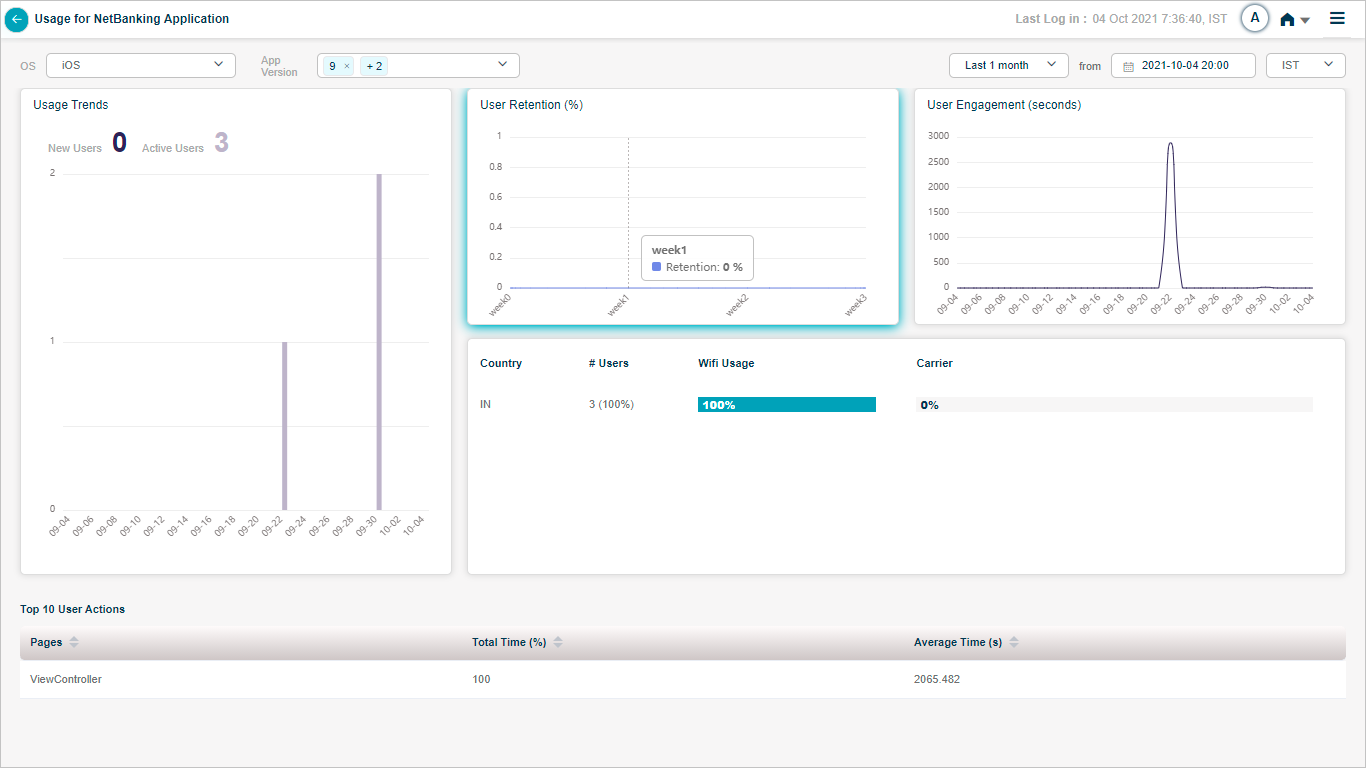
Usage pod displays the total number of users, percentage of users which got affected because of the crashes, and percentage of users which did not observe the crashes on their mobile handsets. HEAL displays the graph of Active vs Affected users.
App Summary
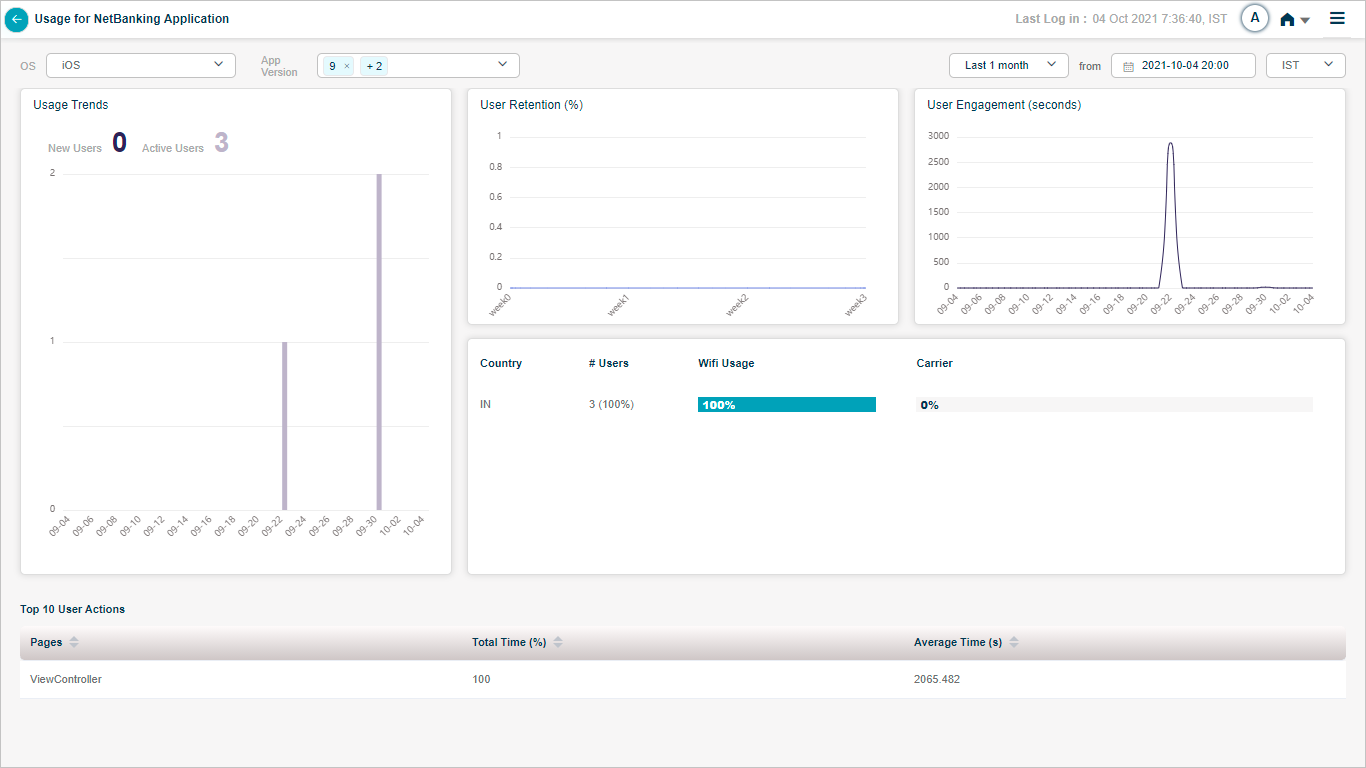
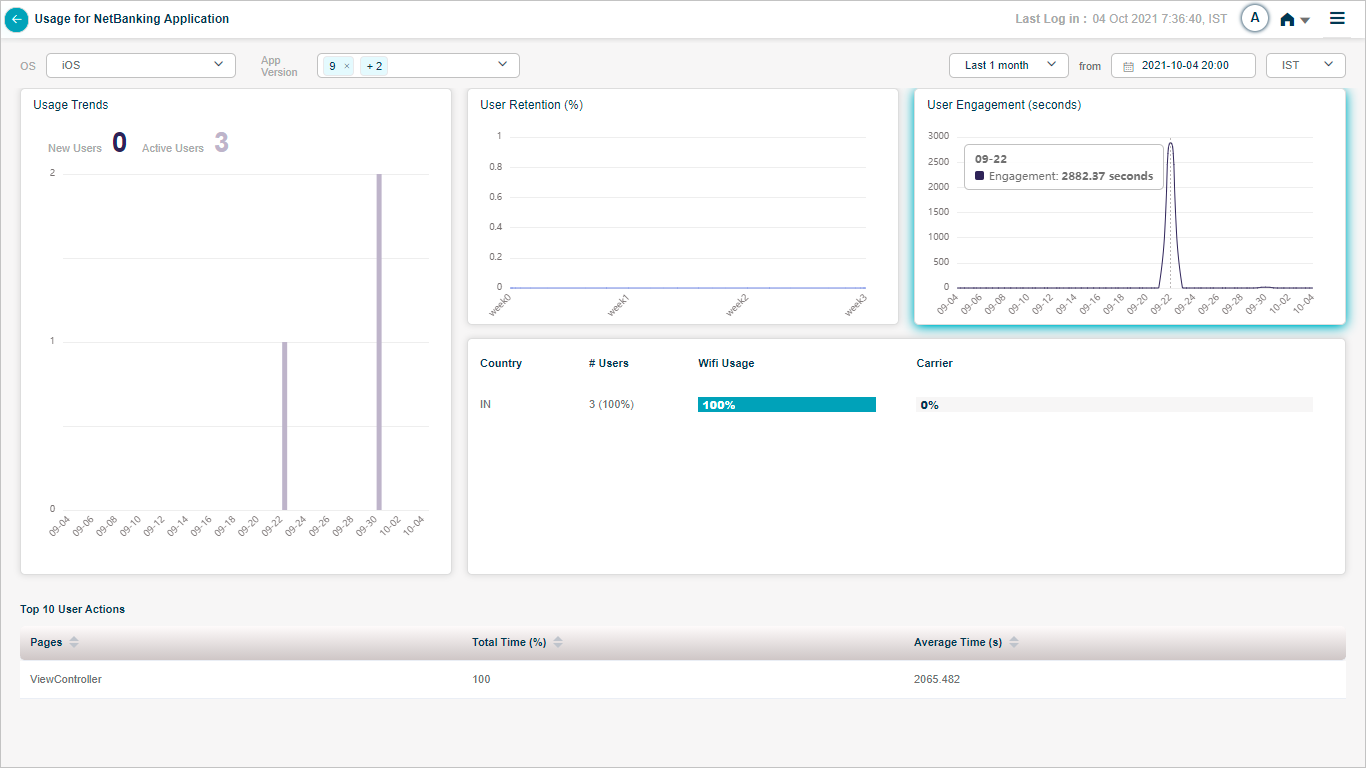
HEAL displays following screen when you select Usage pod.
App Summary
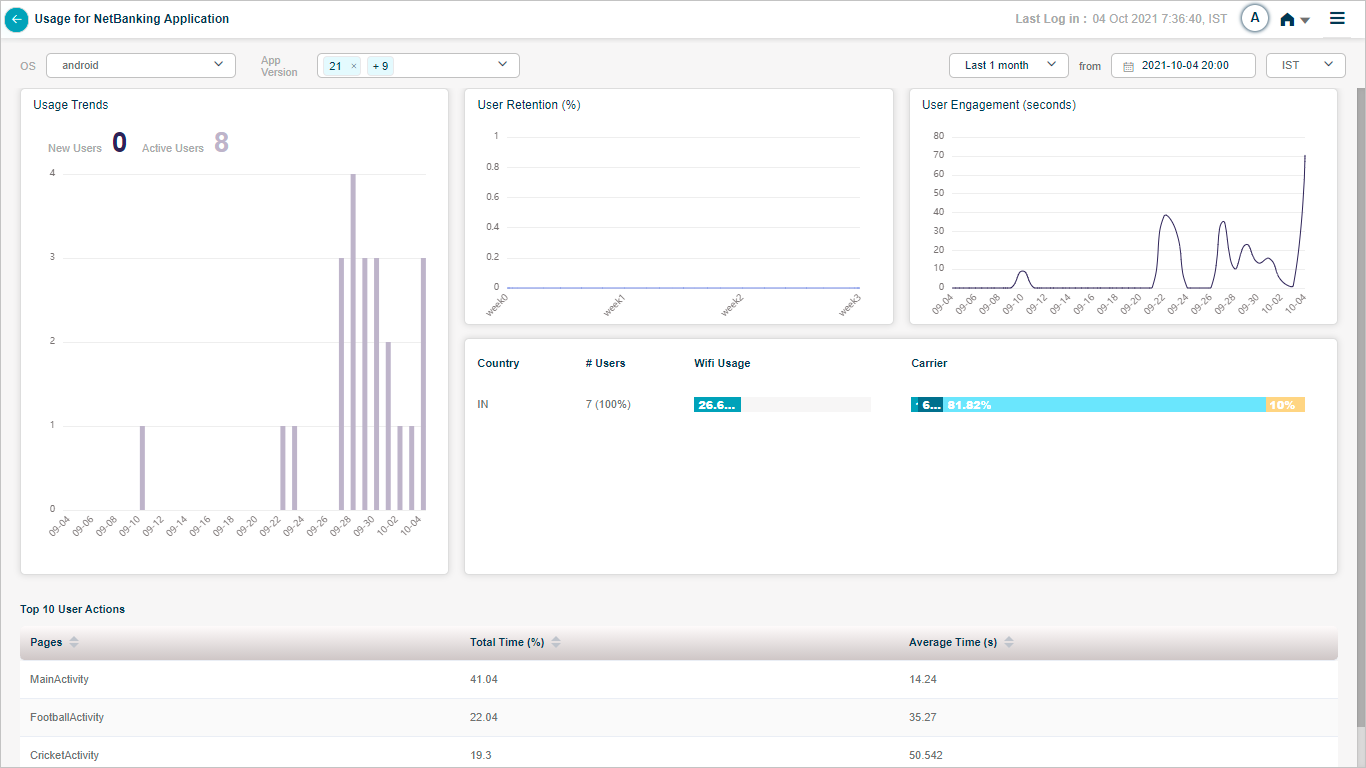
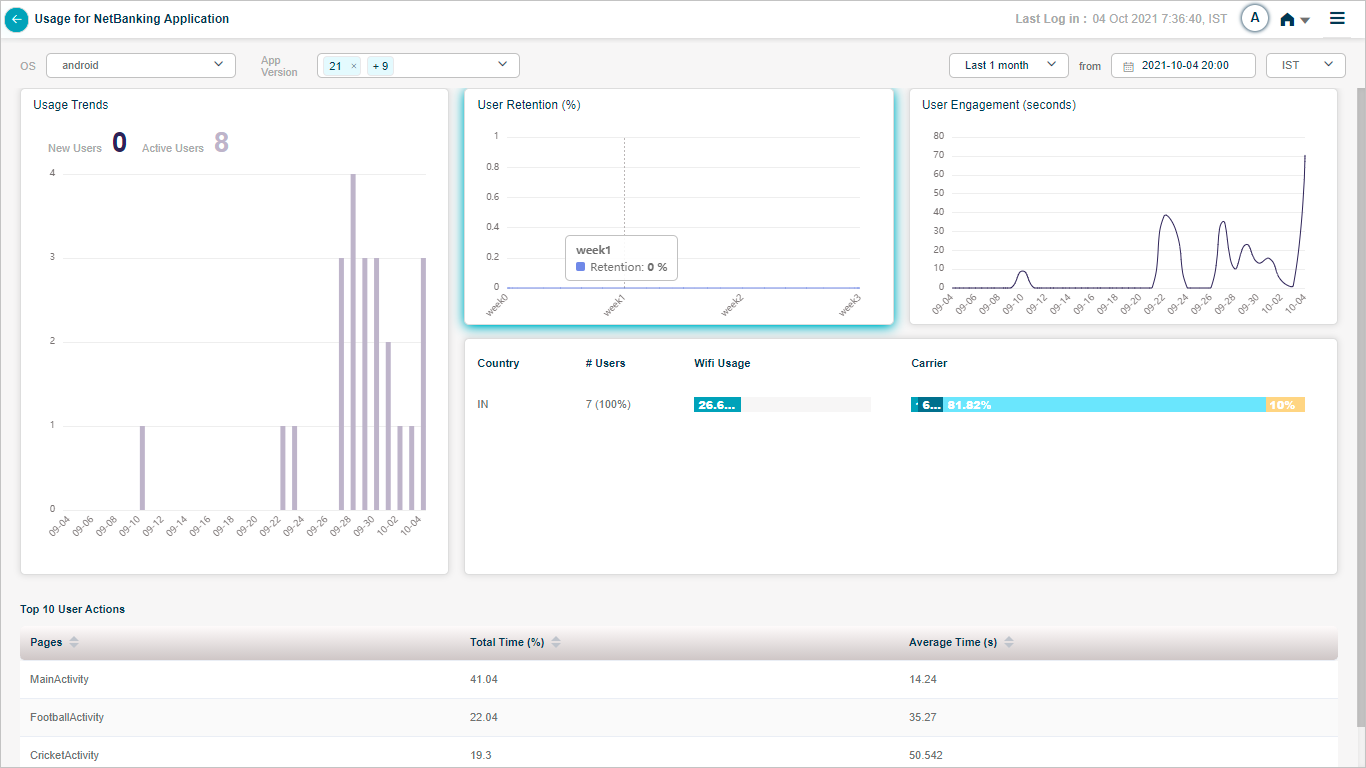
Active user is the one who uses the application. New user is the one who installed the application. User retention is based on new users. On the first day of the time period you select in top right corner, user retention is always 100%. It indicates how many new users used the application for the first time. From next day onwards till the last day in the series of the time interval selected, HEAL displays the retention percentage with respect to the first day in the series. Even if more number of users used the application on any day in the series, HEAL excludes those extra users. Day one is the reference. This helps in knowing among the users who used the application for the first time on day1 were retained in subsequent time interval.
There can be different number of active users on any day. User engagement indicates the total time spent on the application by all the active users on a specific day in minutes.
App Summary
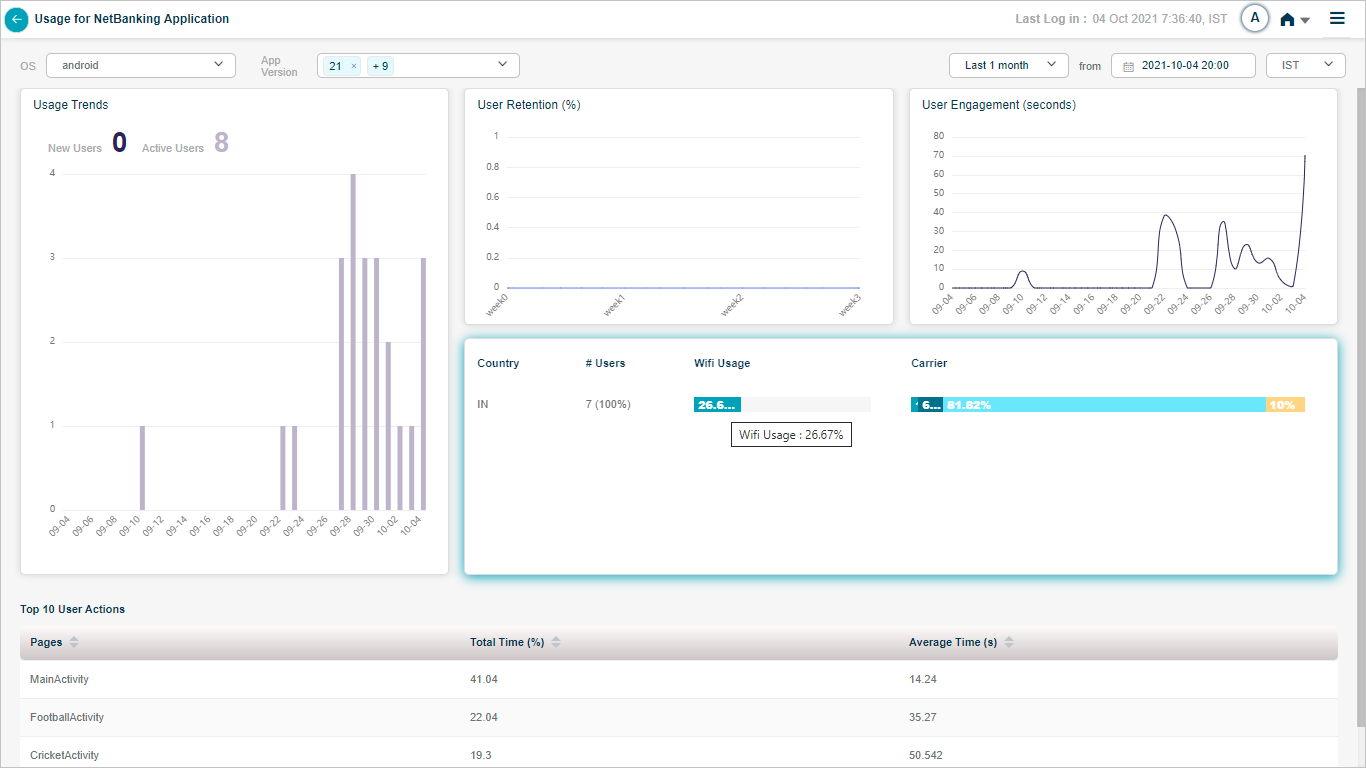
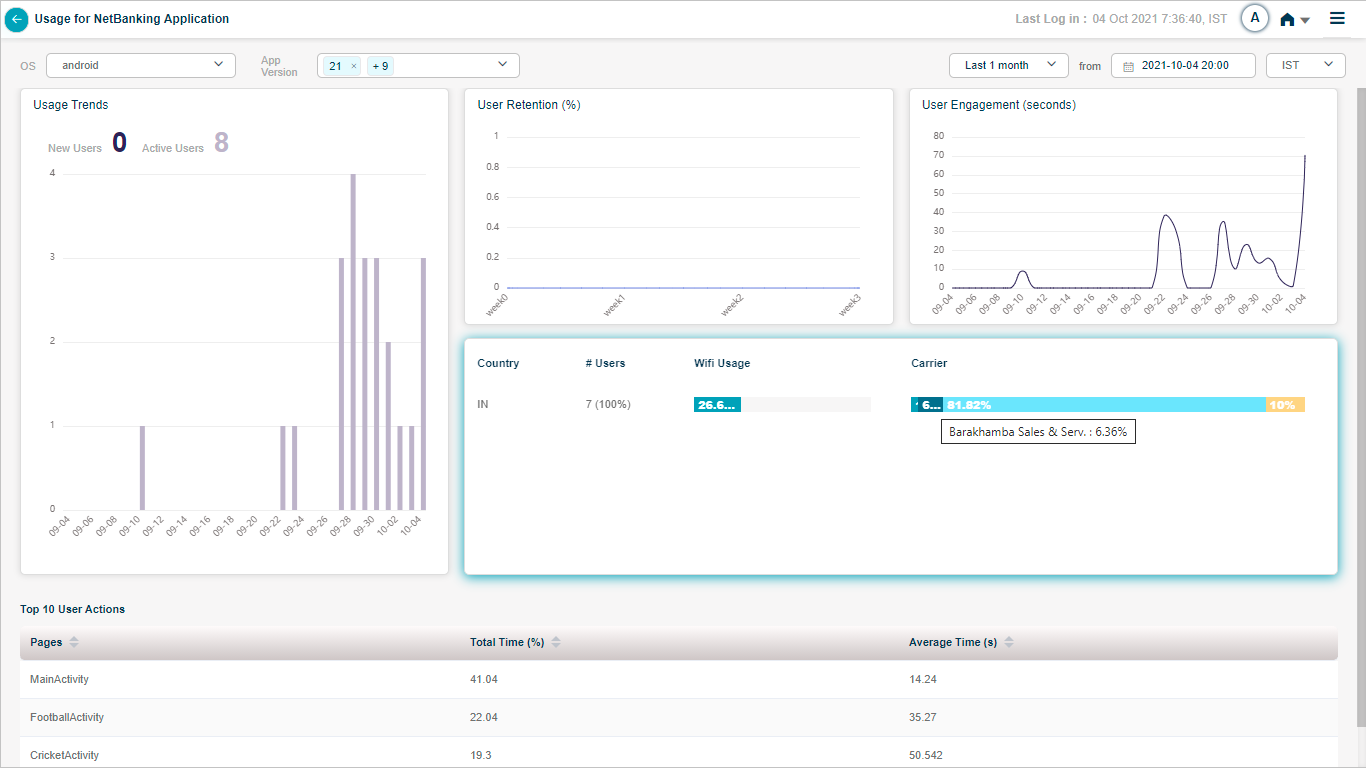
Country pod displays the applicable countries based on the number of users. Carrier column indicates the service provider. Career column indicates the percentage of users who use their own network and not WIFI. Carrier percentage displays the share of usage of each carrier by the users in a particular country. It is (total network usage – WIFI usage)%.
WIFI usage example: Say, two users are using the application. One user used the application 10 times. This user used WIFI nine times. Other user used the application five times. This user used WIFI two times. Number of times the application used = 15
Number of times WIFI used = 11
Percentage of WIFI usage by all the users from a particular country = 11/15*100
Carrier usage example – In above scenario, number of times carrier used = 4
Say, (1/4) one service provider, (3/4) another service provider.
HEAL displays carrier usage in different colors. (1/4)*100 in one color, (3/4)*100 in other color.
Users example – Say, IN has 5000 users, UK has 3000, US has 1500 and FR has 500 users, then total users across the world = 5000+3000+1500+500 = 10000
So, percentage of users from IN = (Users in IN)/(Total Users across the world) x 100% = 5000/10000 x 100% = 50%
Percentage of users from UK = (Users in UK)/(Total Users across the world) x 100% = 3000/10000 x 100% = 30%
Percentage of users from US = (Users in US)/(Total Users across the world) x 100% = 1500/10000 x 100% = 15%
Percentage of users from FR = (Users in FR)/(Total Users across the world) x 100% = 500/10000 x 100% = 5%
#Users column indicates total number of users in a country and the percentage of users in that country out of the total users from the entire Globe.
App Summary
App Summary
App Summary
Users Across the Globe
App Summary
Hover on any highlighted country in Users Across Globe pod. For a specific mobile application, if any users used the application in any country, then HEAL highlights that country. Say, in the time period you selected, 10 people in India used the application, then HEAL highlights India on the Global map. If some people from other countries used the application, then HEAL highlights those countries as well on the map.
Performance Details for iOS
App Summary_Performance Details
App Summary_Performance Details
App Summary_Performance Details
App Summary_Performance Details
App Summary_Performance Details
App Summary_Performance Details
App Summary_Performance Details
App Summary_Performance Details
App Summary_Performance Details
App Summary_Performance Details
App Summary_Performance Details
App Summary_Performance Details
App Summary_Performance Details
App Summary_Performance Details
App Summary_Performance Details
App Summary_Performance Details
App Summary_Performance Details
App Summary_Performance Details
App Summary_Performance Details
App Summary_Performance Details
App Summary_Performance Details
App Summary_Performance Details
App Summary_Performance Details
App Summary_Performance Details
App Summary_Performance Details
App Summary_Performance Details
App Summary_Performance Details
App Summary_Performance Details
App Summary_Performance Details
App Summary_Performance Details
App Summary_Performance Details
App Summary_Performance Details
App Summary_Performance Details