How Can We Help?
The Root Cause Analysis (RCA) helps you to identify the root cause of performance problems. By understanding the root cause of a problem, you can take steps to fix it and prevent it from happening again.
Using this feature, you can:
- Identify the impact service: The impact service is the service that is experiencing a slowdown. This could be an end-user-facing service, such as a web application, or an internal service, such as a database.
- Identify the root cause of service: The root cause of service is the service that is causing the slowdown. This could be a hardware failure, a software bug, or a network issue.
- View the RC walk: The RC walk is a path from the impacted service to the root cause service. This path shows how the slowdown is propagated through the system.
- Get more information about the root cause: HEAL provides you with information about the root cause, including things like the symptoms, the impact, and the steps that you can take to fix it.
- Take corrective action: Once you have identified the root cause, you can take steps to fix it and prevent it from happening again.
Root Cause Walk
1. Go to the Signals page. See Signals Navigation.
2. Click on the signal ID you want to investigate or select a link to the signal in an email notification to display a signal report.
3. On the Summary tab, click Root Cause Walk.
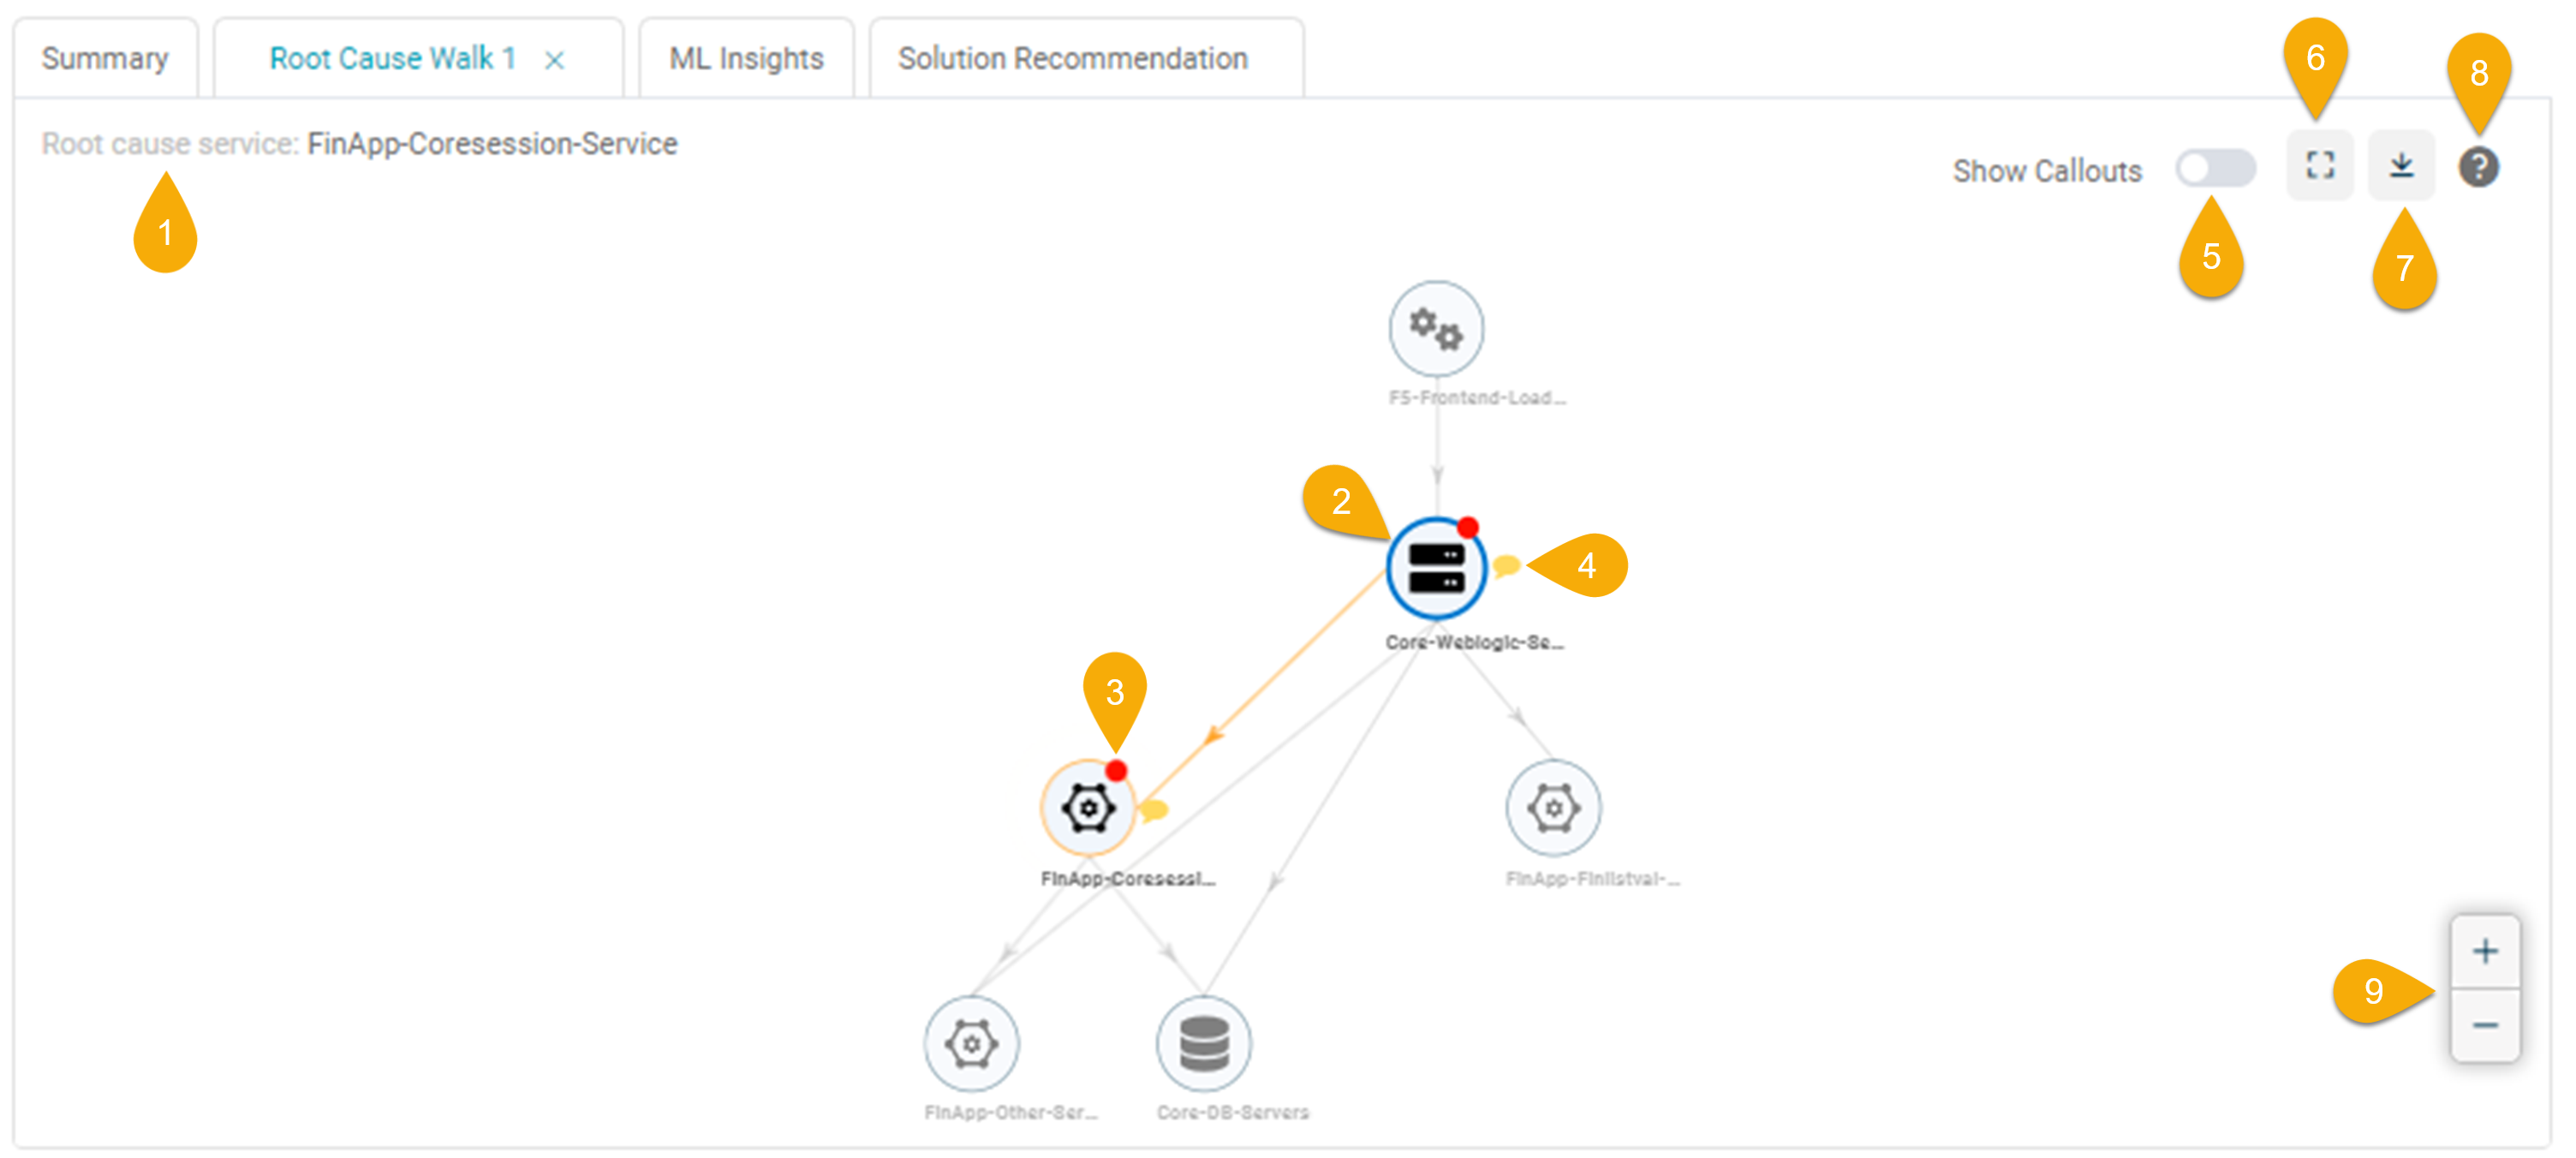
Root Cause Walk
| Field | Description |
|---|---|
| 1 – Root Cause Service | The root cause service(s) responsible for the signal. |
| 2 – Service | Select a service to view its detailed information on the Service Details screen. |
| 3 – Red Dot | A red dot above the circle indicates the service with events. |
| 4 – Yellow Message Icon | Click on the icon to view the top three events associated with a particular service, ranked based on the highest relevance score. See Event Ranking. |
| 5 – Show Callouts | Enable the slider to display the top three load or behavior events for all services with events within the root cause walk. See Event Ranking. |
| 6 – Zoom to Fit | Select |
| 7 – Download | Click on the Download button to download the Service Dependency Map (SDM) in PNG format for offline viewing or record-keeping. |
| 8 – Help | Click the Help button to understand the symbols and color codes used in the service display. Refer to Viewing Legends. |
| 9 – Zoom In/Zoom Out | Click on the ‘Zoom in (+)‘ and ‘Zoom out (–)‘ buttons to adjust your view, allowing you to focus on specific details or see a broader perspective. |
a. The Root Cause Walk tab will show you the below details:
- Both the root cause service and the impacted service are distinctly marked.
- A path is delineated toward an entry service that could be affected.
- Services along this path and any associated events are included in the Incident Timeline and highlighted in orange.
You can select a service to view its detailed information on the Service Details screen.
b. The RCA Walk also plays a pivotal role in the generation of Signals:
- If an affected service is along the direct path of the original service, it’s added to the existing Signal.
- If an affected service isn’t along the direct path of the original service, a new Signal is created.
4. Click on the root cause service to get more information.
5. Once you have identified the root cause, you can take steps to fix it and prevent it from happening again.
Event Ranking
Event Ranking is a feature of HEAL that helps IT teams prioritize events based on relevance. Relevance is determined by analyzing a range of factors such as the frequency of the event, the number of systems or users affected, the business impact, and the urgency of the issue.
HEAL ranks the events based on a relevance score and displays them in descending order. This helps IT teams quickly identify and prioritize the most critical issues and focus on resolving them first.
- Significance score (S): This is a weighted score of the event related to the incident. It is calculated by considering the frequency of the event, the number of systems or users affected, and the business impact.
- Impact score (I): This is the likelihood that an event results in an incident. It is calculated by considering the event’s severity, the issue’s urgency, and the availability of resources to resolve the issue.
- “Interesting” ness (N): This score measures how interesting an event is in the context of the problem. It is calculated by considering the frequency of the event, the number of systems or users affected, and the business impact.
I, S, and N weights are learned using machine learning. This allows HEAL to rank events more accurately and effectively
Showing Top Service Events
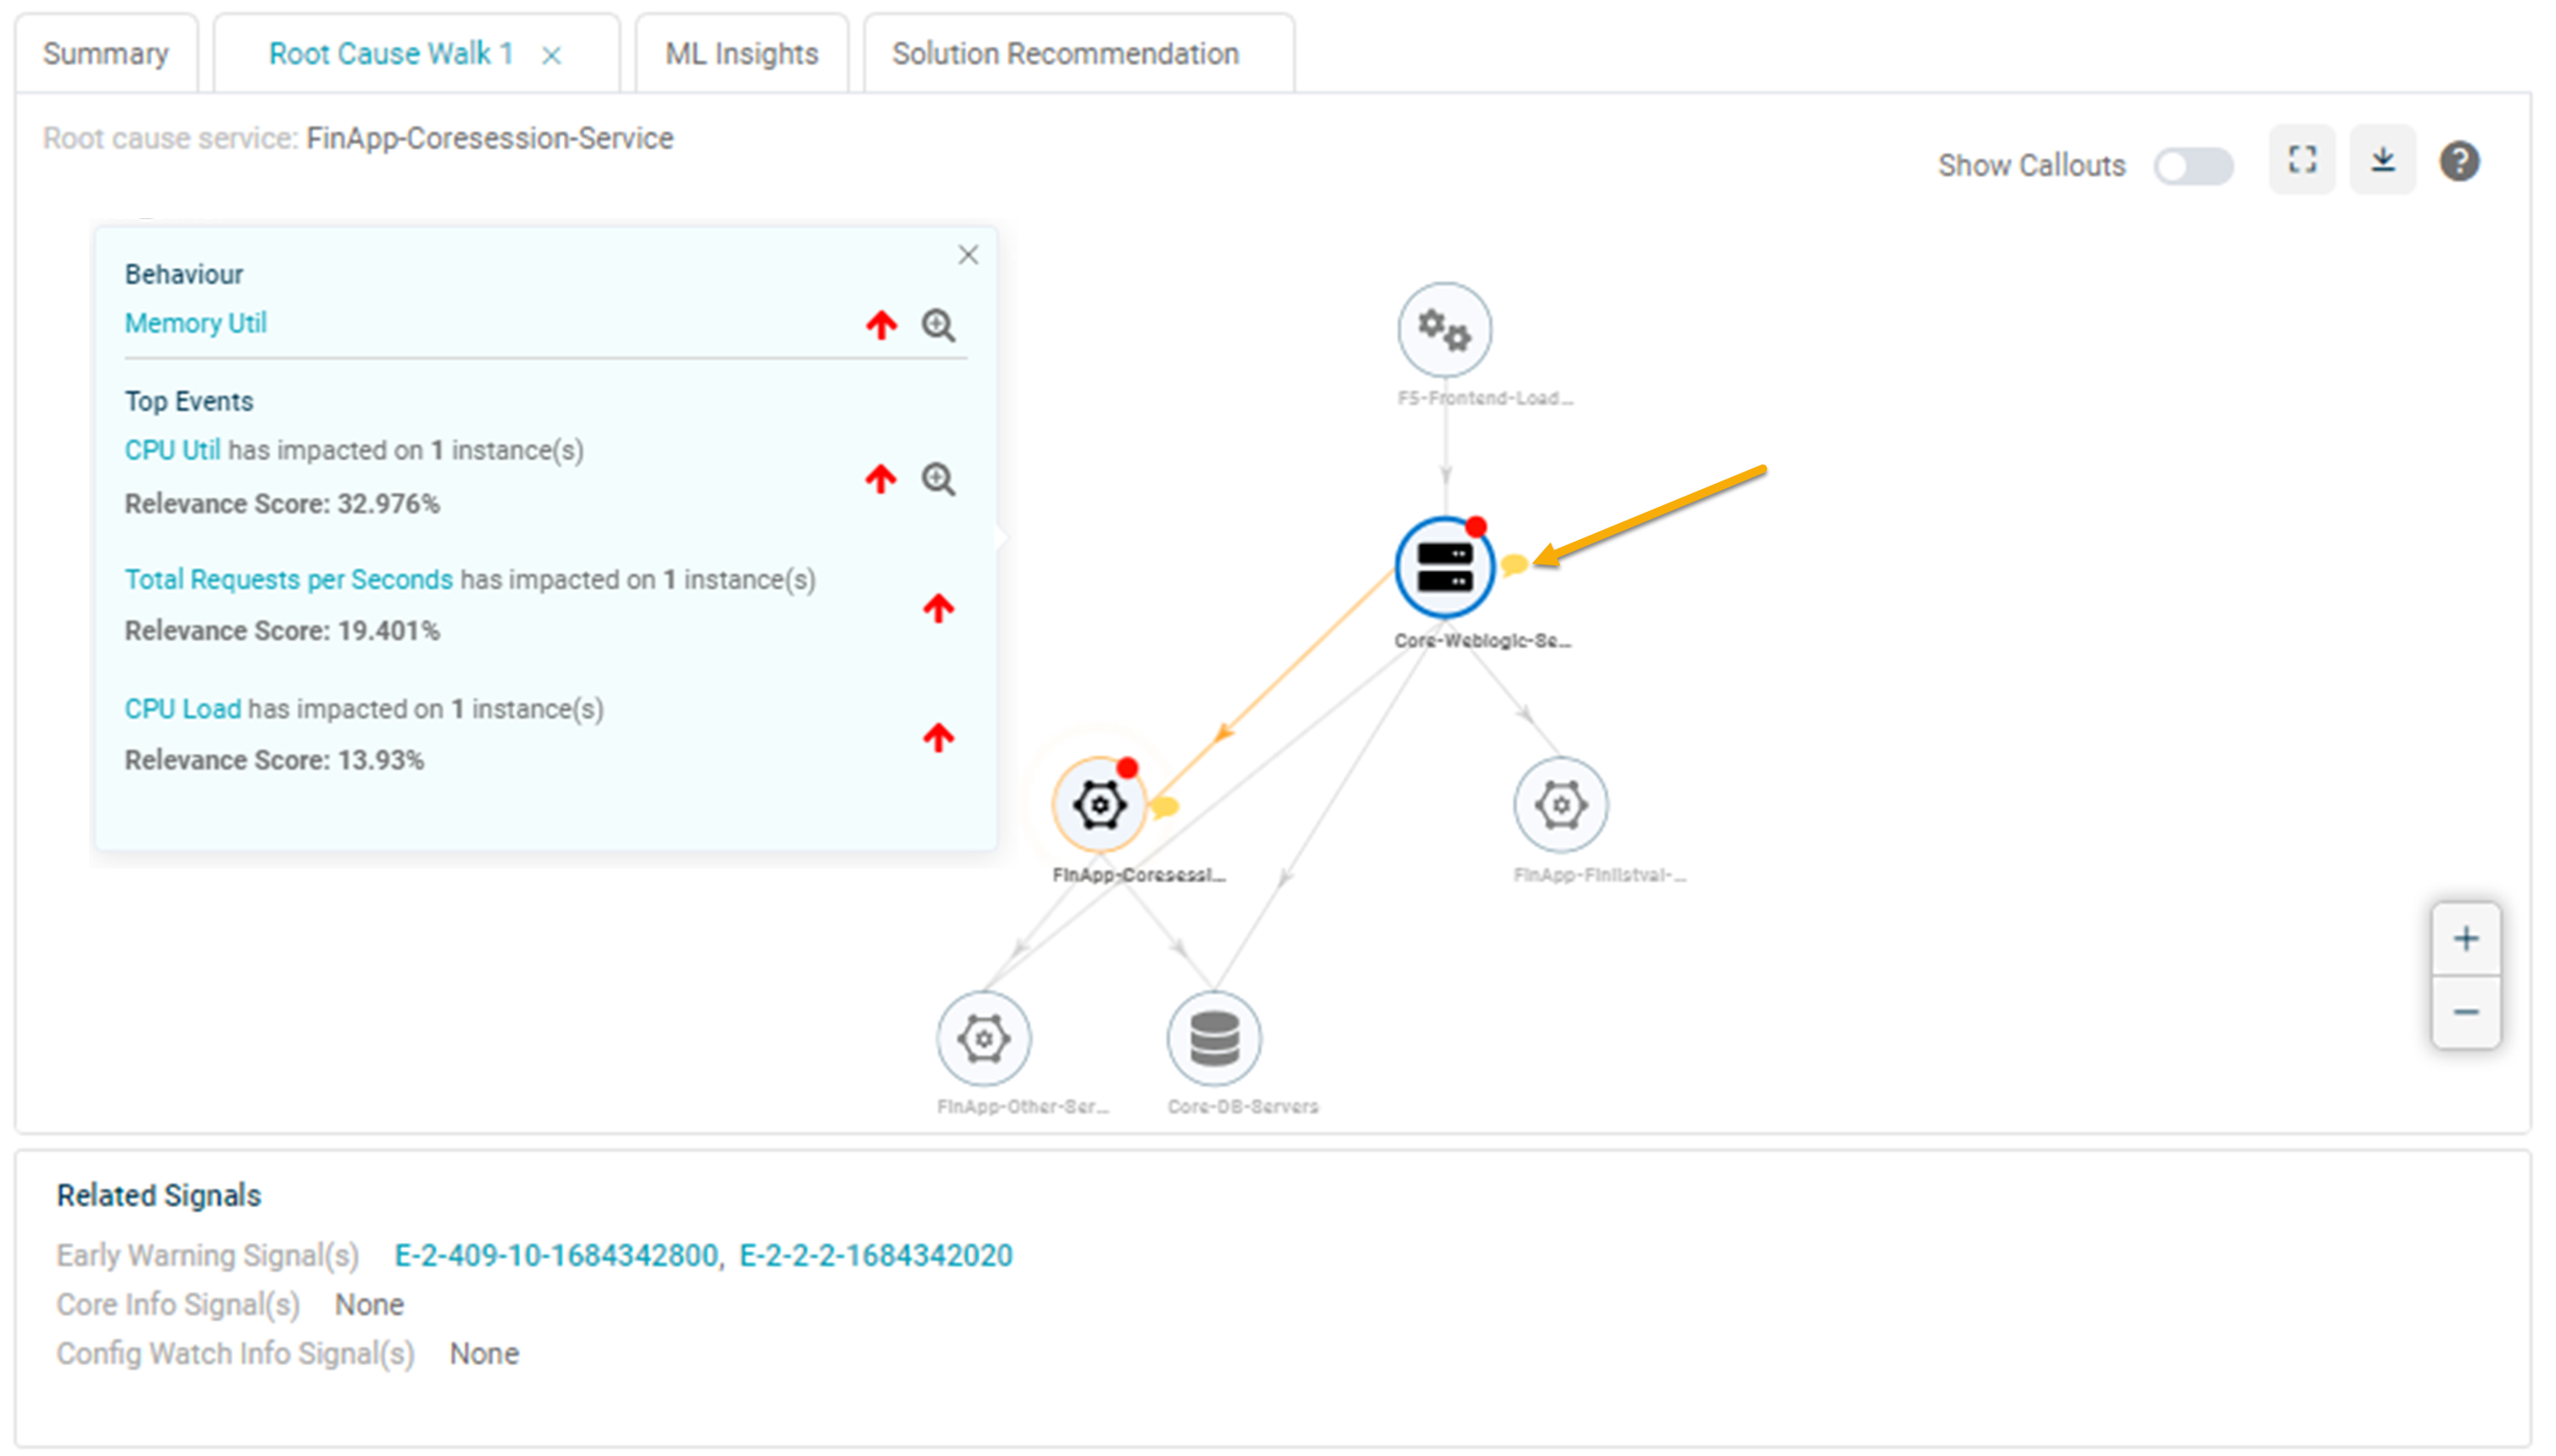
1. Click the yellow message icon to display the callout with the top three events associated with that service based on relevance score.
Event Ranking
2. Enable the Show Callouts slider to display all the callouts with the top three events associated with the services based on relevance score.
Event Ranking
The callout includes the following information:
- The top three events associated with the service. These top three events can be load, behavior, or a mix.
- The KPI name has the highest relevance score above these events. Click on the KPI name in the callout to navigate to the Service Details screen.
- An up or down arrow in red on the right of the KPI name/event name. An event can occur due to either an upper threshold breach, indicated by an up arrow, or a lower threshold breach, signified by a down arrow.
- Use the zoom button to explore the forensic details of the specific service associated with the KPI. See Viewing Forensics.
Highlighting Service Connections
Hover your cursor over a service icon (the round circle) to illuminate the inbound and outbound links for a particular service.

Viewing Legends
Click the Help button ![]() to understand the symbols and color codes used in the service display.
to understand the symbols and color codes used in the service display.

Here’s a brief overview of the legends:
- Entry Point Service: This symbol represents the initial service where transactions begin.
- Behavior Events: These symbols correspond to unusual activities or anomalies detected in the service.
- Root Cause Service: This symbol identifies the service responsible for the issue or signal.
- Request Violated: This symbol signifies a service where a request has breached a defined threshold.
- Path leads to root cause service: This symbol marks the path to the identified root cause service.
- External Service: This symbol represents a service that is not a part of the application but interacts with it.
- Service not part of root cause path: This symbol indicates a service not part of the direct path to the root cause.