How Can We Help?
The Service Details Dashboard allows you to monitor and analyze the performance and behavior of a service. A service is a logical grouping of instances that perform a specific function or provide a specific capability. The dashboard provides a quick overview of the health of a service at a given time, as well as detailed information on the instances, KPIs, signals, and events of the service. You can use the dashboard to identify and troubleshoot problems, optimize resource utilization, and improve service quality.
Using this Dashboard, you can:
- View the health of service at a glance.
- Get detailed information about the instances running on a service.
- Monitor workload and behaviour KPIs.
- Identify and troubleshoot performance issues.
- Get insights into the dependencies between services.
Navigating Service Details Dashboard
Choose a Service from the Service Dependency Map (SDM) in the Application Summary Dashboard. See Application Summary. The Service Details Dashboard appears as shown below.
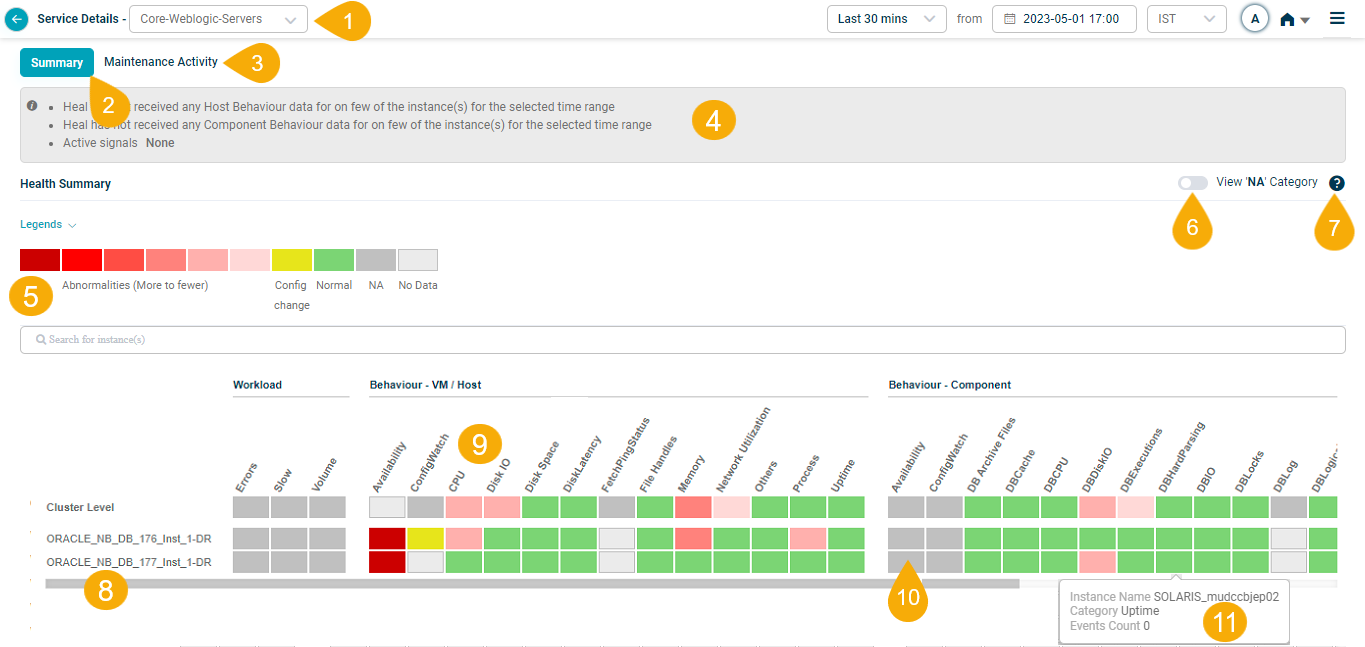
Service Details Dashboard
| Field | Description |
|---|---|
| 1 – Service Selection Field | This allows for easy navigation between different service data views. The service initially selected will be chosen by default. To view data related to other assigned services, select a different service from this drop-down menu. |
| 2 – Summary | The Summary tab provides a quick and easy way to get an overview of the health and performance of a service. |
| 3 – Maintenance Activity | The Maintenance Activity tab is used to track the progress of maintenance activities and identify any issues that may have occurred during the maintenance process. |
| 4 – Data Overview | This field describes the data presented. |
| 5 – Legends | The Legends section provides a color-coded legend that helps you to understand the meaning of the data that is displayed in the dashboard. See Viewing Legends. |
| 6 – View ‘NA’ Category | NA categories can be shown or hidden to make it more readable or to troubleshoot performance issues. See View ‘NA’ Category. |
| 7- Help | This section provides a description of the color-coded legend that helps you to understand the meaning of the data that is displayed in the dashboard. See Viewing Help. |
| 8 – Instances | Instances are listed in alphabetical order. You can create a service with host instances only. In this case, only host instances are listed in the heat map. You can see the Cluster Level data with Cluster Level on top. Instances are listed in alphabetical order. It is possible to create a service with host instances only, resulting in the heat map displaying host instances exclusively. Cluster Level data can be viewed at Cluster Level option. i. You can scroll across to view all the instances when there are more instances. ii. Hovering over a specific component instance in the HEAL application will display the IP address of the associated host. |
| 9 – Metric Categories | Metric categories are listed in alphabetical order. You can see the Workload KPIs, and Behaviour KPIs at the VM/Host level and the Component level. See Types of KPIs. |
| 10 – Block | Each block represents a category for an instance or a cluster. This layout facilitates easy visualization of category distribution across various instances or clusters. |
| 11 – Hover Event Display | By hovering over the blocks, the event count corresponding to the specific Key Performance Indicator (KPI) categories at the instance or cluster level will be displayed, providing immediate insight into event numbers for KPI categories. See Events. |
Events
The HEAL is designed to produce events based on predefined thresholds. These thresholds encompass two primary types: Normal Operating Range (NOR) and Safe Operating Range (SOR).
NOR
NOR is a dynamic threshold that HEAL uses to detect abnormal behavior in an application. It is determined by analyzing historical data on system behavior and performance to establish a norm. When the behavior of the system or application deviates from the NOR, this may indicate a potential problem.
NOR processes are as follows:
- The algorithm compares time series values with upper and lower threshold values derived from historical data and identifies time points as events when values are beyond the thresholds.
- MLE develops the algorithm and continues to be updated at predetermined intervals.
- The algorithm partitions the data into twenty-four groups (one corresponding to each hour of the day) and computes separate thresholds for each group.
SOR
SOR is a static range of an extremely high and an extremely low value. There are two types of SOR:
- Automatic SOR: Generated by the system by doing simple time series learning on recent values of a metric. The objective is to generate a high or low-value pair beyond which anomaly should be raised regardless of whether the observed metric value is normal.
- Manual SOR: Admins can override the Automatic SOR and provide their range of values for any metric.
SOR or availability KPIs have persistence or suppression rules at a service level. They can be modified in the Control Center at a service level.
Types of KPIs
The Key Performance Indicators (KPIs) in HEAL application are classified into two types: Workload KPIs and Behavior KPIs.
1. Workload KPIs: These KPIs measure the volume of load in terms of requests and responses served by the instance, as well as the status and response time of the requests.
2. Behavior KPIs: These KPIs provide insights into how the monitored instances function or behave. A Behavior KPI could be a Performance Metric or an Availability Metric.
- Performance Metric KPI: This type of KPI represents the performance data of the component and host instances. The values can be numerical values of different types.
- Availability KPI: These KPIs denote the state of instances and ports. The state could be either up or down, and the values are binary (0 or 1).
Viewing Legends
Click Legends to display the color-coded legend that helps you understand the data displayed in the dashboard.
To understand the description of the different legends, see Viewing Help.
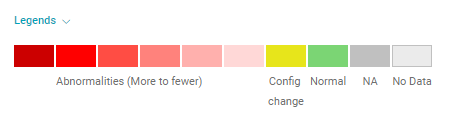
Legends
Viewing Help
Select help icon ![]() on the Service Details dashboard to display information on the service details as described below.
on the Service Details dashboard to display information on the service details as described below.
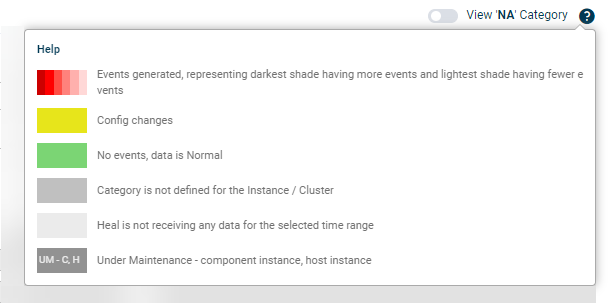
Viewing Help
Viewing NA Category
The NA (Not Available) categories are hidden by default to streamline the interface and enhance readability.
To view the categories with all the KPIs at both cluster and instance levels as NA, turn the slider to the ON position. This action will adjust the view settings and enable the display of NA categories.
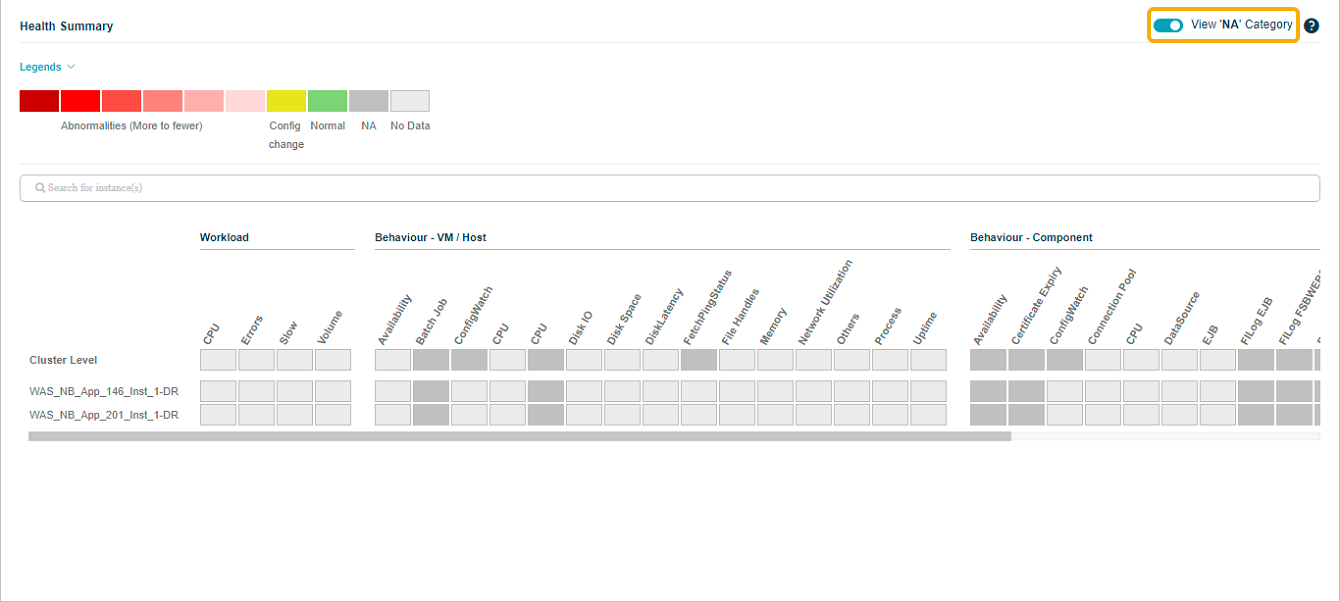
View ‘NA’ Category
Next Steps
Learn about Instance Details and Aggregated Details for Services. Click inside a block to access a specific application’s Instance Details and Aggregated Details for Services screen.