How Can We Help?
Reports are the extraction of information on the performance and behavior of applications, infrastructure, and services. The generated reports display the detailed analysis of reports in a linear PDF, CSV, XLS, and HTML format.
Generate a Report
Follow the below steps to generate both internal and external reports.
1. Generate a new report from the HEAL UI page. Select Reports on the CXO dashboard and select Generate.
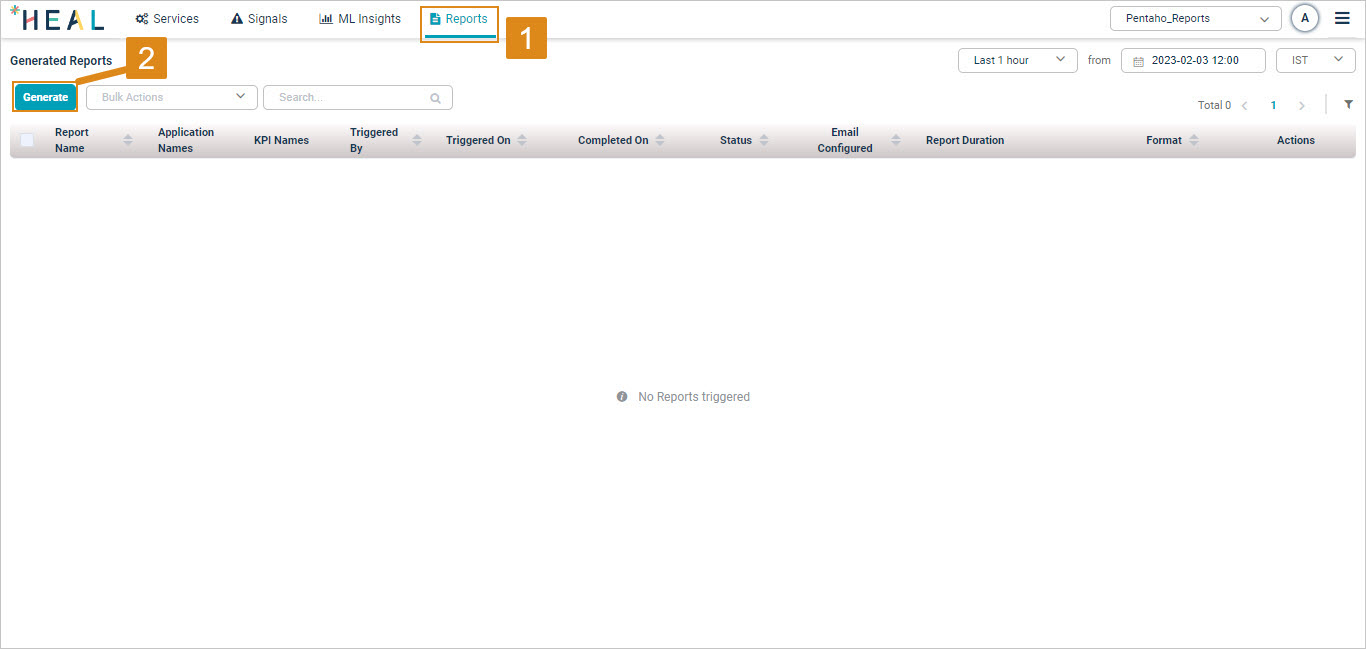
Reports
2. The Generate Report window is displayed. Select the report (internal or external) you want to generate from the Report drop-down menu.
For more information on the reports, see the section Details of Reports.
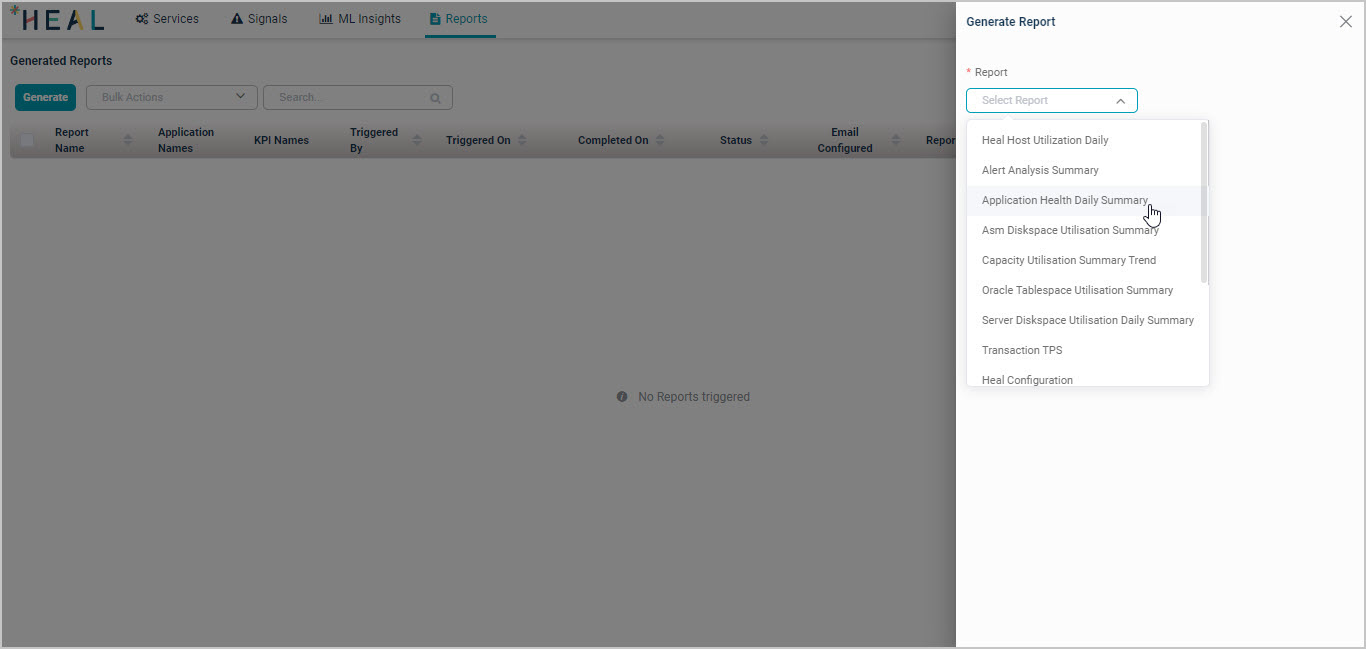
Generate Reports Page
3. After selecting the report, provide the following details and then select Generate.
- Select Reset to clear the field and reenter the details to generate the report.
- Choose from the Month or Custom date.
- Choose the application from the Application drop-down menu.
- Choose the KPIs from the KPIs drop-down menu.
- Choose the format of the report from the Report Format drop-down menu.
- To receive the report by email, select Configure Email and enter your email address in the textbox.
An email will be sent to all recipients with the reports.

4. The message “Successfully triggered report generation” is displayed once the report generation is successfully triggered.


5. If a report has already been triggered for the same time period, application, and output format, then you will not be able to trigger it again.
The error message is displayed as shown below. You can generate the report by making changes to the above configurations and relaunch the report, or delete it and start over.

Download the Reports
- Once the report is successfully initiated, The report status will change to “In progress” on the Generated Reports page as shown below.

- As soon as the report is ready, the “In Progress” status is changed to “Completed,” as displayed below. In the Actions column, the download icon (
 ) will now be enabled.
Click this to start downloading the report.

Resend the Reports
If you missed the report in your email or wish to resend it to additional recipients, follow the below steps to resend the report.
1. Click the resend icon (![]() ) on the Generated Reports page, as shown below.
) on the Generated Reports page, as shown below.
 2. In the Email Address(es) box, enter the email addresses.
For multiple recipients, enter the email addresses separated by a comma (,) and then click Send.

3. Once the email is sent successfully, the message “Select Report(s) sent over email successfully” is displayed.

Delete the Reports
If a report is no longer needed or if you wish to re-launch the same report, you can delete it. The steps below will show you how to remove a previously generated report.
- On the Generated Reports page, you can delete a specific report by selecting the delete icon (
 ) in the Actions column.

- A confirmation window asking “Are you sure to delete selected report(s)?” will appear as shown below.
Select Cancel if you change your mind about deleting the report, or Confirm if you’re ready to delete.

- The message “Successfully deleted selected report” will appear once you confirm the deletion, as shown below.

Details of Reports
Brief information on the reports is provided below.
Heal Configuration: This report details the configuration modifications made by the user. It provides the instance and service-level status of completed operations.
It includes the name of the Application, the Service, the Instance, the User, and the last modification time. If the modifications were made at the service level, the Instance reflects NA.
For example: The generated HEAL Configuration report is as below.
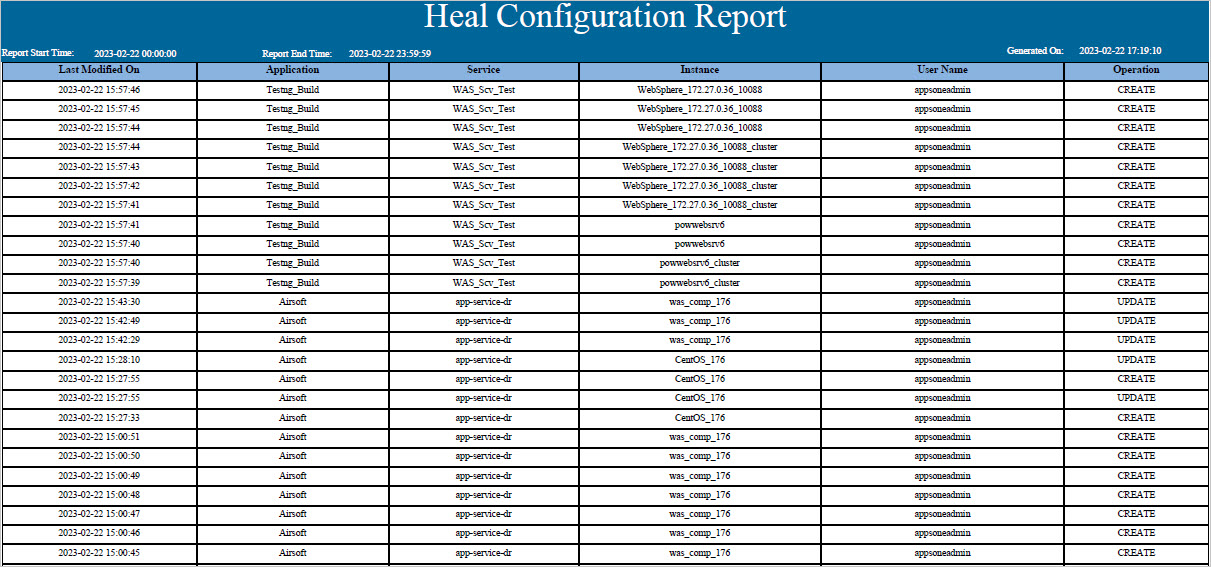
HEAL Configuration Report
Heal User Activity: This report details the login, logout, and password changes made by users apart from appsoneadmin. This report contains the username, status, last modification time, and last login time, as well as the action taken.
For example: The generated HEAL User Activity report is as below.
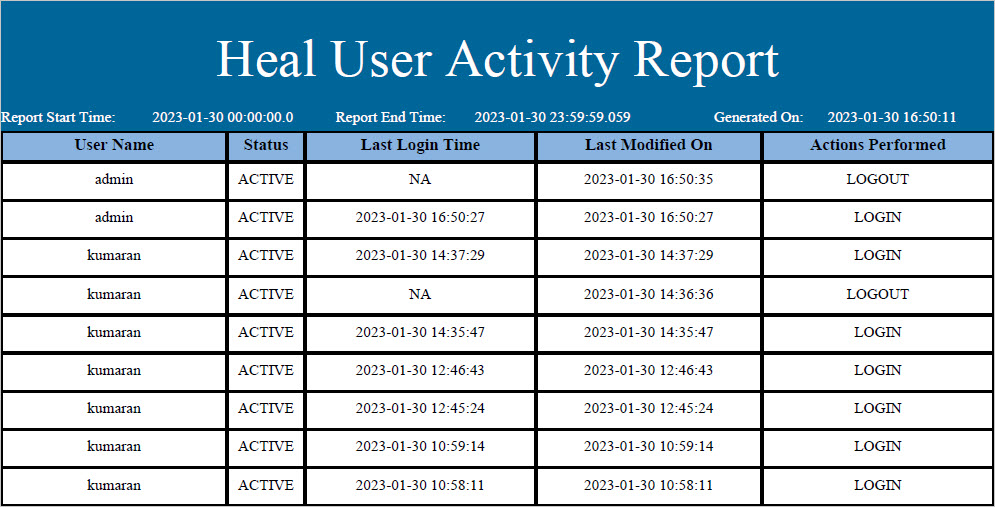
Heal User Activity Report
Heal User Details: This report includes the username, email address, contact number (if available), last login time, last modification time, and applications mapped to an active user.
For example: The generated HEAL User Details report is as below.
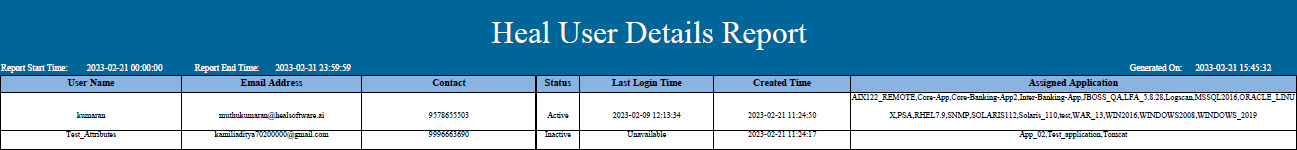
HEAL User Details Report
Collection Interval Audit: This report details the changes to the KPI collection interval at the instance level. It includes the service name, KPI name, App name, instance name, last modification time, new collection and old collection interval, the action performed, and user name.
For example: The generated Collection Interval Audit report is as below.
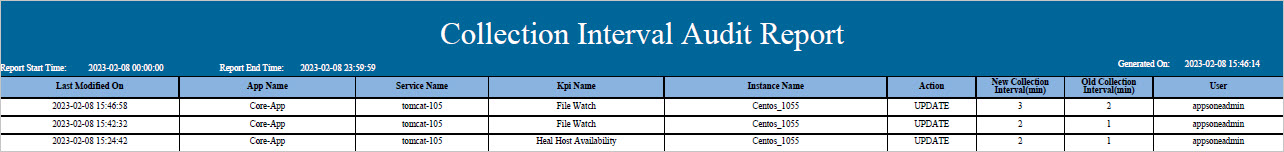
Collection Interval Audit Report
Threshold Change: This report details changes to KPI thresholds at the instance level. It contains the layer (component), instance name, KPI name, KPI attribute (if available), last modified time, old threshold, and new threshold value, along with the operation symbol.
For example: The generated Threshold Change report is as below.
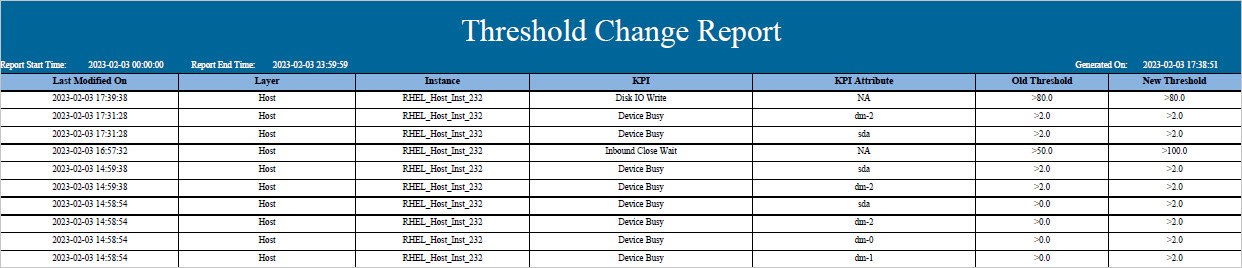
Threshold Change Report
Application Health Minutely: It provides minute-wise details of selected KPIs at the instance level for the collected data except for ConfigWatch and FileWatch KPIs. The report details the type of Component, Layer, Instance, Host Address, KPI Name, Attribute Name, KPI Unit, and Value.
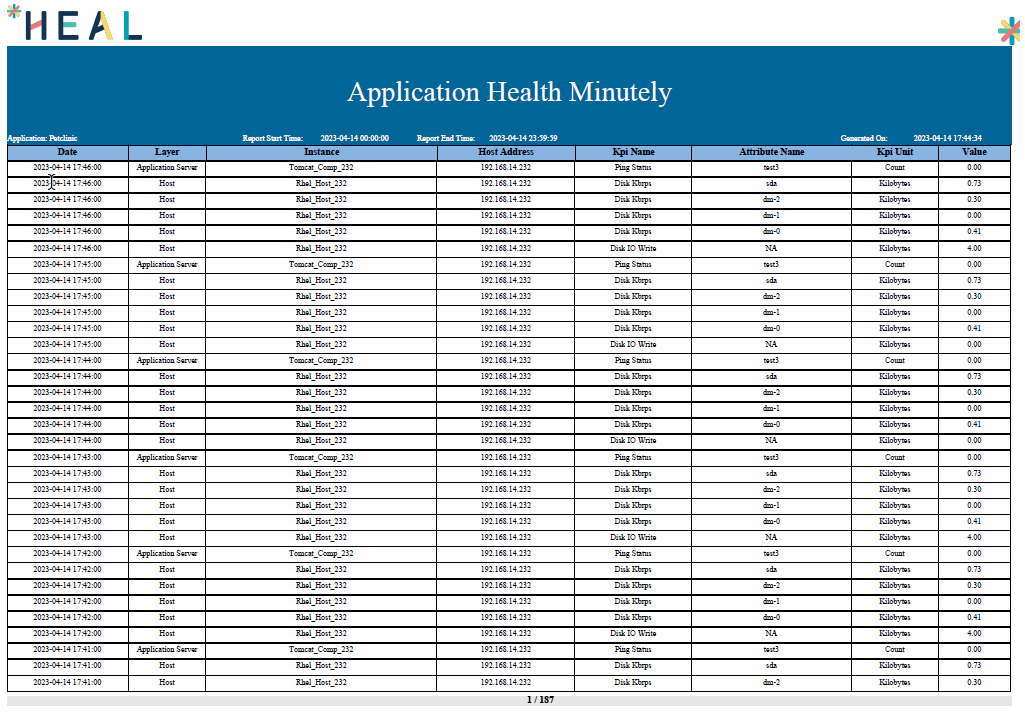
Application Health Minutely
Alert Analysis Summary: This report details the instance-level data for a given KPI at the time of the event. The report details KPIs, KPI Attributes, KPI type, Alert Type, Breach Value, Collection Interval, Threshold Type, Threshold Severity, Persistence, Suppression, Anomaly start time, Anomaly End time, Anomaly Id, and Signal Ids.
For example: The generated Alert Analysis Summary report is as below.
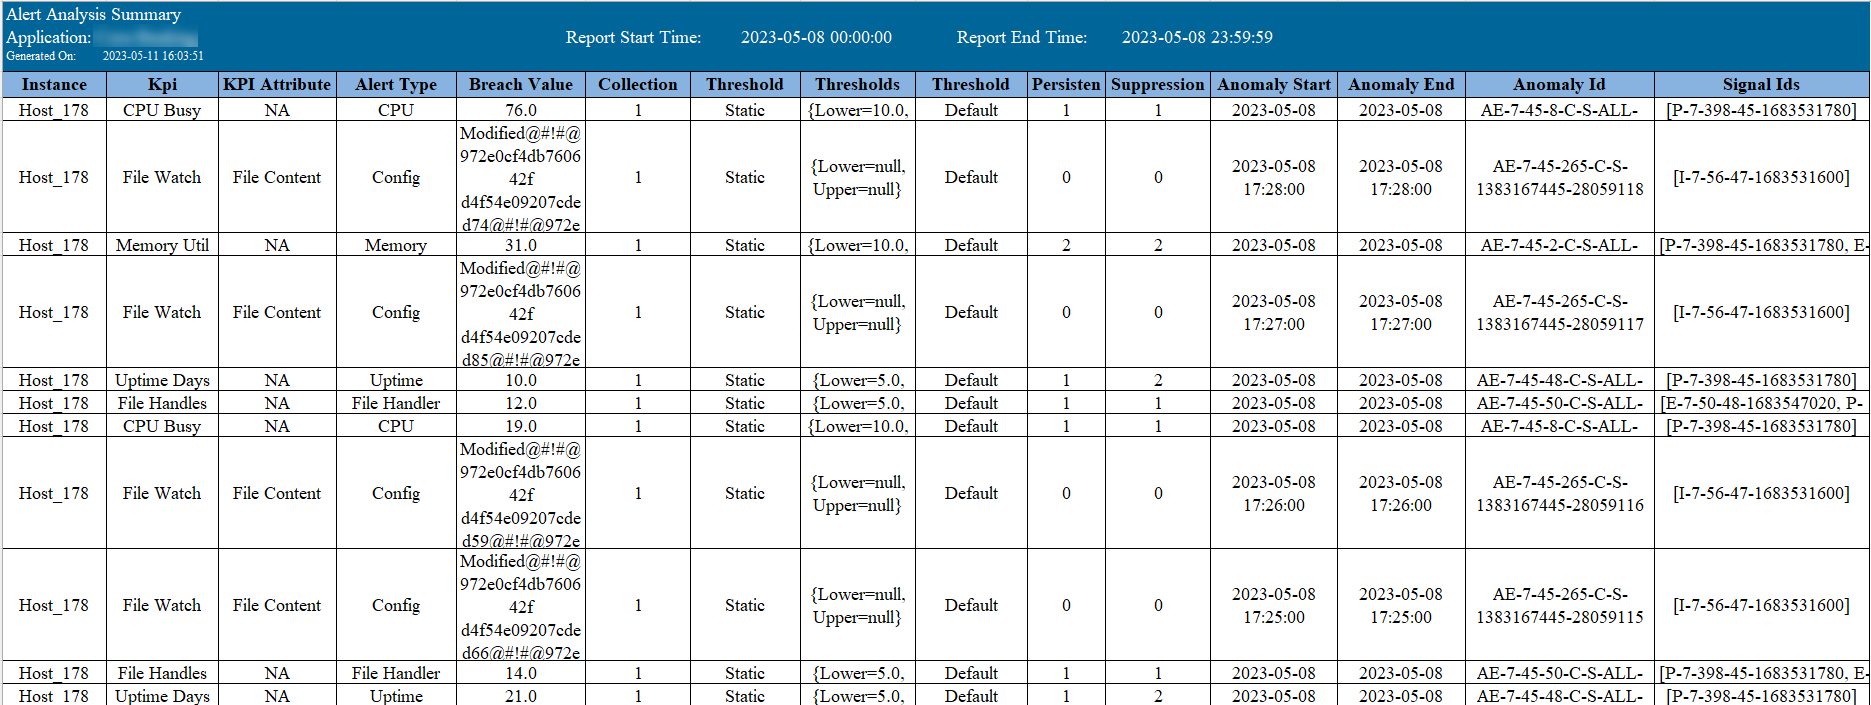
Alert Analysis Summary
Data Collection With Error Codes: This report provides a list of selected KPIs mapped to the application. If an error code is available for a KPI without data collection, it is displayed alongside a description. The report details the Service, Instance, Host address, KPI category, KPI, KPI Status, Last Data Collected, Error Code and Error Description.
For example: The generated Data Collection With Error Codes report is as below.
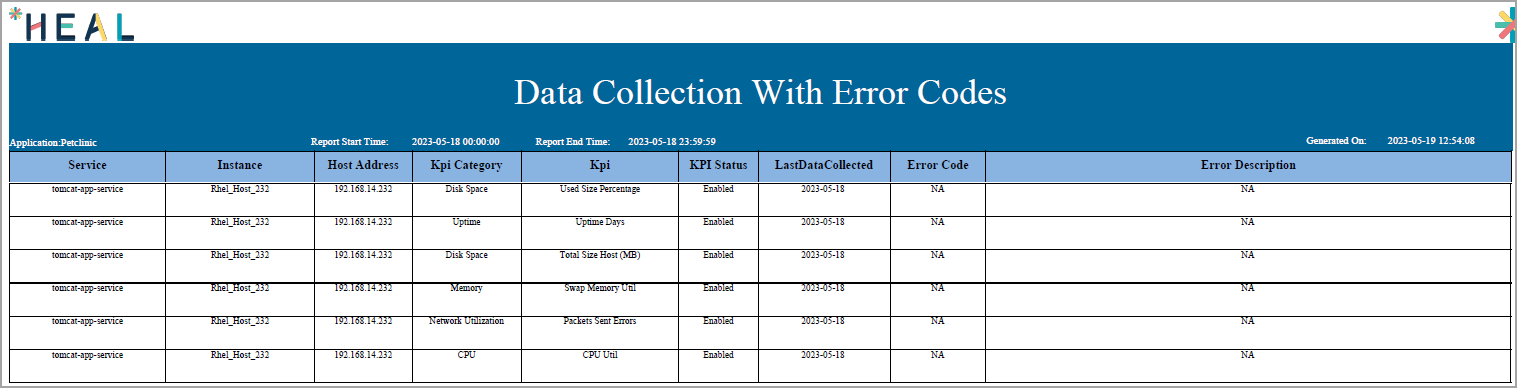
Data Collection With Error Codes
Heal Host Utilization Daily: The key performance indicators (KPIs) for host utilization are detailed in this report. These KPIs include CPU UTIL, MEM UTIL, SWAP MEM UTIL, LOAD AVG, and Uptime Days. The report details the Instance, Host Address, minimum, maximum, average, and 90th and 95th percentile values for each KPI (i.e., CPU UTIL, MEM UTIL, SWAP MEM UTIL, and LOAD AVG), UPTIME DAYS and Anomalies. The number of instances with anomalies is also reported.
For example: The generated HEAL Host Utilization Daily report is as below.
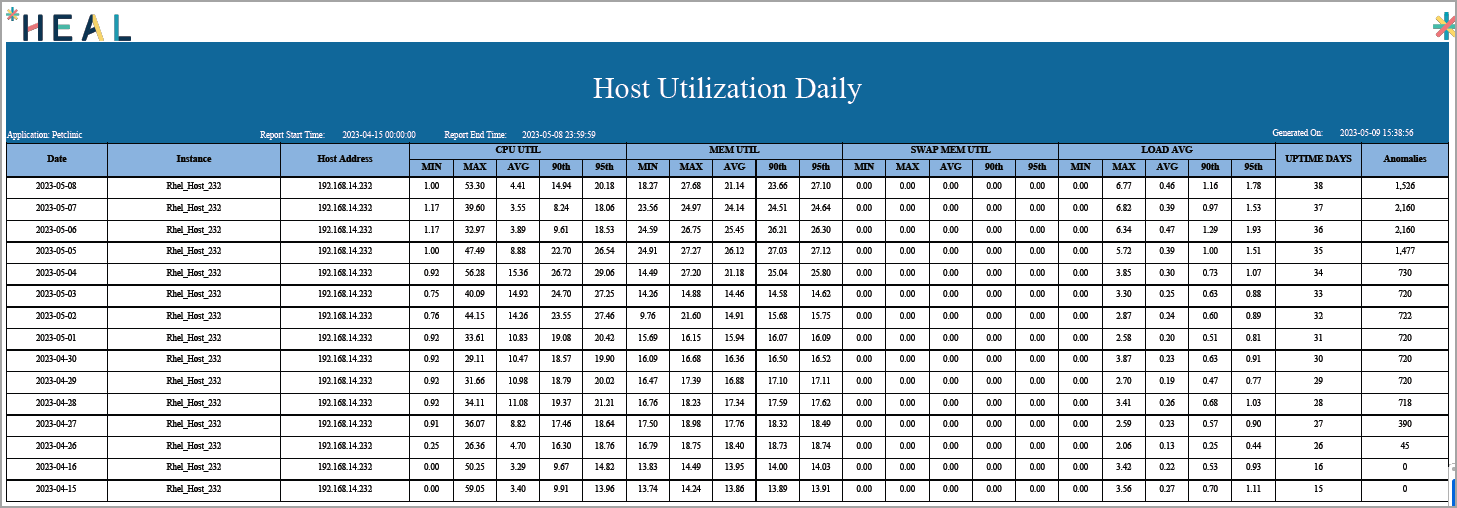
HEAL Host Utilization Daily
Application Health Daily Summary: It provides a summary of selected KPIs at the instance level for the collected data except for ConfigWatch and FileWatch KPIs. The report details the type of Component, Layer, Instance, Host Address, KPI, KPI Type, Minimum value, Maximum value, Average value, and KPI Anomalies.
For example: The generated Application Health Daily Summary report is as below.
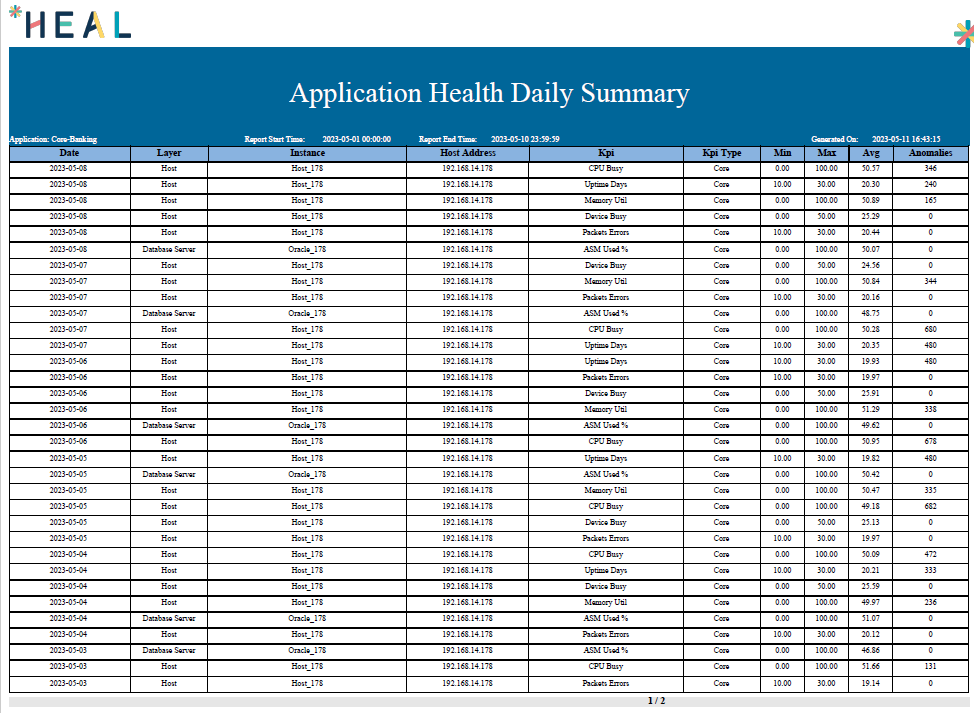
Application Health Daily Summary
Asm Diskspace Utilisation Summary: It specifies the summary of the most recently collected data for the ASM group KPIs, including ASM Used Percentage (%) and ASM Total Size (GB), at the instance level. It displays data at the attribute level. The report details Instance, Host address, Partition, Total Size (GB) and Used Percentage(%).
For example: The generated Asm Diskspace Utilisation report is as below.
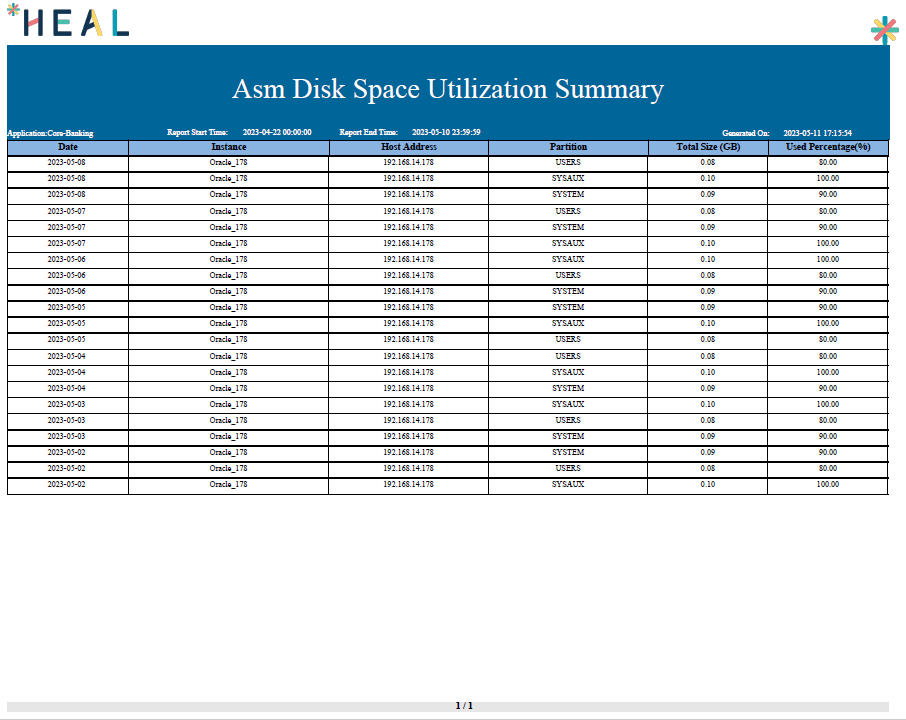
Asm Disk Space Utilization Summary
Capacity Utilisation Summary Trend: This report details the capacity utilization of KPIs such as CPU UTIL, MEM UTIL, SWAP MEM UTIL, and LOAD AVG. The report will include minimum, maximum, average, and 90th and 95th percentile values for each KPI.
For example: The generated Capacity Utilisation Summary Trend report is as below.
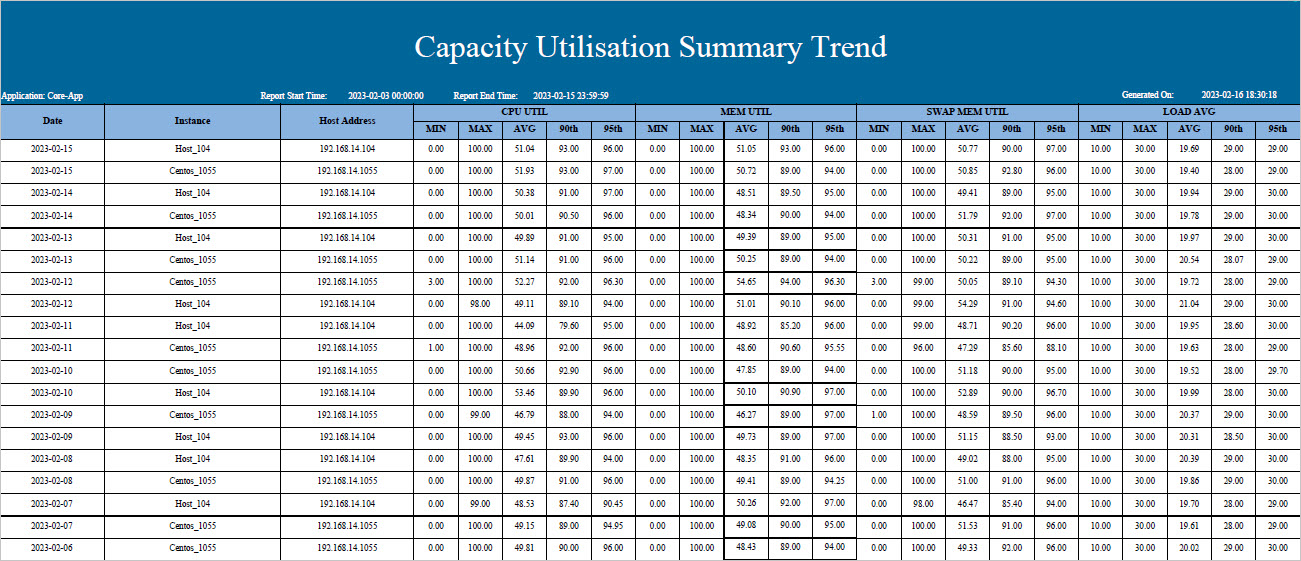
Capacity Utilisation Summary Trend
Oracle Tablespace Utilisation Summary: It provides a summary of the most recent data collected for Oracle Tablespace group KPIs, such as Instance, Host Address, Partition, Tablespace used percentage (%) and Tablespace total size (GB), at the instance level. It displays data at the attribute level.
For example: The generated Oracle Tablespace Utilisation Summary report is as below.
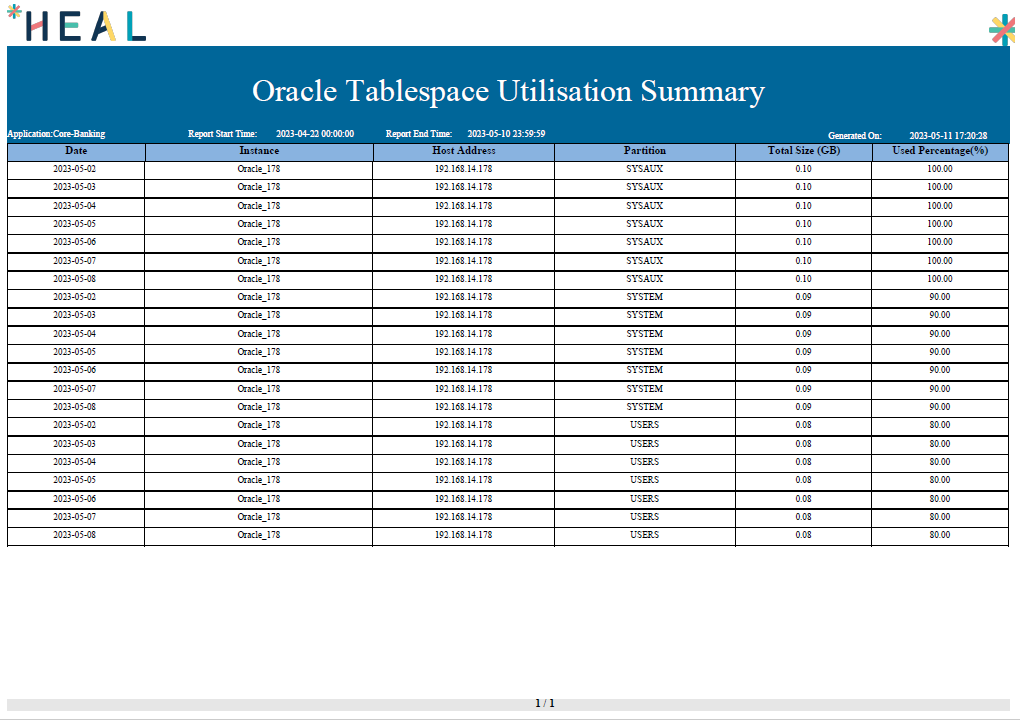
Oracle Tablespace Utilisation Summary
Server Diskspace Utilisation Daily Summary: It provides a summary of the most recently collected data for server disk space KPIs, such as Total size(GB), Available size(GB), and used size(GB), as well as Used Percentage KPIs(%). It displays the attribute-level data.
For example: The generated Server Diskspace Utilisation Daily Summary report is as below.
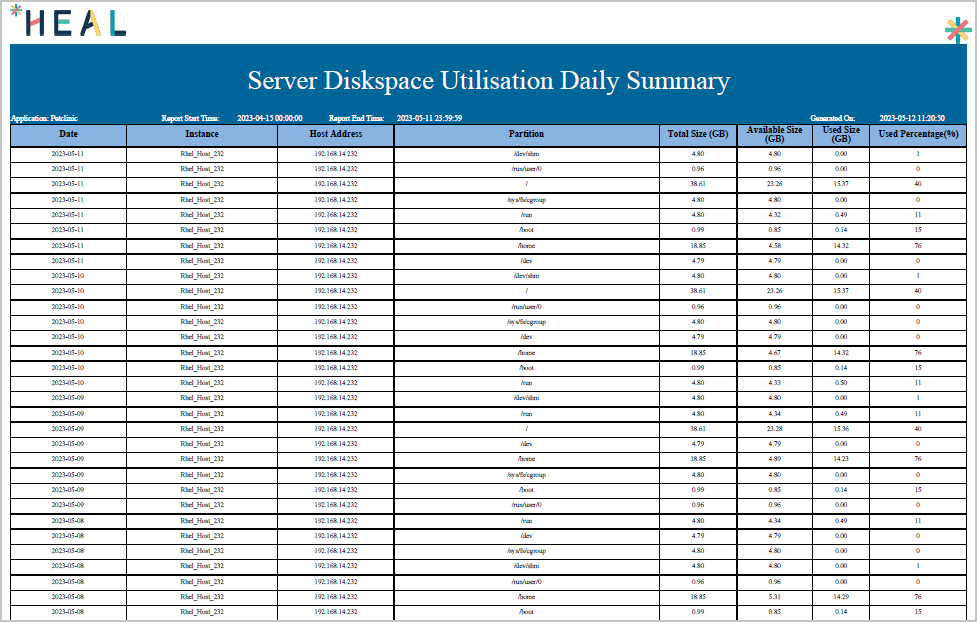
Server Diskspace Utilization Daily Summary
Transaction TPS: It provides a summary of the individual transactions, including Volume, Success, Failure, Slow, and Average Response KPI data. In addition, it contains the success, failure, and Slow percentages, the 90th and 95th percentile values of the average response, the Max TPS time, and the Max TPS value. It also includes the total number of Anomalies for each transaction.
For example: The generated Transaction TPS report is as below.
Transaction TPS
Daily Data Collection Report: The Daily Data Collection Report covers host, component, and JIM instance data availability for the last N days (N – based on OpenSearch ISM policies). The report details the type of Component, Total Count, Data Collected Count and Data Not Collected Count for an account.
- For JIM:
– The total count includes all JIM instances.
– Instances with available transaction data in OpenSearch for the day are counted as the collected count.
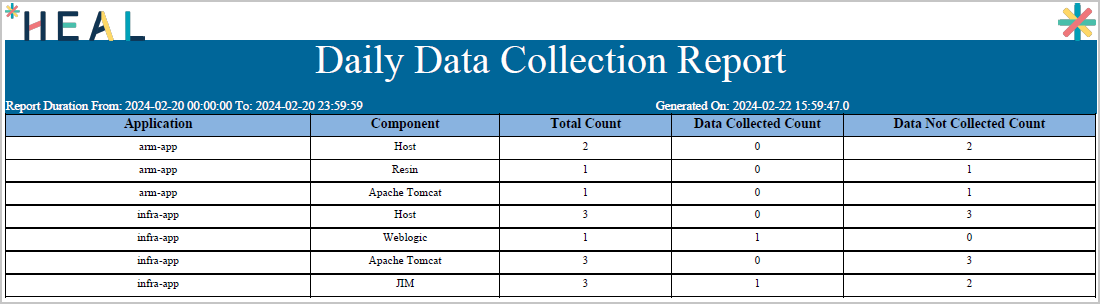
Daily Data Collection Report