How Can We Help?
The Services tab provides a clear and easily visible overview of the health and ongoing signals of various configured applications across customer environments, spanning monolithic or cloud-native architectures, to quickly identify and address potential issues. Within the Services tab, you can:
- Quickly evaluate application health and performance
- Utilize visual indicators to easily identify critical problems, potential issues, and healthy states
- Gain access to in-depth analysis through the Application Health Summary Screen.
Services Navigation
To access HEAL Services, sign in to the HEAL UI and select the Services Tab.
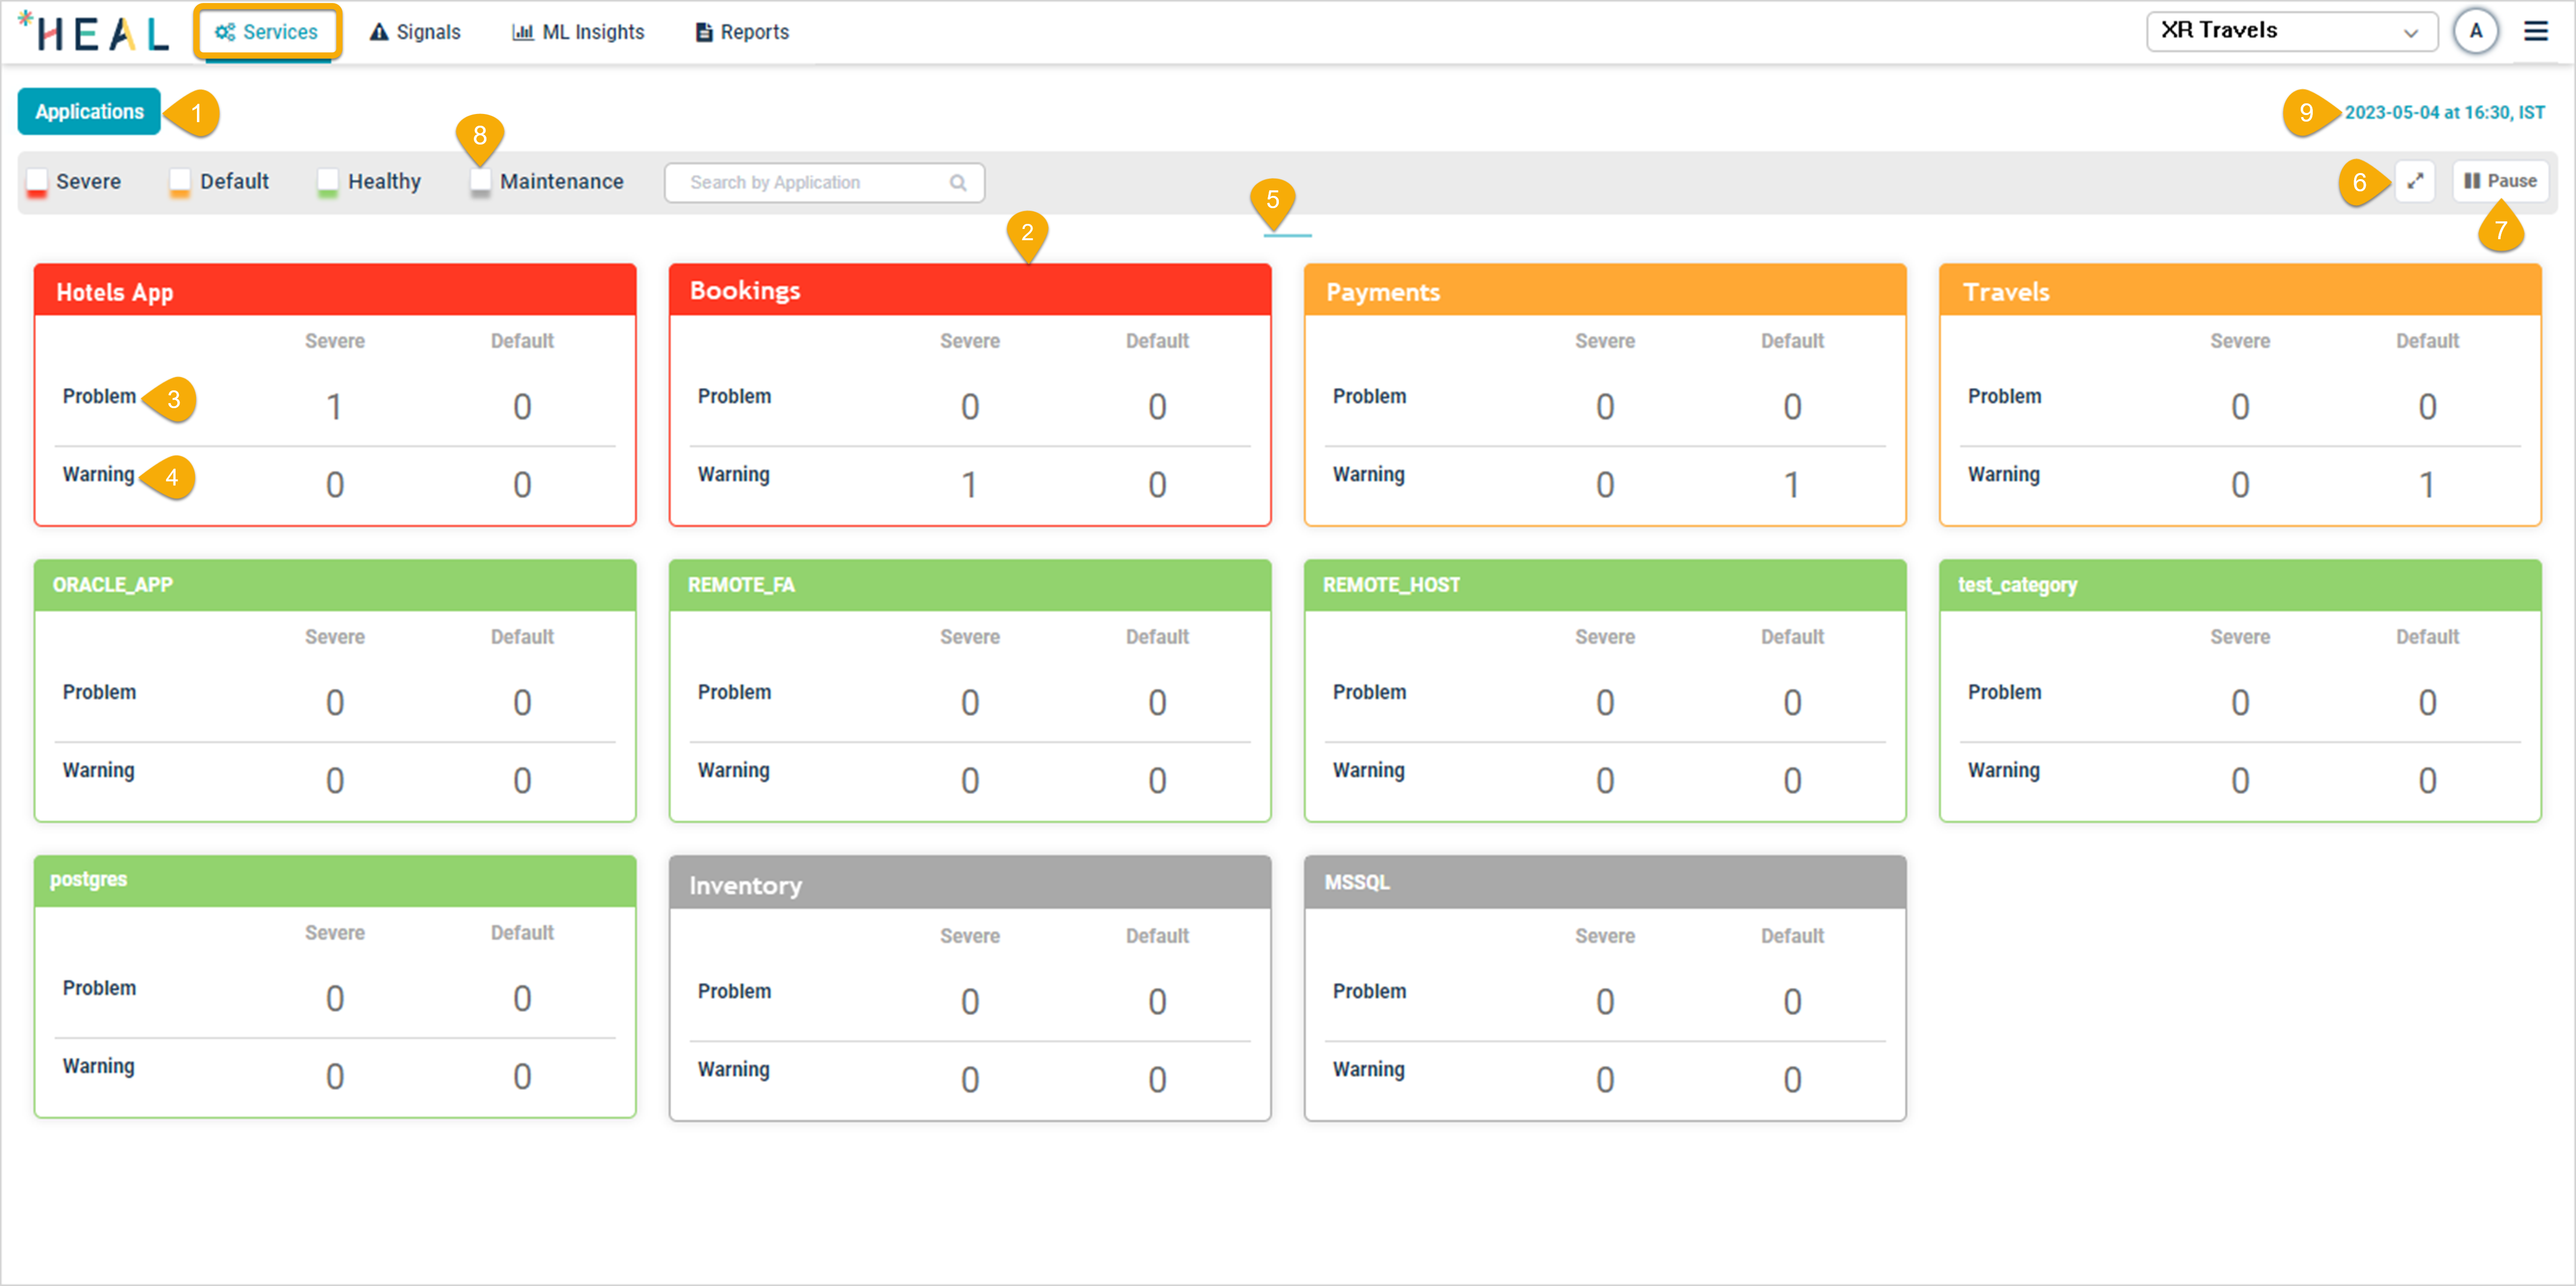
The Services Tab
| Field | Description |
|---|---|
| 1 – Applications | An application consists of a collection of services that are grouped together. To view the Application Health Dashboard, follow these steps:
|
| 2 – Application Pod | An individual application is represented by a pod in the dashboard. Each pod features a top line, the color of which indicates the status of the respective application. The colors and their corresponding meanings are as follows:
Hover over status pods to see the meaning behind each status. |
| 3 – Problem | The dashboard presents a visual indication of the presence or absence of signals in an application. It also displays the counts of active Severe and Default problems for each application. To access more detailed information, click anywhere within the application’s block. This click navigates to the Application Health Summary Screen, where users can further examine the health and performance of the chosen application. |
| 4 – Warning | This feature displays the number of active Severe and Default warnings associated with an application. To access the Application Health Summary Screen for a specific application, click any part of the corresponding block. |
| 5 – Horizontal Scrolling | To scroll the screen horizontally, click and drag along the lines within the content area. This allows for easy navigation and viewing of information that extends beyond the visible screen width. |
| 6 – Full Screen Mode | Click the icon to enter full screen mode, providing an expanded view of the content. To return to normal mode, press the ‘Esc’ key on your keyboard while in full screen mode. |
| 7 – Pause/Play | Applications are displayed in a carousel format, with twelve applications shown per page. This icon allows you to toggle between Play and Pause. Click Play to initiate the automatic rotation of applications in the carousel. The rotation will continue until you select Pause. |
| 8 – Application Status Filter | To view applications based on their status, simply click on the status box. This will filter and display only the applications with the selected status. |
| 9 – Just-In-Time Snapshot | The snapshot time, displayed on the screen, represents the exact moment when the data was captured. |
Next Steps
Learn about Application Summary. Click inside an application pod to access the Application Summary screen for a specific application.