How Can We Help?
MLE automatically identifies the high-impact or most important metrics for an account and an application using AI. Using ML models, MLE finds out the variability of the individual metrics and also the correlation of these metrics with the problems.
You get to know the most important metrics as well as the events and problem counts associated with those metrics. MLE fetches the data from Cassandra tables and saves the results in CSV format.
MLE calculates important metrics using relevance score. MLE calculates relevance scores using impact and significance scores. Relevance score is a combination of impact and significance scores.
The impact score of a metric indicates the likelihood (or conditional probability) of the respective metric to cause a problem signal, given that MLE observes a violation in the metric value.
Significance score on the other hand indicates the frequency with which variations in the metric values cause an event.
MLE normalizes both impact and significance scores in the range of 0 and 1 (with 0 being the least important and 1 being the most important). MLE calculates both these scores from historical data of the past 30 days.
If Impact Score > 0, then Relevance Score = 1 + Impact score else Relevance Score = Significance Score
HEAL displays the most important metrics in a graphical way when you select ML Insights at the top.
MLE sorts the services and instances in the descending order of the relevance score. ML Insights dashboard displays the service with the highest relevance score first in the Service drop-down. When you select any service, the ML Insights dashboard displays the instance with the highest relevance score first in the Instances drop-down.
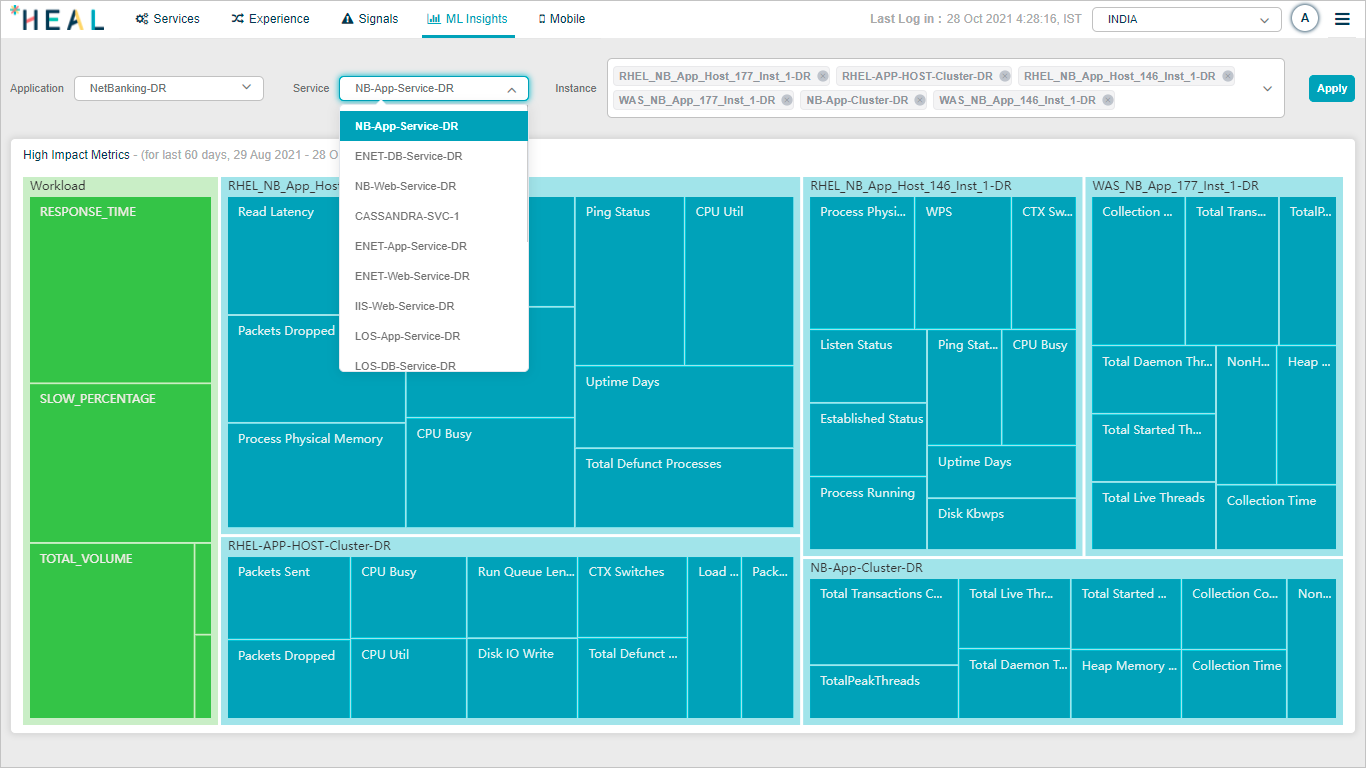
ML Insights_Service
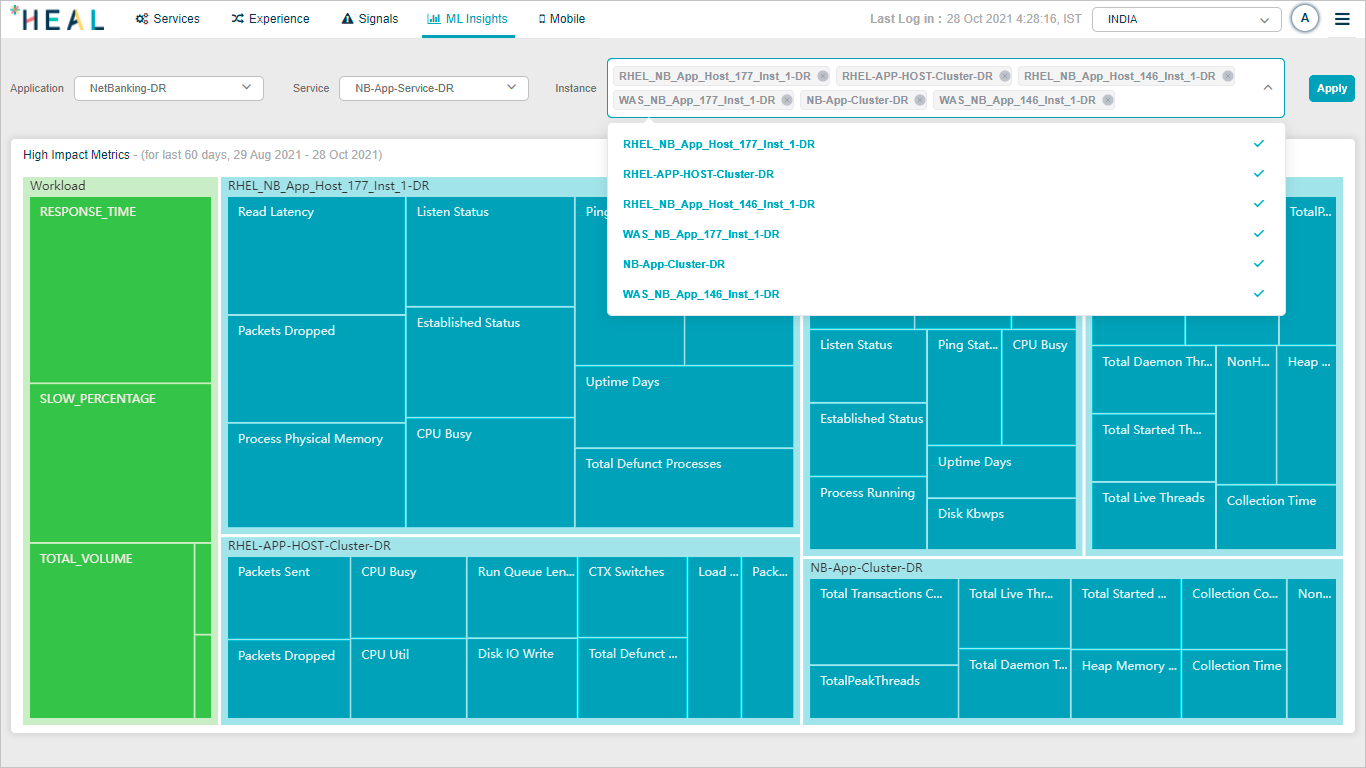
ML Insights_Instance
Select the application, service belonging to that application, instance(s) belonging to the service.
Select Apply.
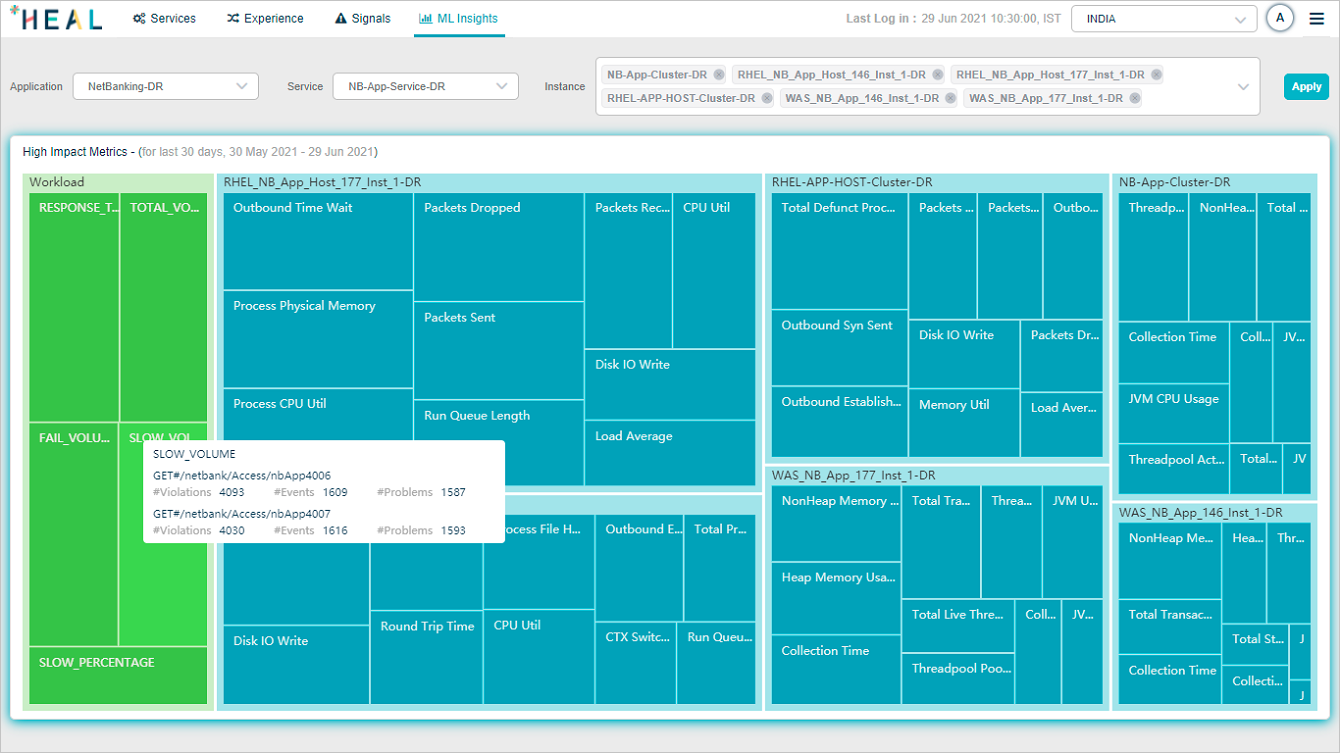
HEAL displays top 10 most important metrics related to the instances you select. HEAL displays one instance as one pod. HEAL displays top 10 behavioral metrics related to every instance separately. HEAL also displays top 10 Workload metrics.
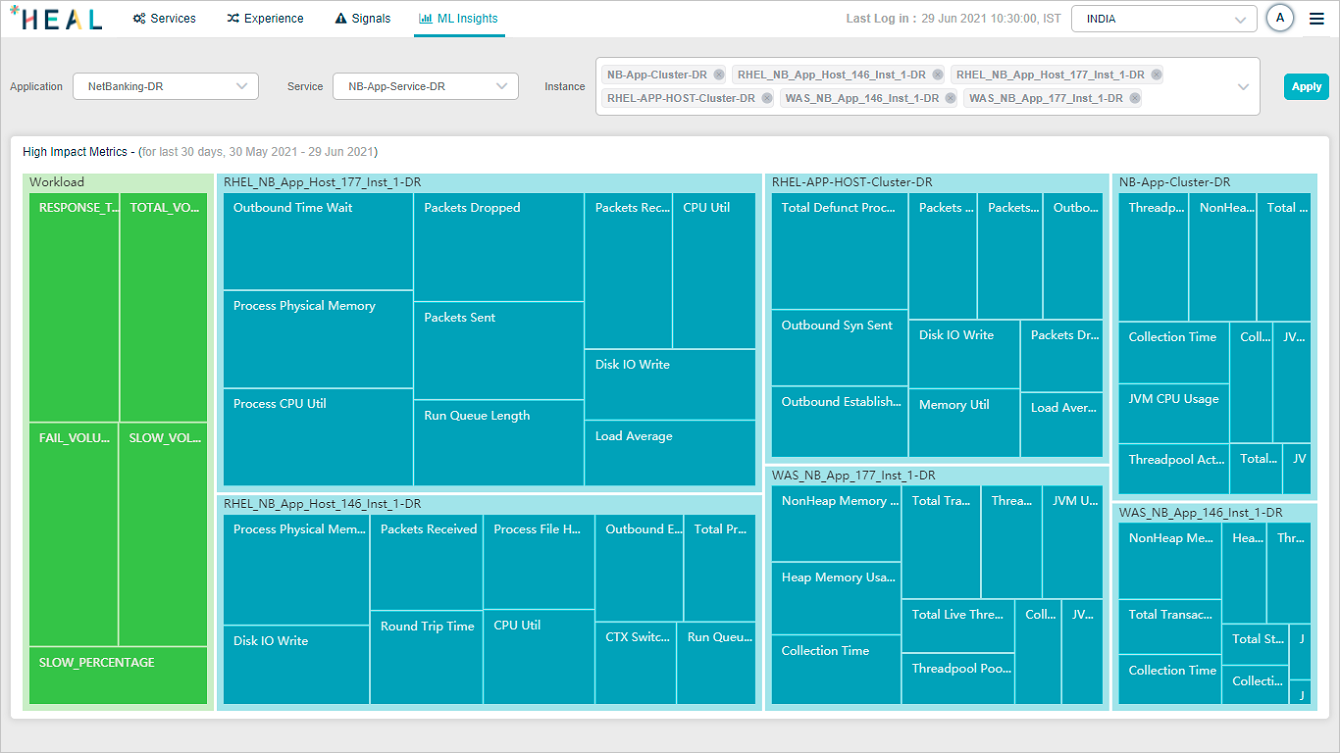
ML Insights
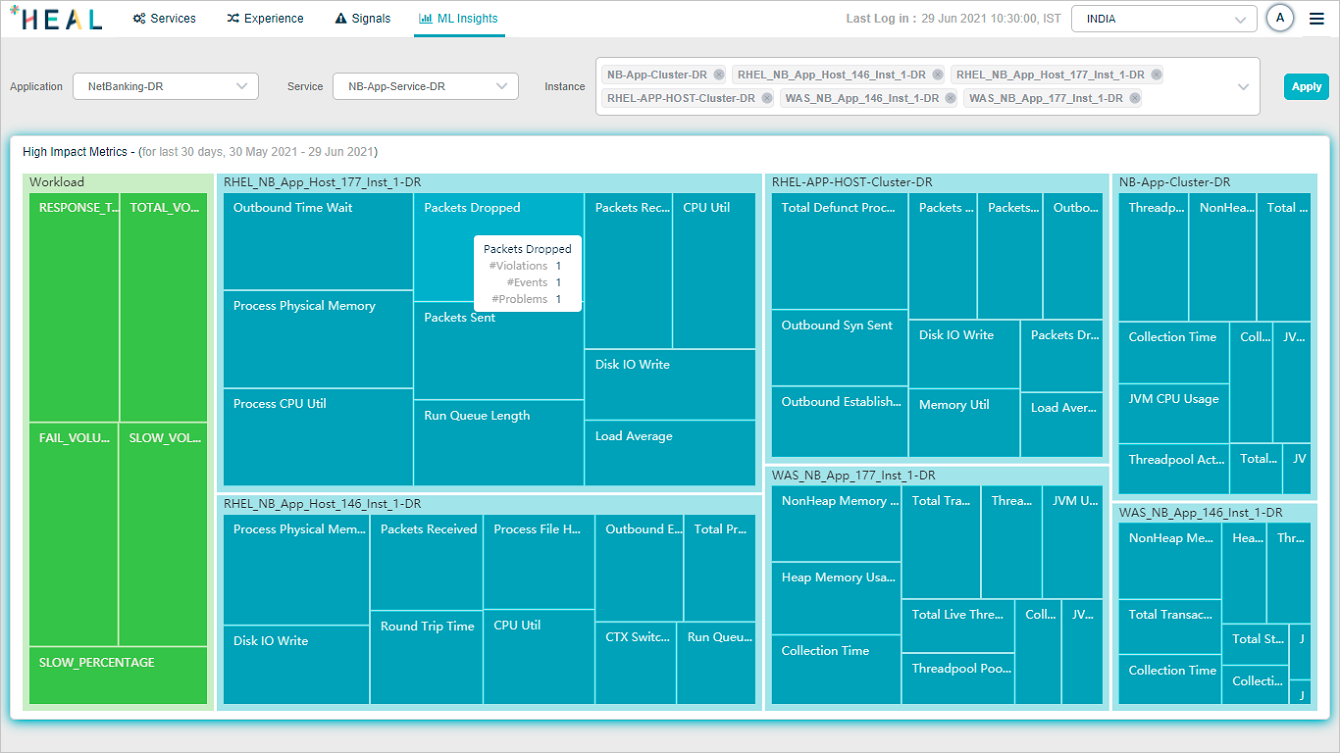
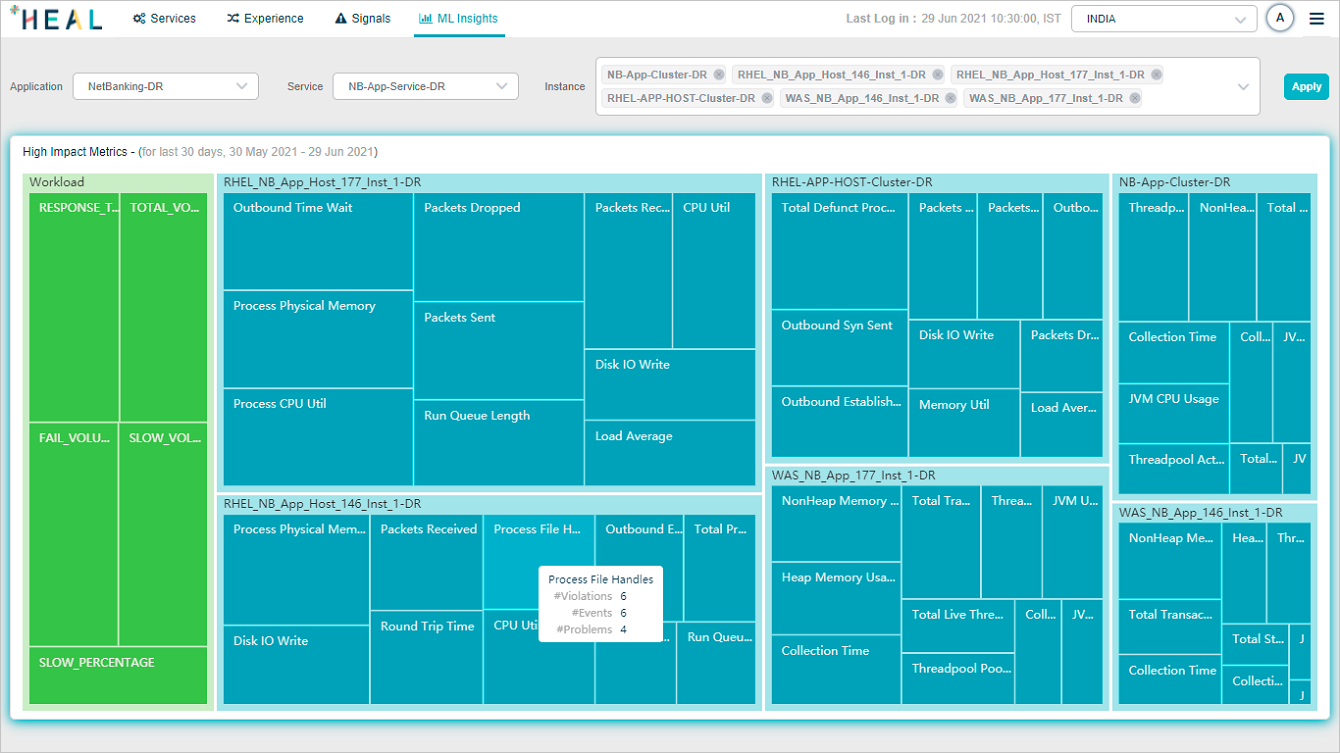
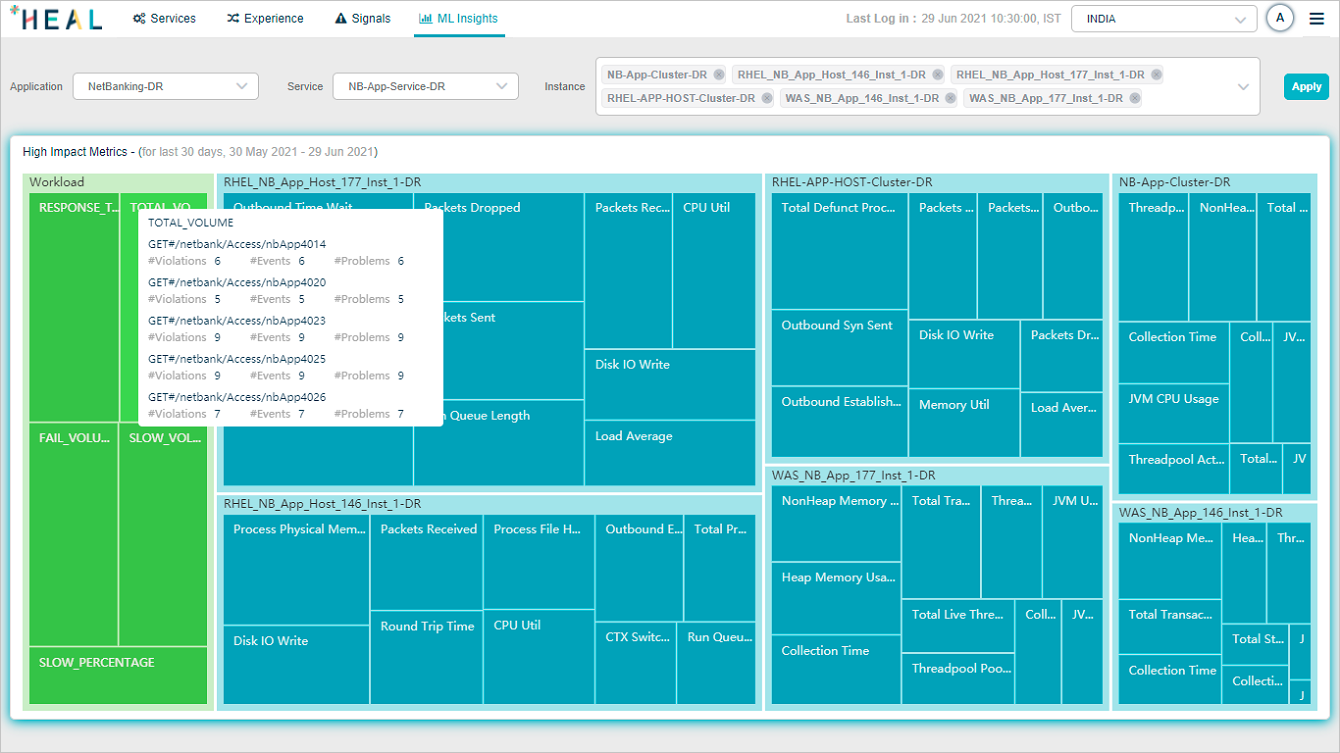
Hover on a specific metric section to view the details about it.
Workload Metrics
Total Volume: This displays top five success transactions which have high impacted value.
Response Time: This displays top five transactions with highest response time and impacted value.
Failed Volume: This displays top five failed transactions which have high impacted value.
Slow Volume: This displays top five slow transactions which have high impacted value.
Slow Percentage: This displays top five transactions with highest slowness percentage and impacted value.
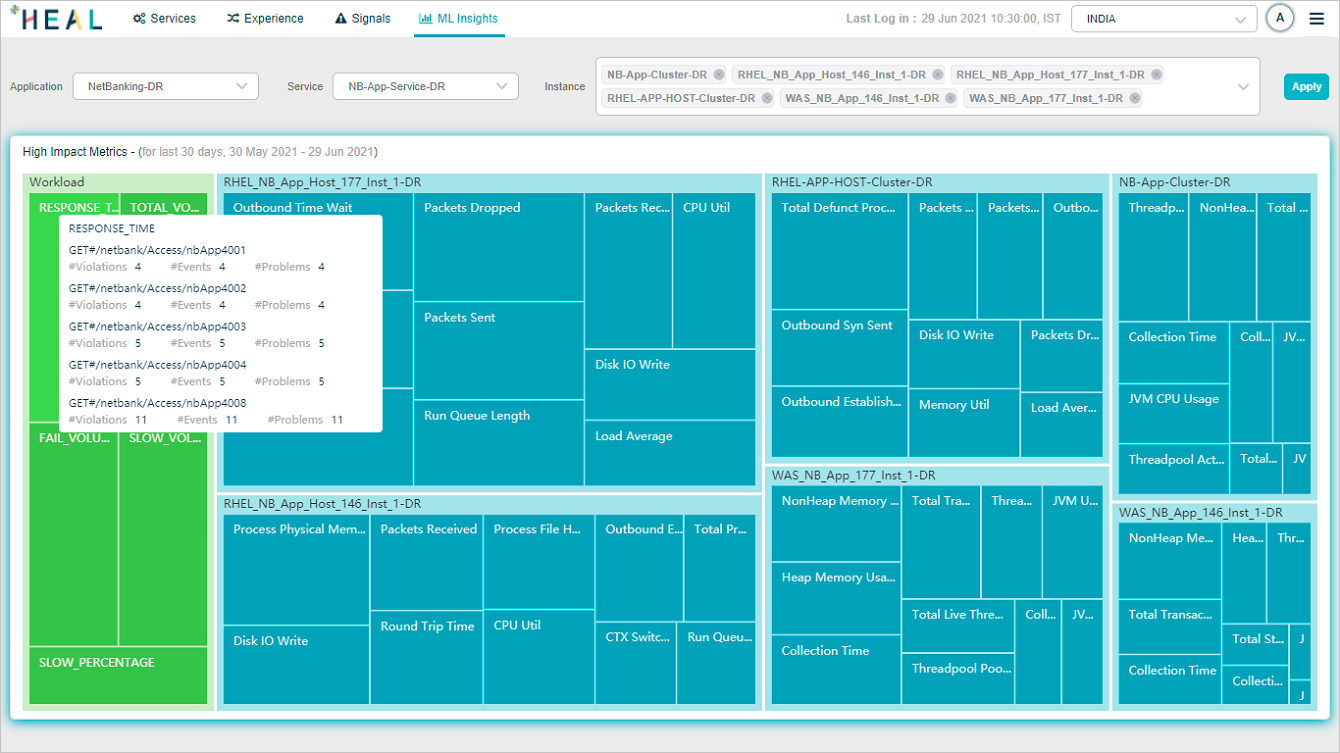
ML Insights_Workload Details
ML Insights_Workload Details
Hover on a behavior metric section in an instance pod to view the number of violations, events, and problems associated with the respective metric.
ML Insights_Instance details
ML Insights_Instance details
ML Insights_Workload details
If there are no high impact metrics for the instances you select, HEAL displays following screen.
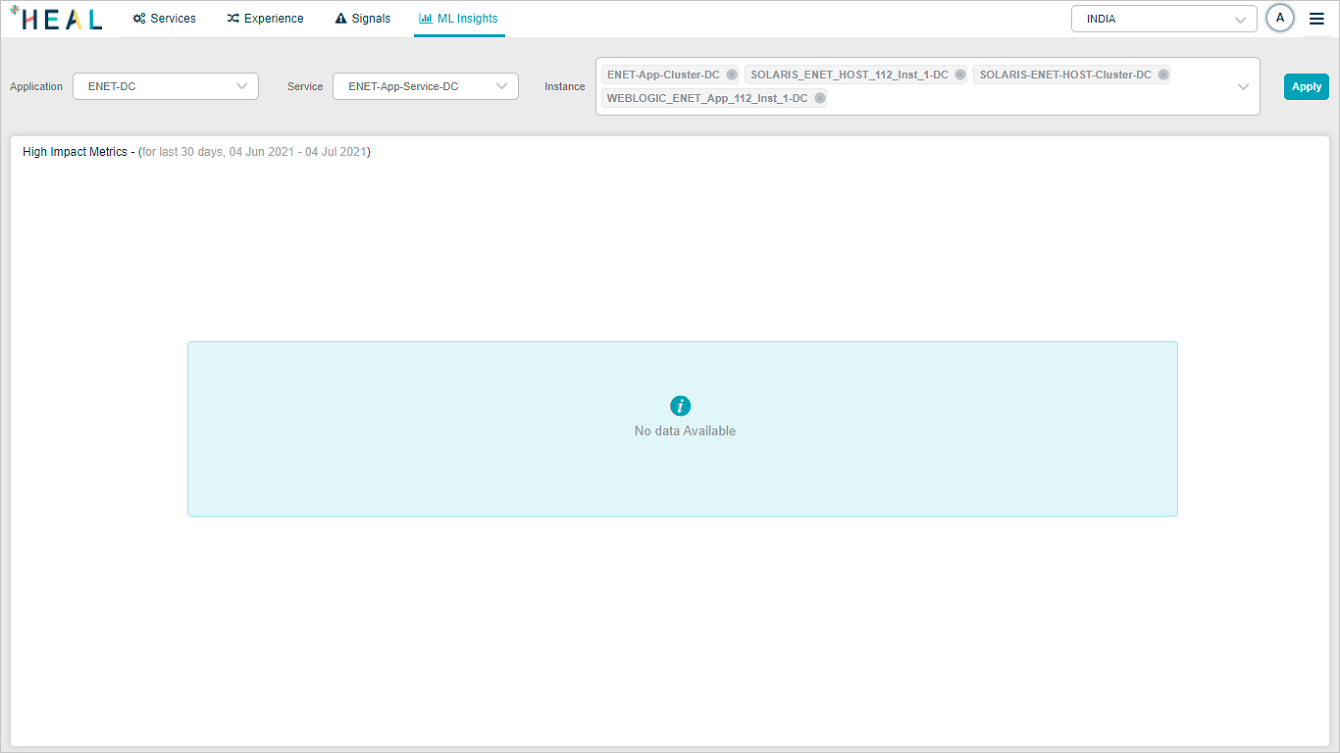
ML Insights