How Can We Help?
Viewing Request Dashboard
The workload is all application activities that cause stress on the underlying components and IT Infrastructure. The workload is all user transactions, the volume, composition, payload therein, business logic, background processes, and read/write activity occurring on the system. HEAL application monitors requests via its workload agents for relevant services. App Owners and NOC or DevOps users need to view the information on these requests to help them understand the requests in detail that the services handle. Different workload agents may be involved in sending data to HEAL. Some may provide more information than others due to the kind of information they can collect. The request dashboard is intended to be a common point in Service Details where you can view overall request performance and even drill down to the version of a specific request if needed. The information for a particular request may have additional data if the agents in the advanced pack are used—for example, Java Agent, and .NET Agent.
Service Details
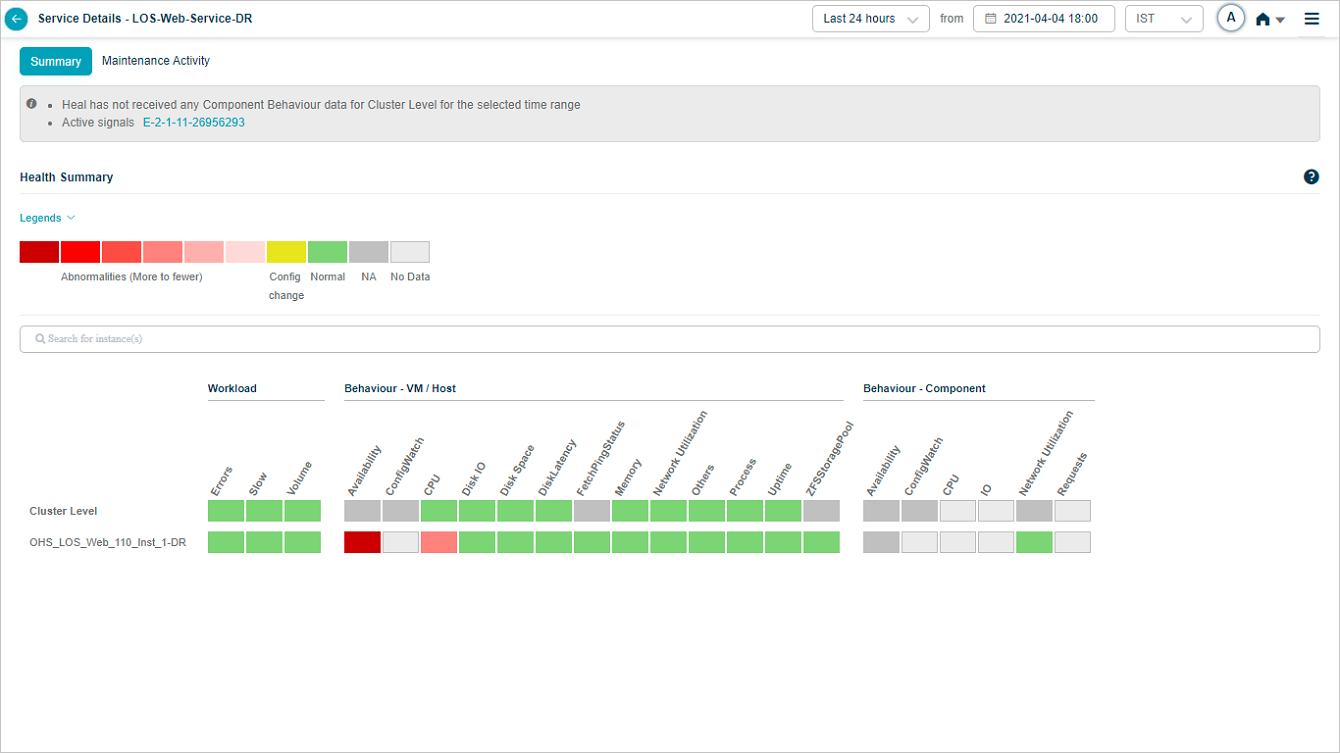
Service Details
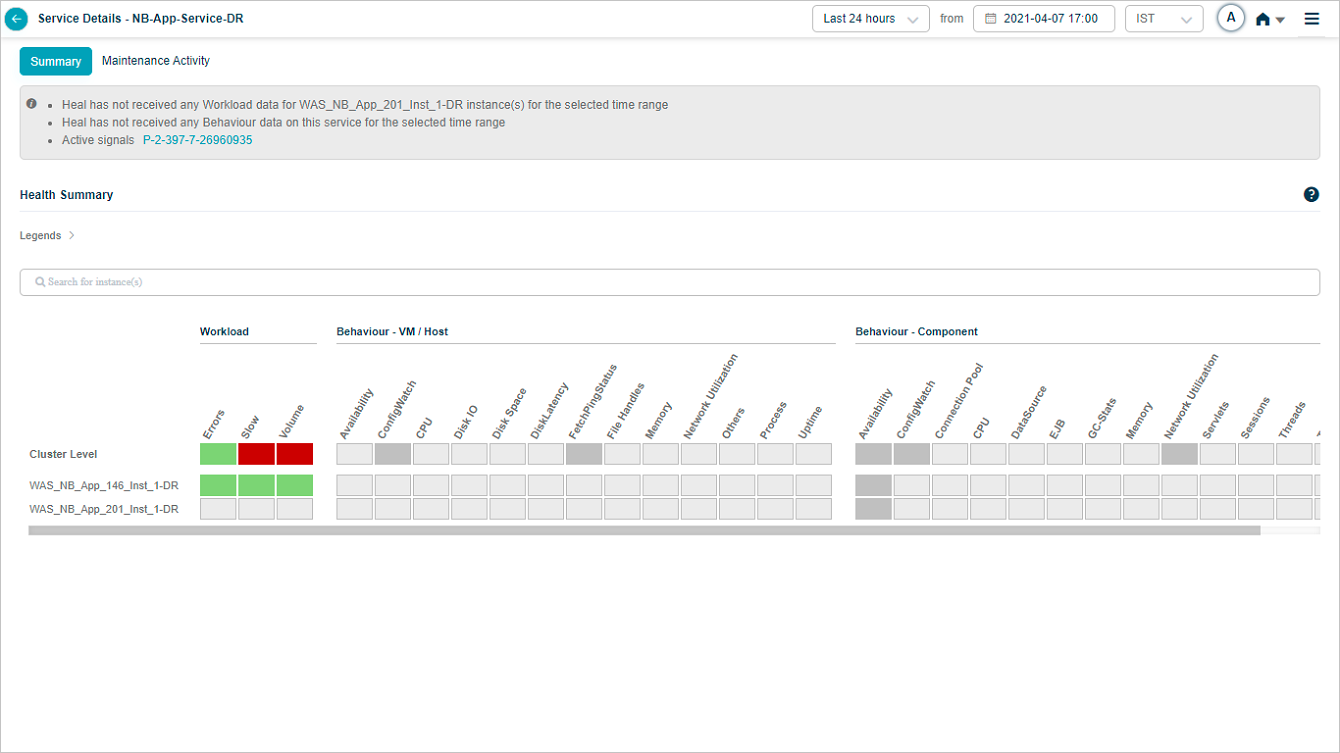
Service Details
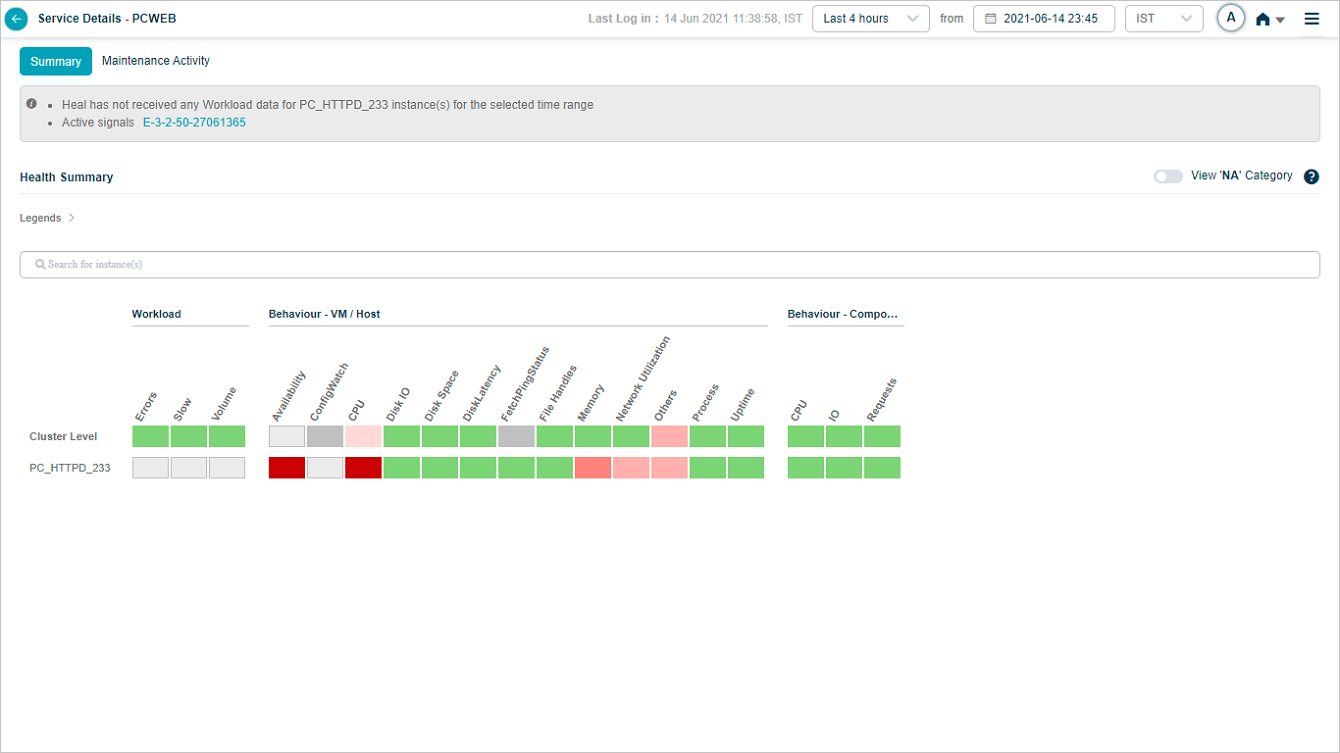
Service Details
Tagging and Grouping
Various workload agents auto-discover requests and there may be a large number of requests listed and monitored in a short span of time. Some requests may be more important than other for you. You may want to look at the important requests and their performance quickly. Certain requests may belong to a specific category. For example, requests related to ATM transactions, requests related to POS transactions. Given an option to tag these requests and using them as filters in workload dashboard, you can quickly view a specific set of requests.
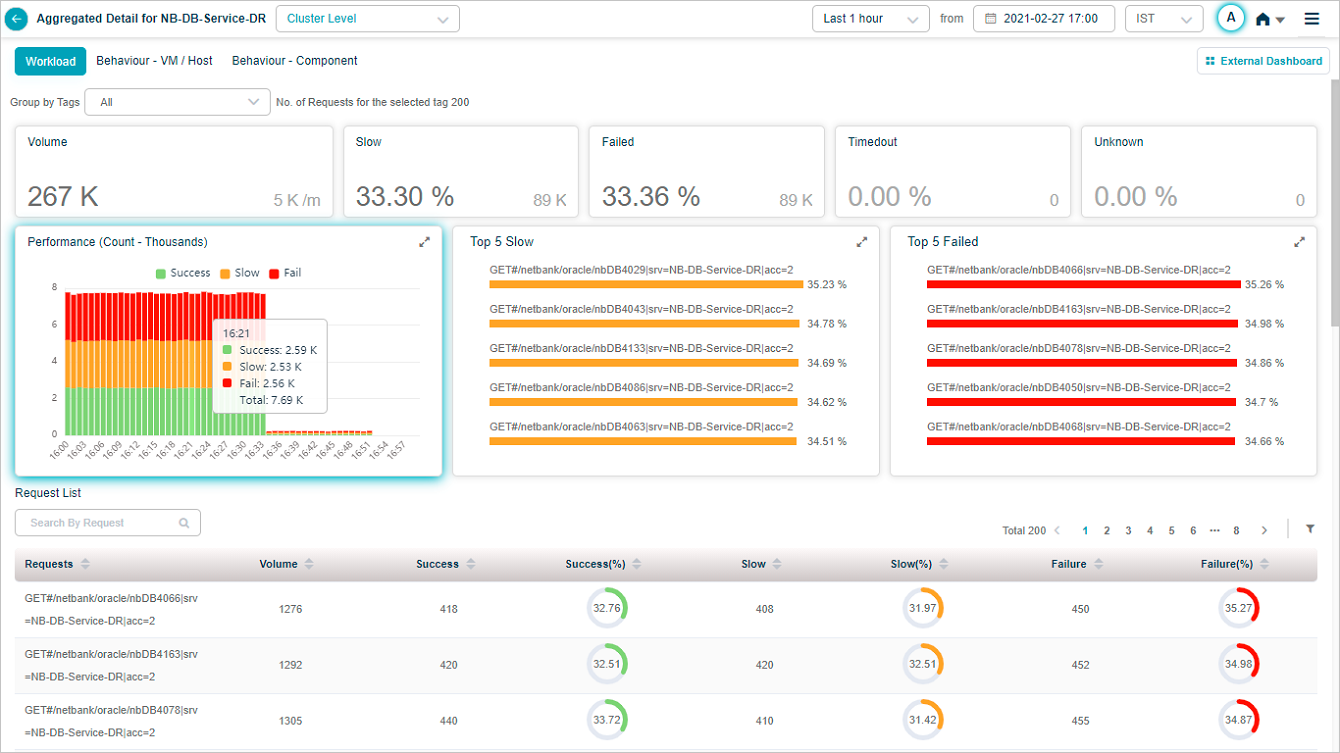
Request Dashboard at Cluster Level
Request Dashboard at Cluster Level appears when you select on any of the workload metrics (Errors, Slow, and Volume) at cluster level in Service Details screen.
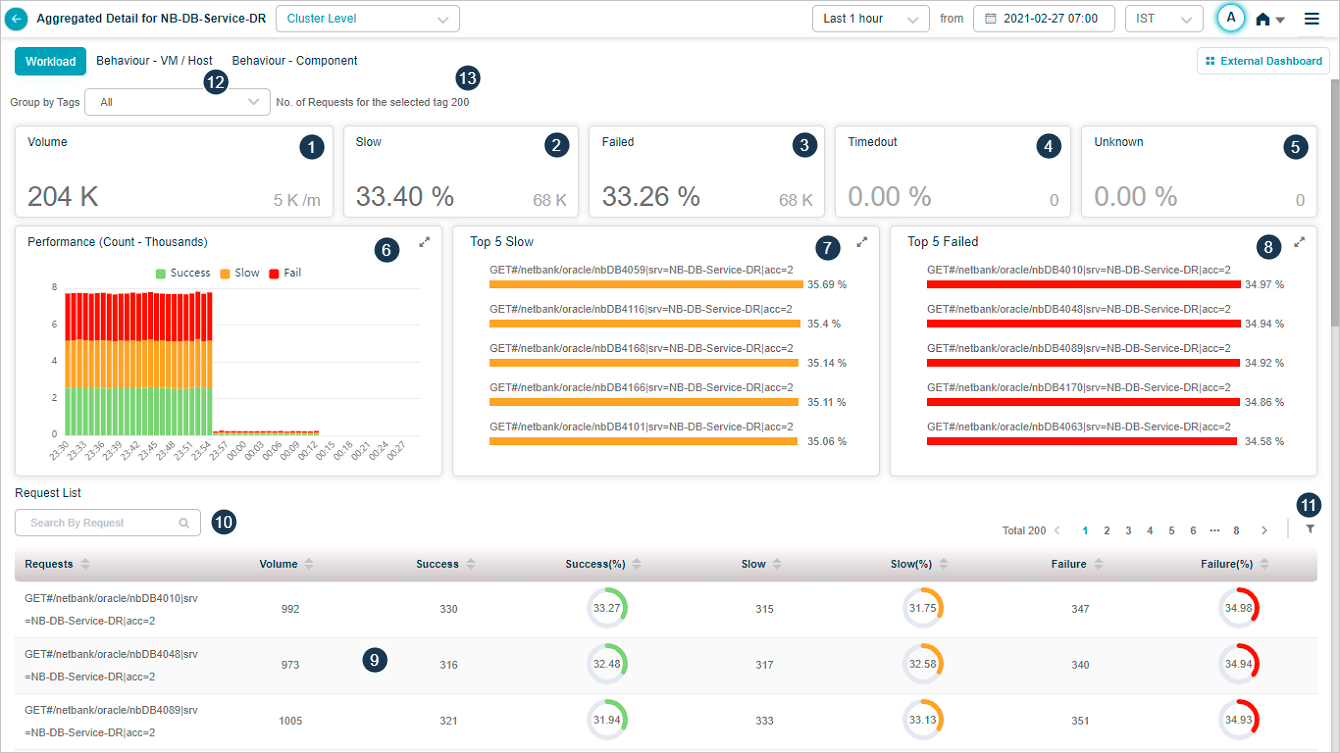
Request Dashboard at Cluster Level
| 1 | Volume displays overall count for inbound requests at a service. It displays trend of the volume. This section also displays the arrival rate of the requests every minute. |
| 2 | This section displays the total number and percentage of slow requests. It displays the Top 5 slow transactions. A transaction may lead to multiple requests internally. Success transactions violating the response time threshold set are considered as Slow. |
| 3 | This section displays total number and percentage of failed requests. Requests with HTTP status code in the range of 4XX to 5xx, transactions with any error or exception are considered as Failed. |
| 4 | This displays total number and percentage of transactions for which response was received after expected response time. Requests are considered as Timed out, when the request session is timed out, request or response is incomplete. |
| 5 | This displays total number and percentage of transactions whose status is unknown. Requests are considered as Unknown, when the request has been initiated but the connection is closed before getting the response. |
| 6 | This section displays performance of the transactions. It displays breakup of the performance for each time segment based on the criteria available for the overall performance numbers. |
| 7 | This section displays Top 5 failed requests. It helps in knowing the requests that are performing badly. It displays Top 5 requests in the descending order of the percentage of requests that have failed. Percentage next to every request indicates the percentage of that particular request which failed. |
| 8 | It displays Top 5 slow requests. It helps in knowing the requests that are performing badly. It displays Top 5 requests in the descending order of the percentage of requests that have slowed down. |
| 9 | This section displays Request List. It displays all the requests monitored in descending order of percentage of failed requests by default. For each request, following details display: Requests: This displays names of all the requests. Volume: This displays the count of inbound requests of this type. Success: This displays the total number of success requests of this type. Success(%): This displays percentage of successful requests of this type. Slow: This displays count of slow requests of this type. Slow(%): This displays percentage of slow requests of this type. Failure: This displays count of failed requests of this type. Failure(%):This displays percentage of failed requests of this type. |
| 10 | You can search for a specific request by its request name or can search for a partial request name. Accordingly requests display post search. |
| 11 | Filter option: You can filter the requests using this option. |
| 12 | Only the list of tags set for the requests in the selected service are displayed in the filter. You can filter the requests based on a selected tag. Default option is ALL. Screen refreshes with the data for requests tagged with the selected tag. |
| 13 | Count of requests per selected tag. |
Hover over a data point in Performance pod to view details as displayed in following screen.
Request Dashboard at Cluster Level
Filtering Requests


You can filter with respect to various fields:
- Total count of requests
- Number or percentage of successful requests
- Number or percentage of failed requests
- Number or percentage of slow requests
You can apply filter options as
- Greater Than
- Less Than
- Equal To
Viewing Details of a Specific Request
You can select a specific request from the request list. This brings up a screen dedicated to this particular request.
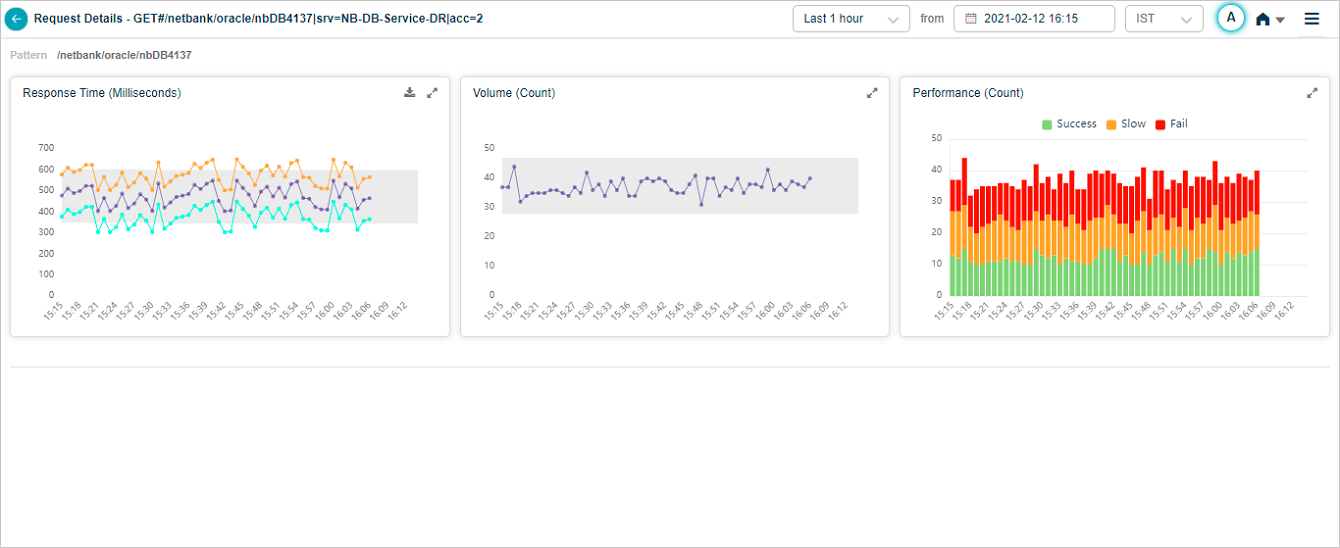
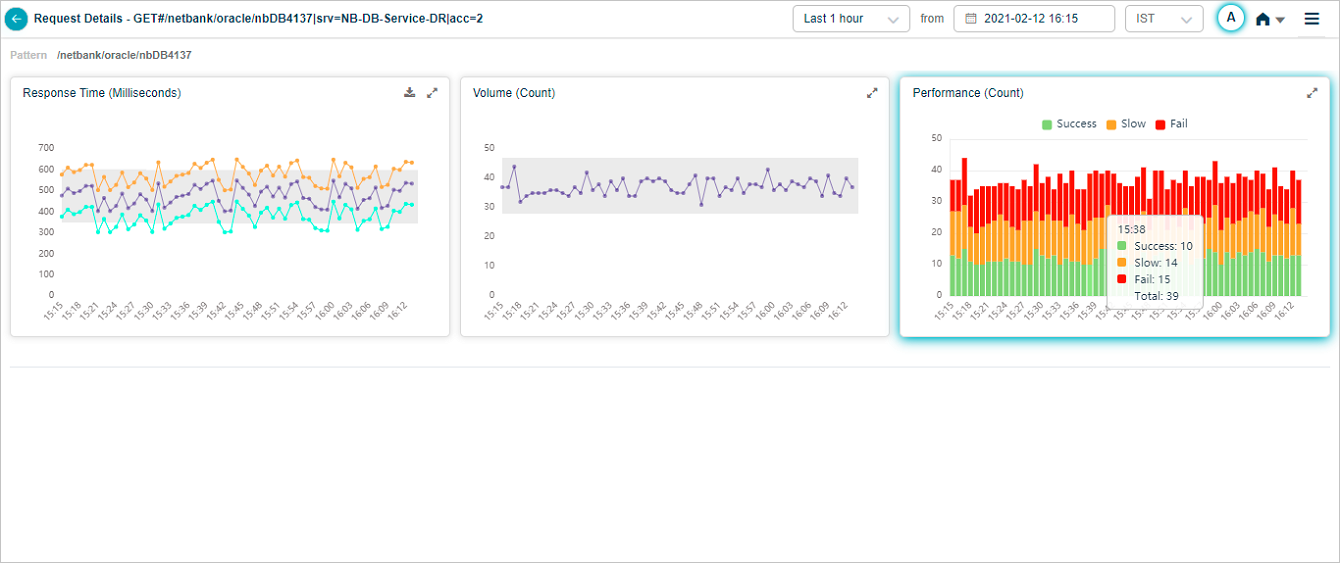
Viewing Details of a Specific Request
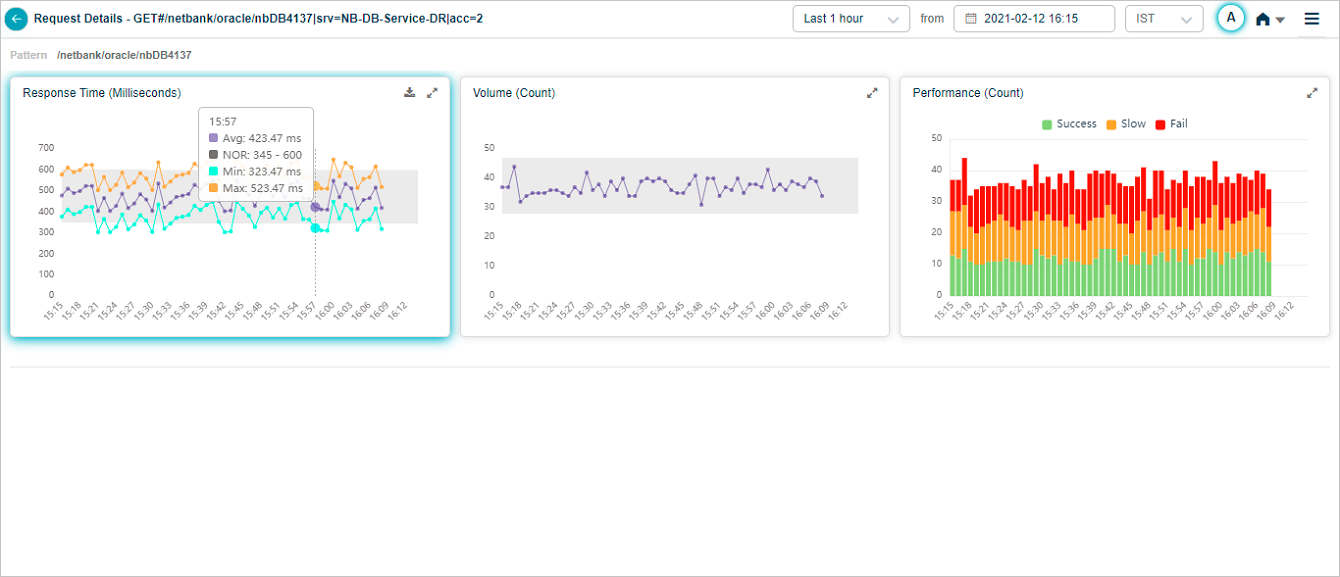
Hover on a data point in Response Time pod to view average, maximum, and minimum response time for the request at a specific instance in time. Instances of a transaction can have different response times. Min indicates minimum response time among these instances. Max indicates maximum response time among these instances. Avg indicates average response time of these instances.
If you select 24 hours period where data points are 1 for every hour, in that case application displays maximum response time as the maximum value in the last 1 hour.
Viewing Details of a Specific Request
Select ![]() icon in Response Time pod to display full view of the pod as follows.
icon in Response Time pod to display full view of the pod as follows.
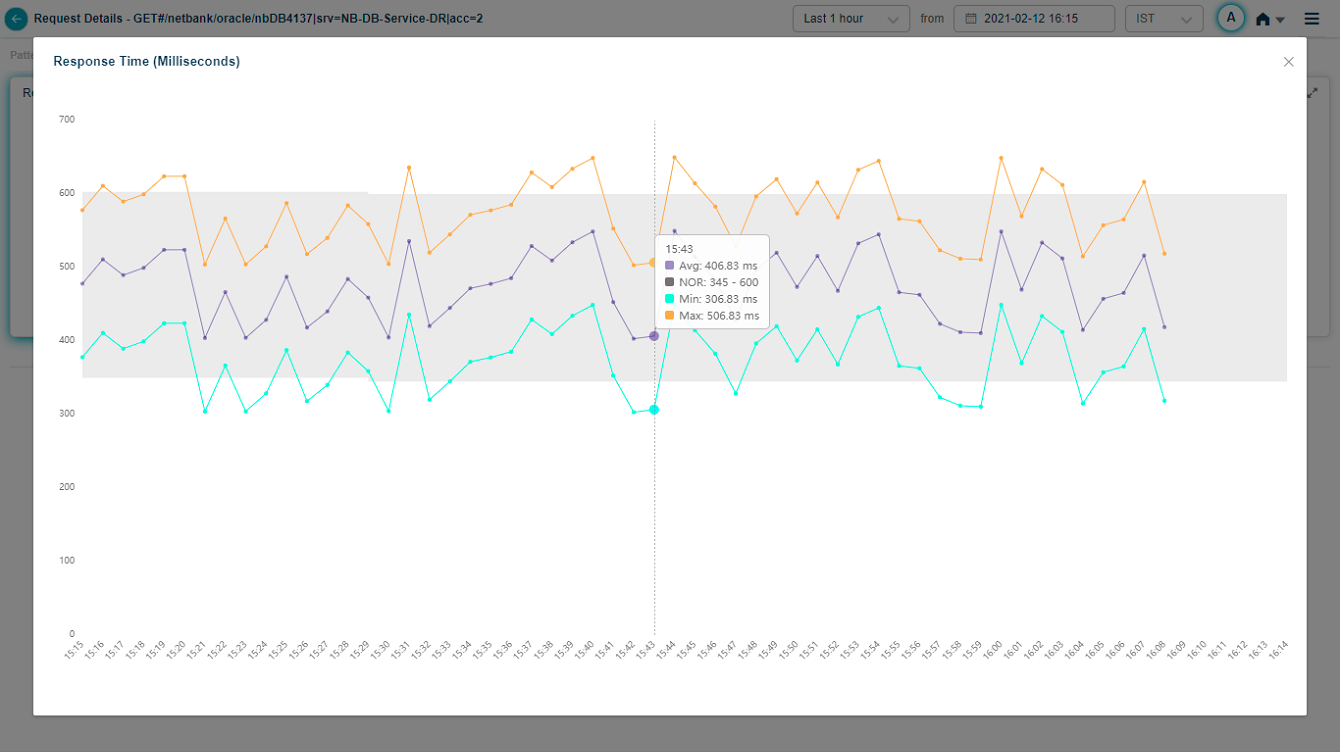
Viewing Details of a Specific Request
Hover on a data point in Performance pod to view details as displayed below.
Viewing Details of a Specific Request
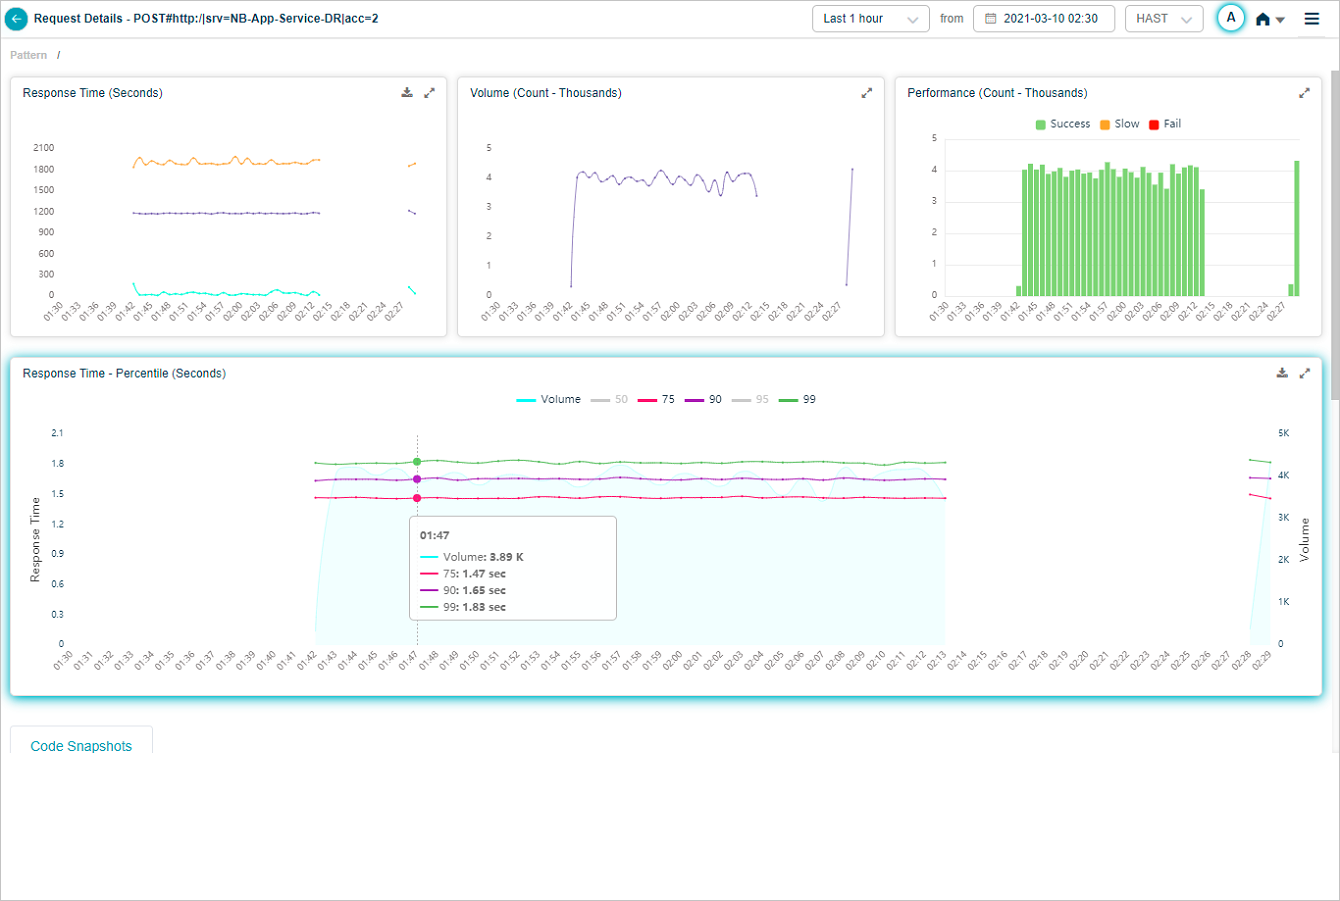
Response Time Percentile
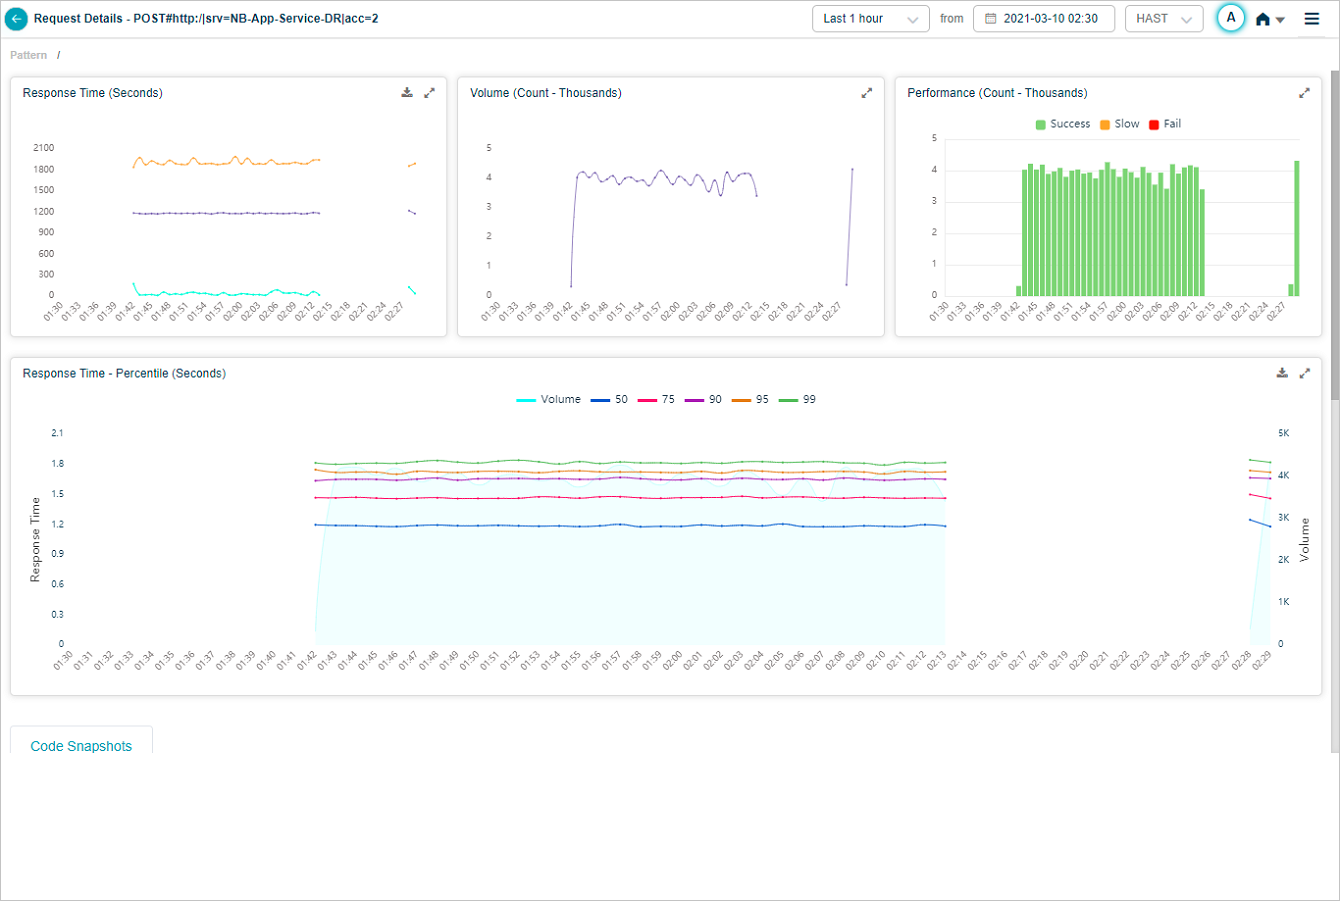
Response Time Percentile
Response Time – Percentile pod displays the response time of the request in percentile value. HEAL displays five percentile values by default – 50, 75, 90, 95, 99. Administrator can configure the percentile values in Control Center at application level. HEAL allows maximum five percentile values for an application. If a service belongs to multiple applications, HEAL displays unique percentiles for all these applications. Response Time graph is visible only when HEAL identifies success and slow requests. If only failed or unknown requests are available, HEAL doesn’t display any data in Response Time graph. Volume graph is visible in both these cases. Hover on a data point in Response Time graph to view the total number of incoming requests for an instance in time and the response time in seconds for individual percentiles. Select  to download the data in CSV format.
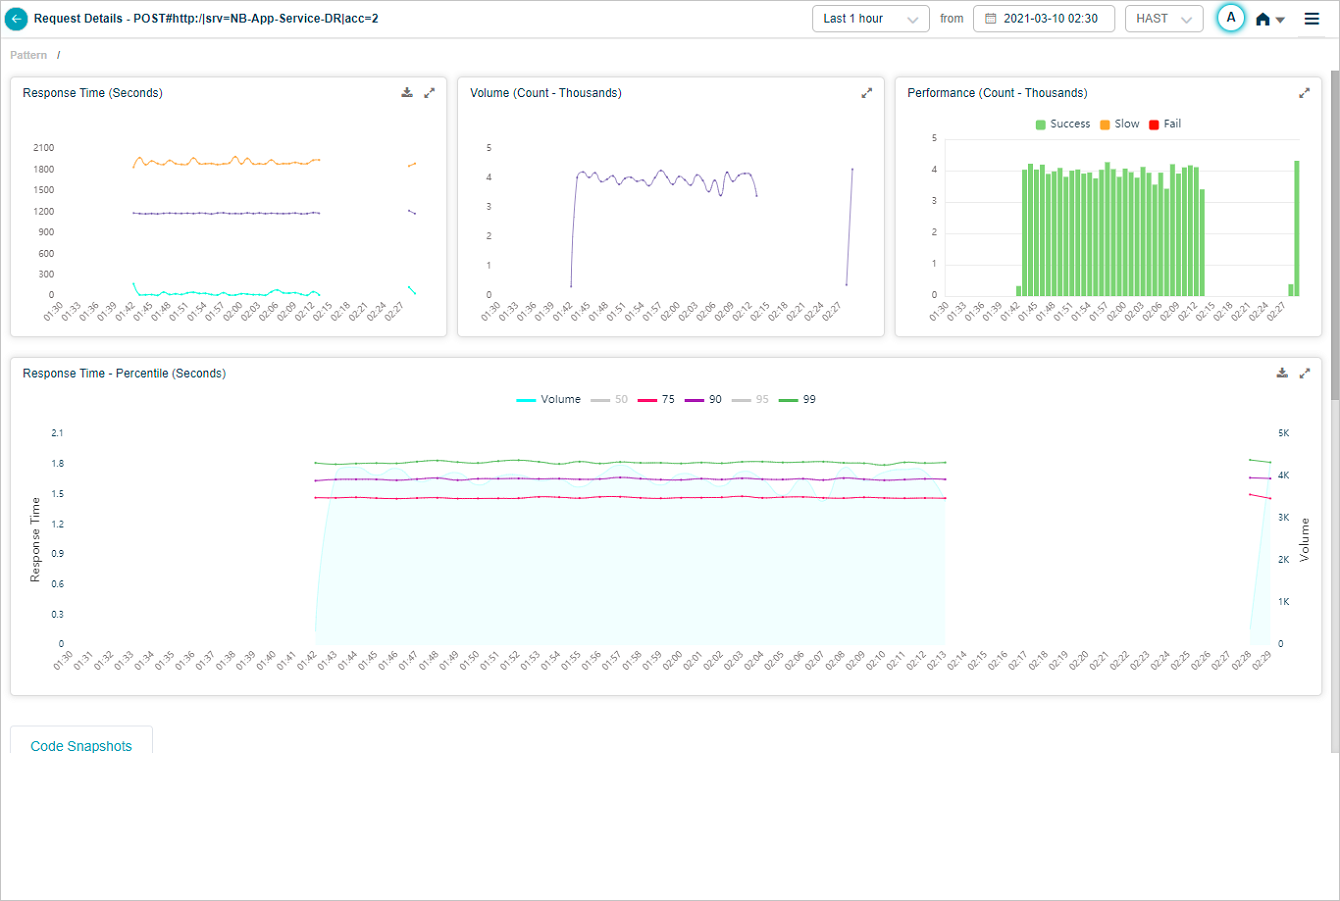
Response Time Percentile
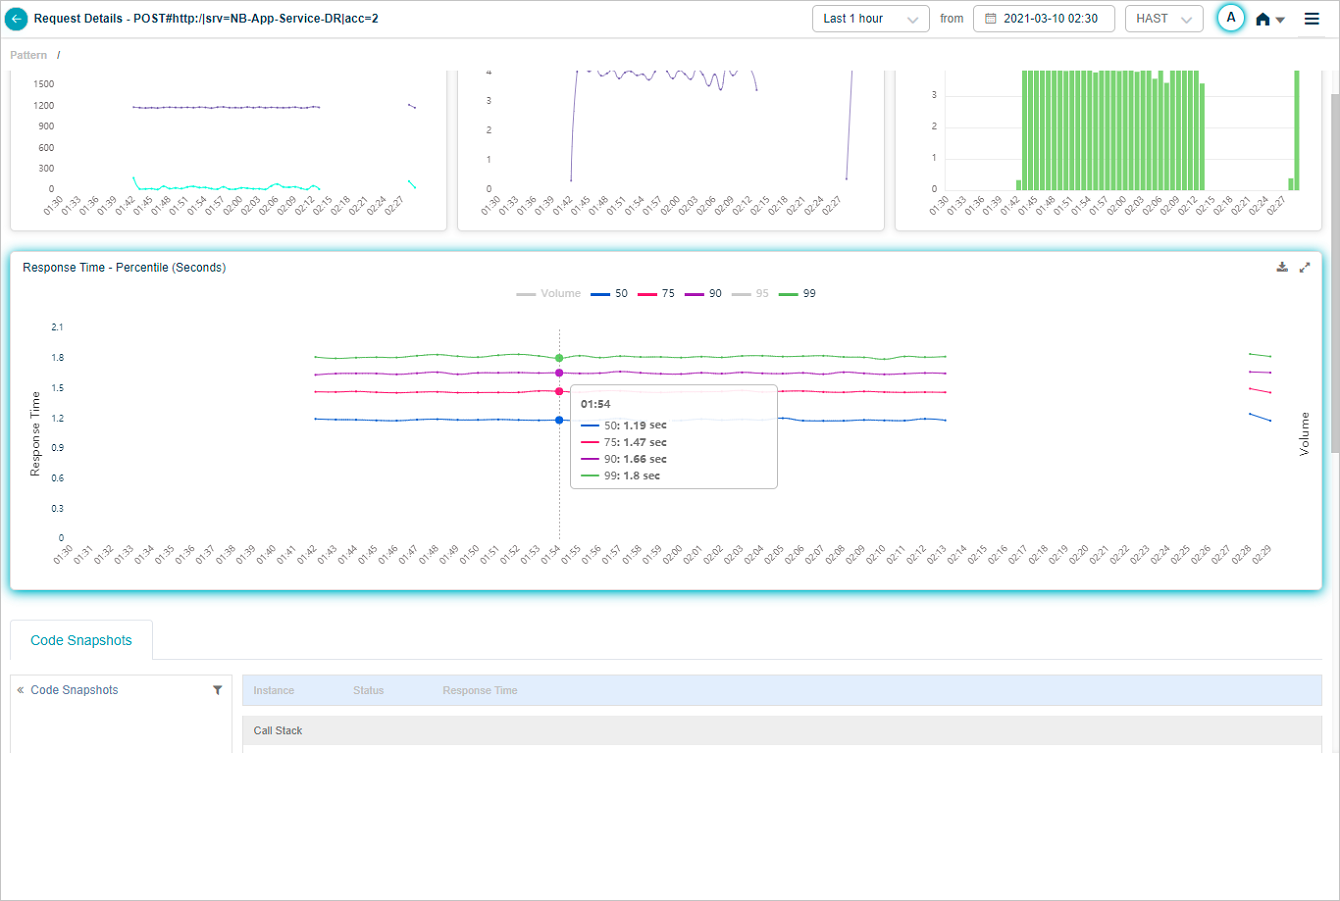
You can choose to view the percentile(s) of your choice. Select on the color bar indicating a percentile to enable or disable the percentile in the UI. If you disable a percentile, corresponding percentile is invisible.
Response Time Percentile
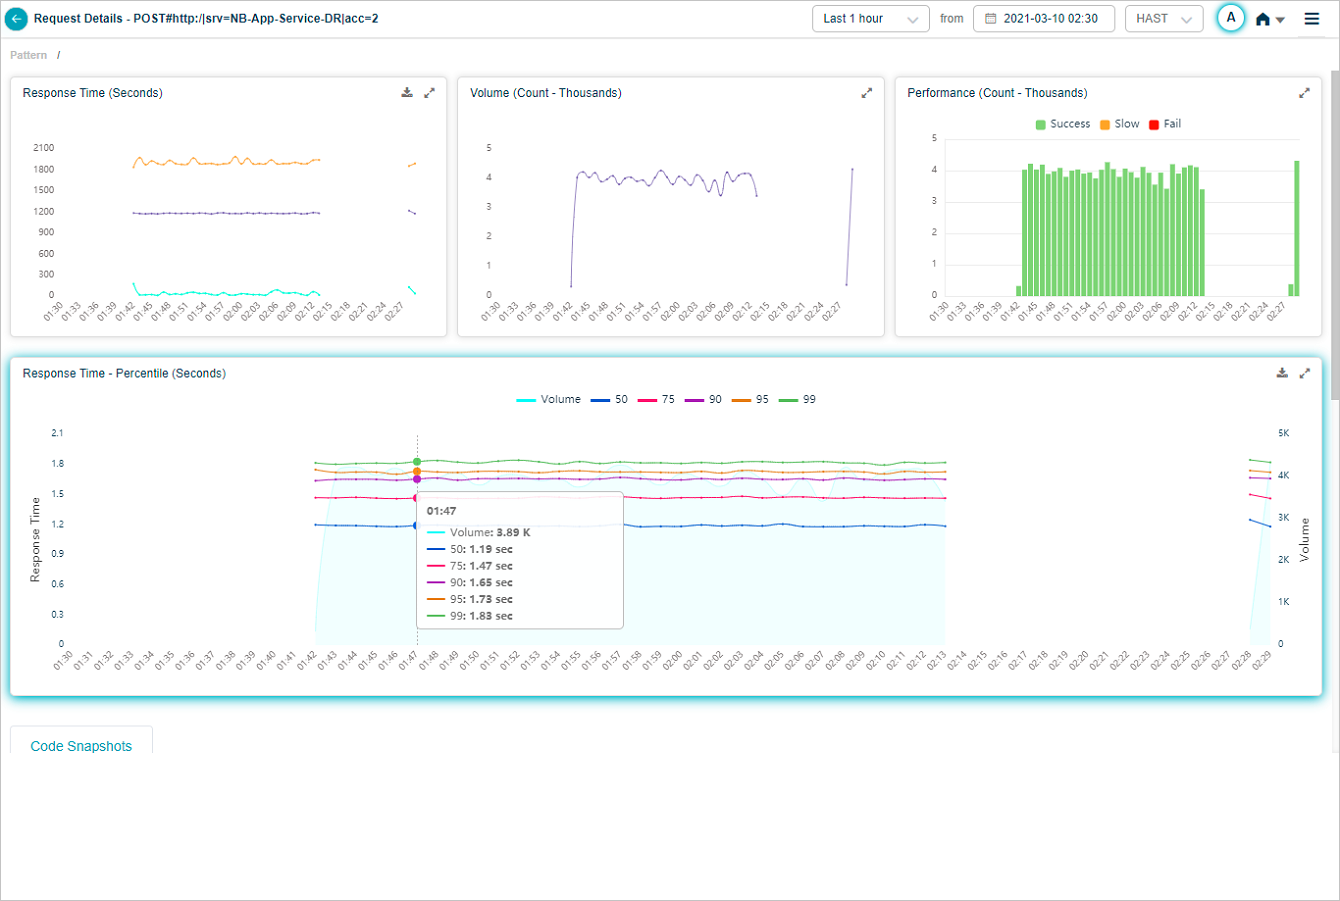
When you hover on a data point in Response Time graph, you can view the response times of the percentiles which are in enabled state.
Response Time Percentile
Response Time Percentile
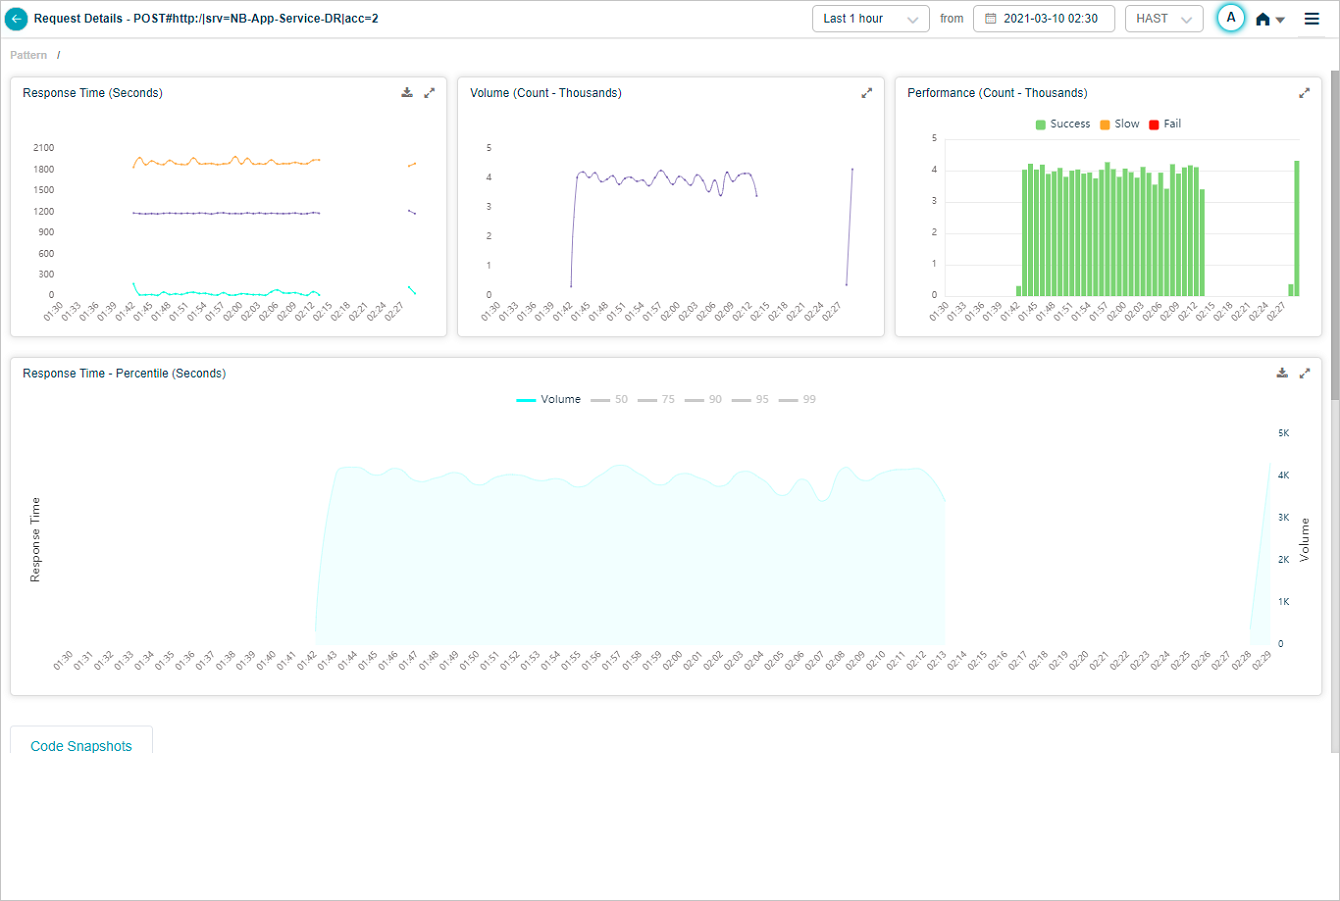
You can disable all the percentiles keeping only volume in enabled state. In this case, you can view only the volume graph.
Response Time Percentile
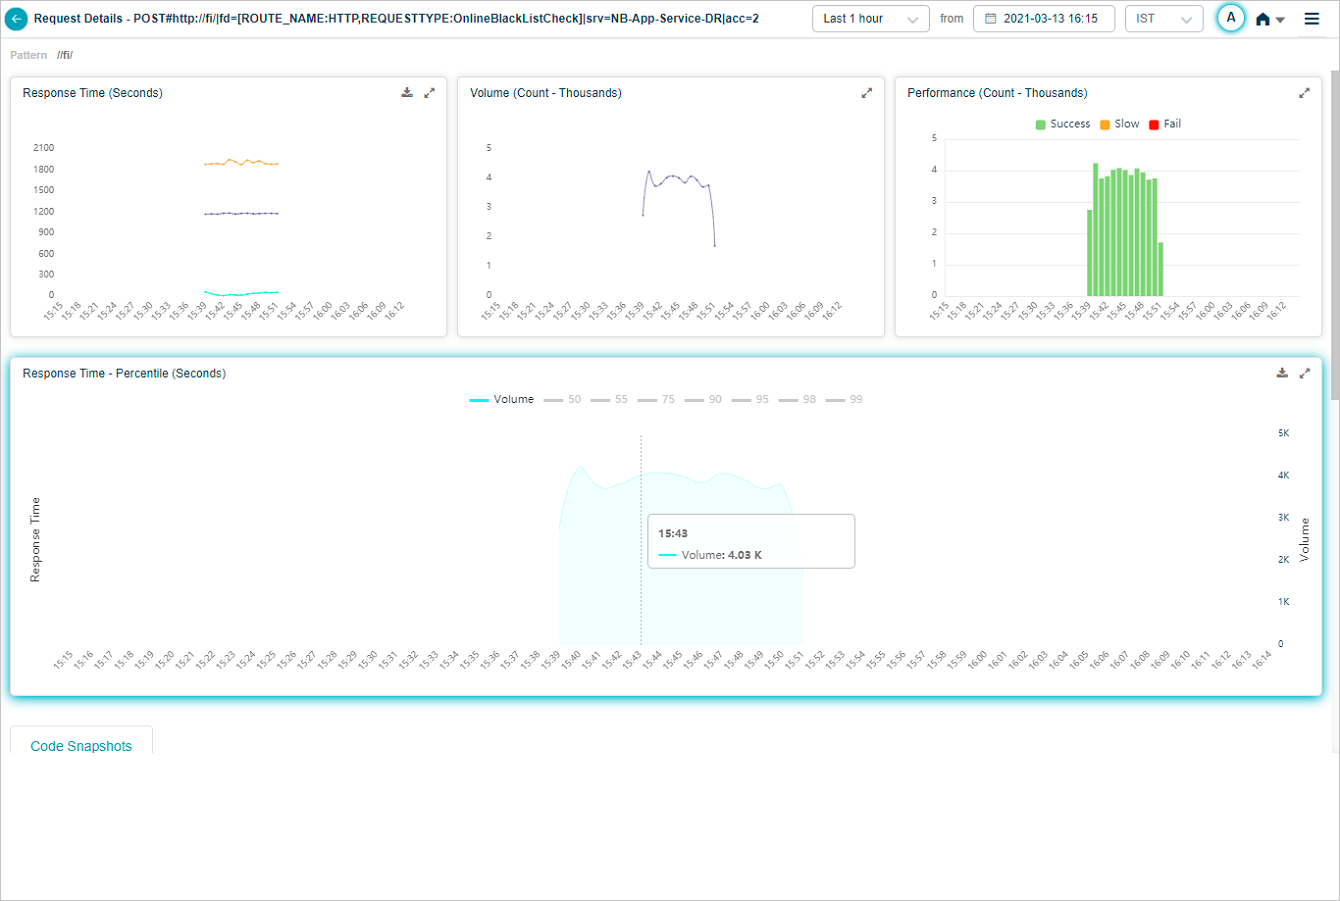
Hover on a data point in the volume graph to view the total incoming requests for an instance in time.
Response Time Percentile
Say, available percentiles are the default ones. Application owner changes the configurations at 3 PM to 1,5,50,95,99. For a time interval post 3 PM, visible percentiles are 1,5,50,95,99. For a time interval before 3 PM, visible percentiles are the default ones. You can see the new percentile values in legends but graphs are unavailable for these new percentiles. Say, you select a time interval of 2.30-3.30 PM. This happens to be in the middle of the configuration. Between 2.30-3.00 PM, you can see the data for default percentile values. Between 3.00-3.30 PM, you can see the data for 1,5,50,95,99 percentile values.
Java Intrusive Monitoring
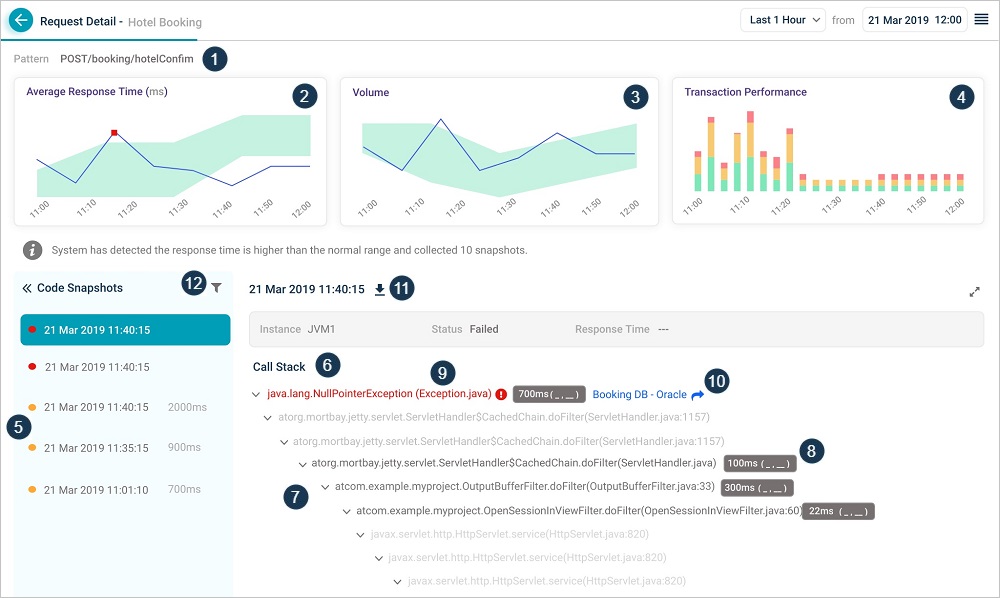
If Java Intrusive Monitoring (JIM) is configured for a Service, code snapshots are displayed whenever a request slows down or runs into technical errors.
Java Intrusive Monitoring
| 1 | Request being monitored. This displays request payload data if any that distinguishes the request. |
| 2 | This displays trend of average response time of the request. |
| 3 | Trend of the volume. This displays count of this type of requests at selected time period. When a user discovers a new request, it gets added automatically. As the admin keeps adding fine grained rules, requests are discovered and added. |
| 4 | This displays the performance of the transactions over a time period. It shows the breakup of the performance for each time segment. |
| 5 | This displays a list of code snapshots for a specific request in reverse chronological order on the time they were collected. It also displays response time of the request instance, the component – Java Virtual Machine (JVM) which processed the request and status. Each snapshot corresponds to an instance of the request. It displays snapshots of slow or failed requests only (failed – red, slow – orange) along with the date and timestamp for the snapshot. By default, first snapshot in the list is selected. |
| 6 | This displays call stack of the selected snapshot. |
| 7 | Instrumented methods are in dark text. Non-instrumented methods are in gray or light text. It indicates that agent has captured the snapshot but does not monitor the method. |
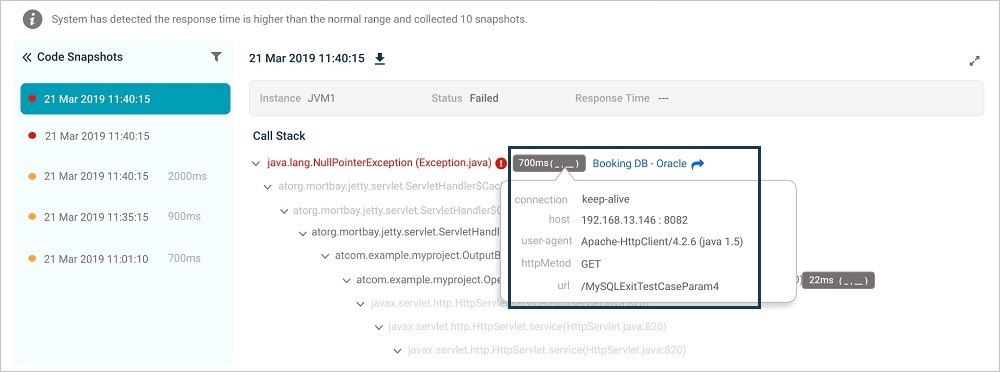
| 8 | Methods that have parameters captured are denoted appropriately. Response time (time spent in each of the monitored method) is displayed in milliseconds. Hover on the option to see the parameters for a monitored method. It displays the argument name and value. |
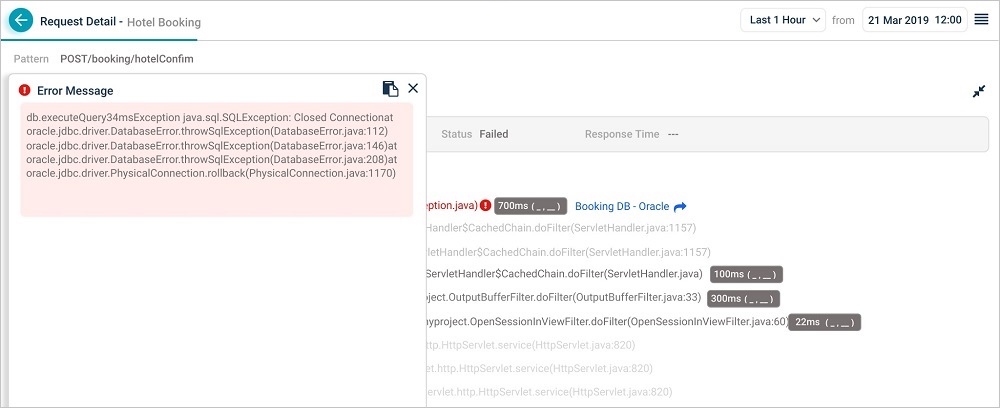
| 9 | Exceptions are marked in Red. Select the exception to see error in detail. |
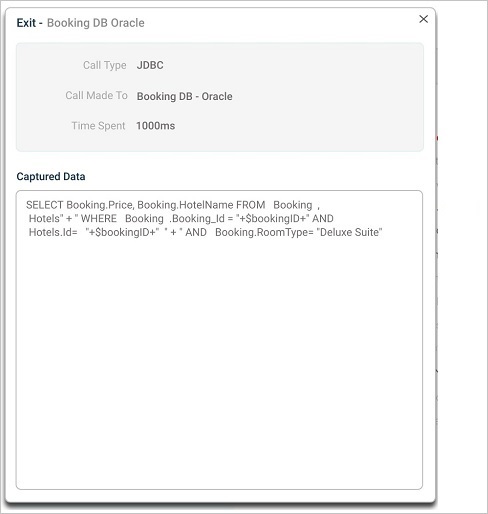
| 10 | Exits are marked in Blue. Select on the exit to view the parameters passed into it. It shows time spent in Exit and the call type. It displays data sent to exit according to the type of exit. Captured Data displays queries executed by the Exits. |
| 11 | Select this icon to download the call stack in .pdf format. |
| 12 | You can filter snapshots that have failed or slow status. |
Method Arguments and Values
Method Arguments and Values
Exit
Exit
Exceptions
Exceptions
Code Snapshot for a Slow Request
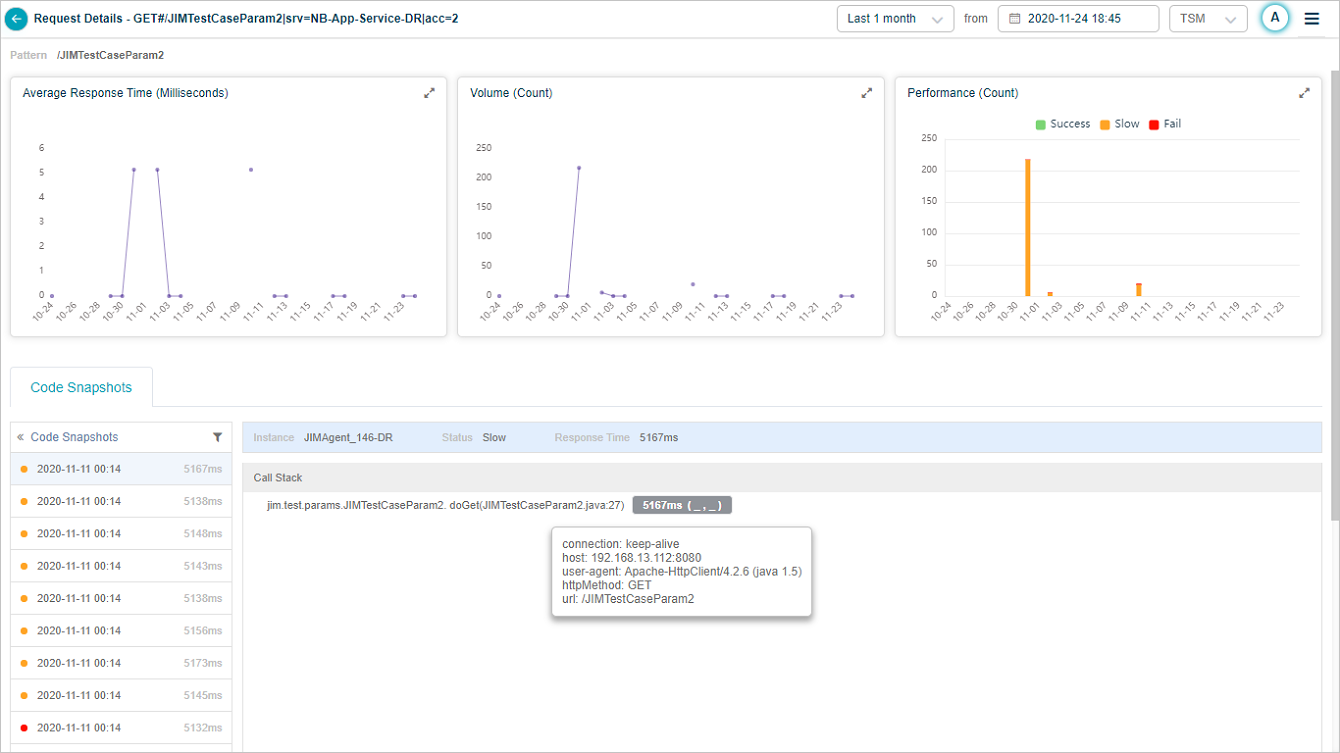
Code Snapshot for a Slow Request
Filtering Code Snapshots
You can filter the snapshots on certain criteria so as to view a subset of them. Filters dialog box is displayed.
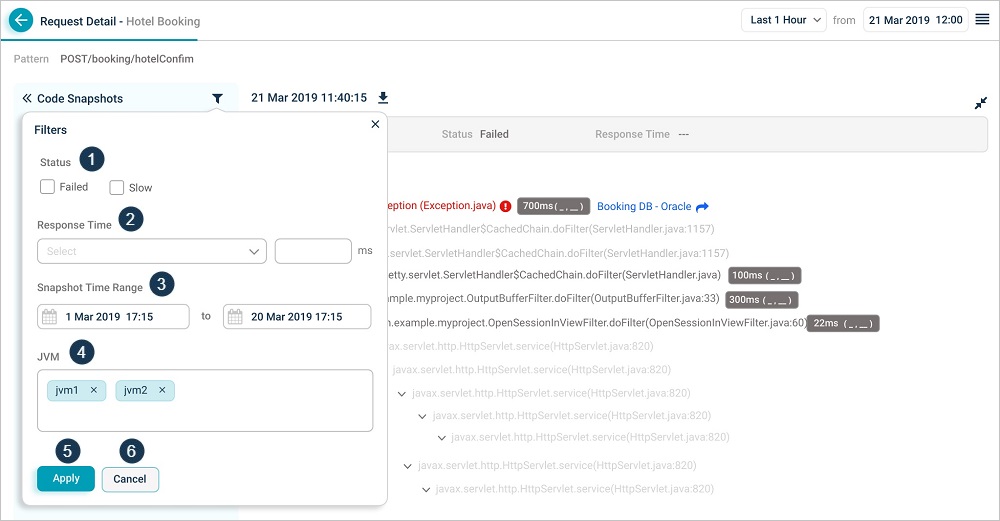
Filtering Code Snapshots
| 1 | You can filter snapshots that have failed or slow status. Select Failed or Slow in Status box. |
| 2 | You can filter on response time of the snapshot. Available options are greater than, less than and equal to. Enter response time in a box next to the drop down. |
| 3 | You can filter on the time range of snapshots. Select a start date-time and an end date-time. The times should be within the range of the primary time range of the snapshots. |
| 4 | You can filter on the components, for example, JVMs that served the request. Enter the components to filter by in JVM box. |
| 5 | Select Apply to set the filters. |
| 6 | Select Cancel to discard the filters. |
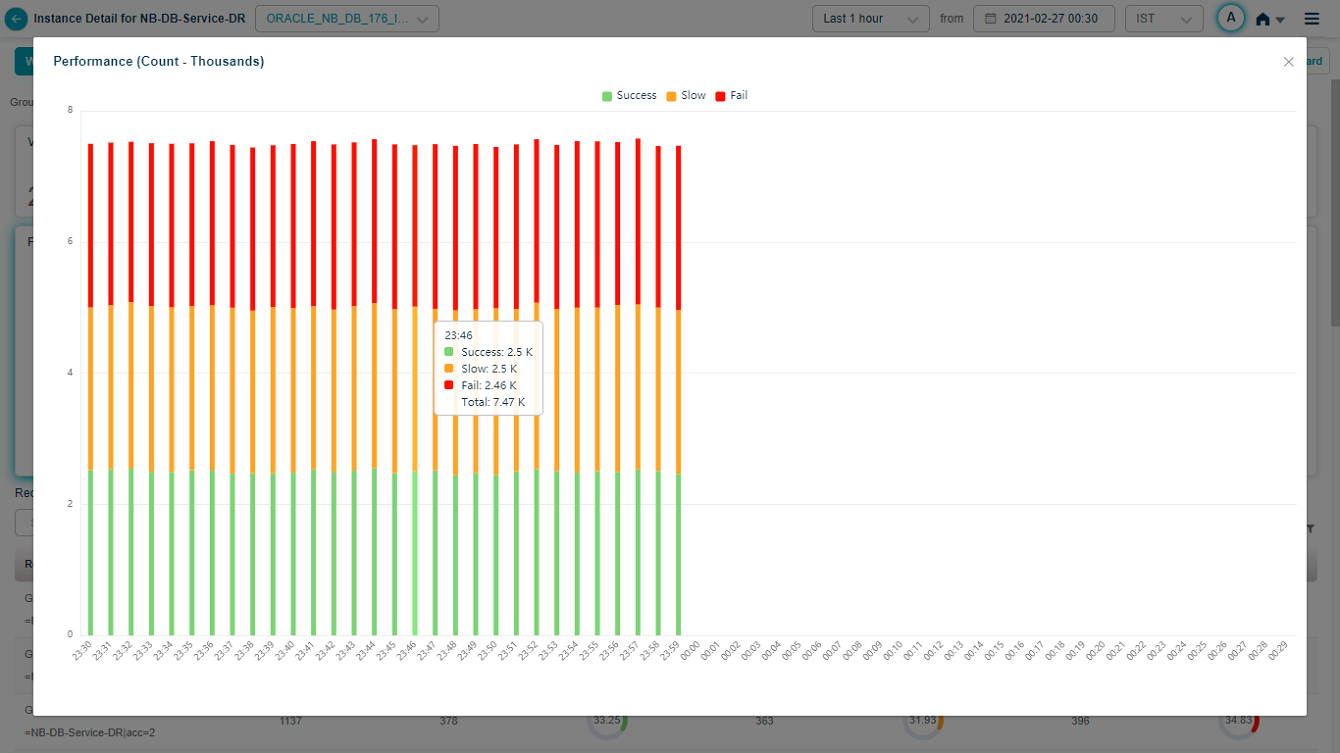
Request Dashboard at Instance Level
Request Dashboard at Instance Level appears when you select on any of the workload metrics (Errors, Slow, and Volume) for an instance in Service Details screen.
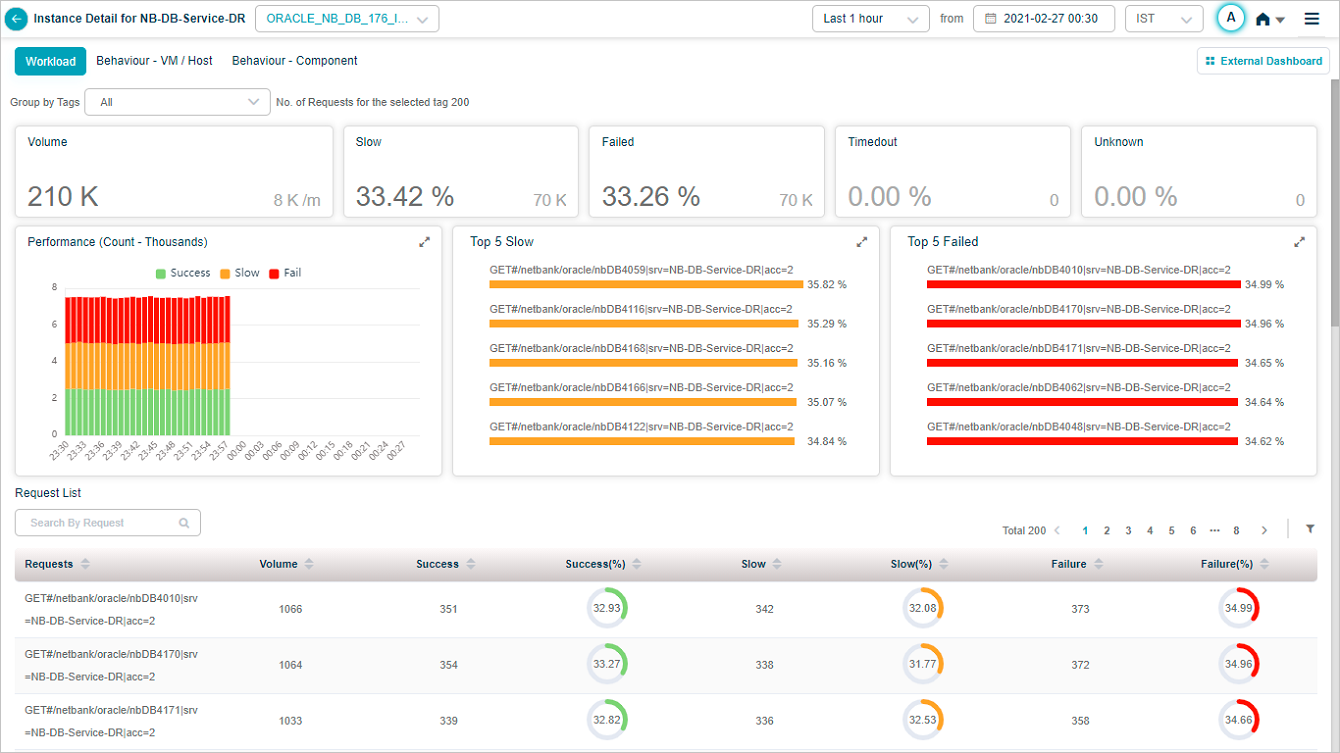
Request Dashboard at Instance Level
Hover over a data point in Performance pod to view details as displayed in following screen.
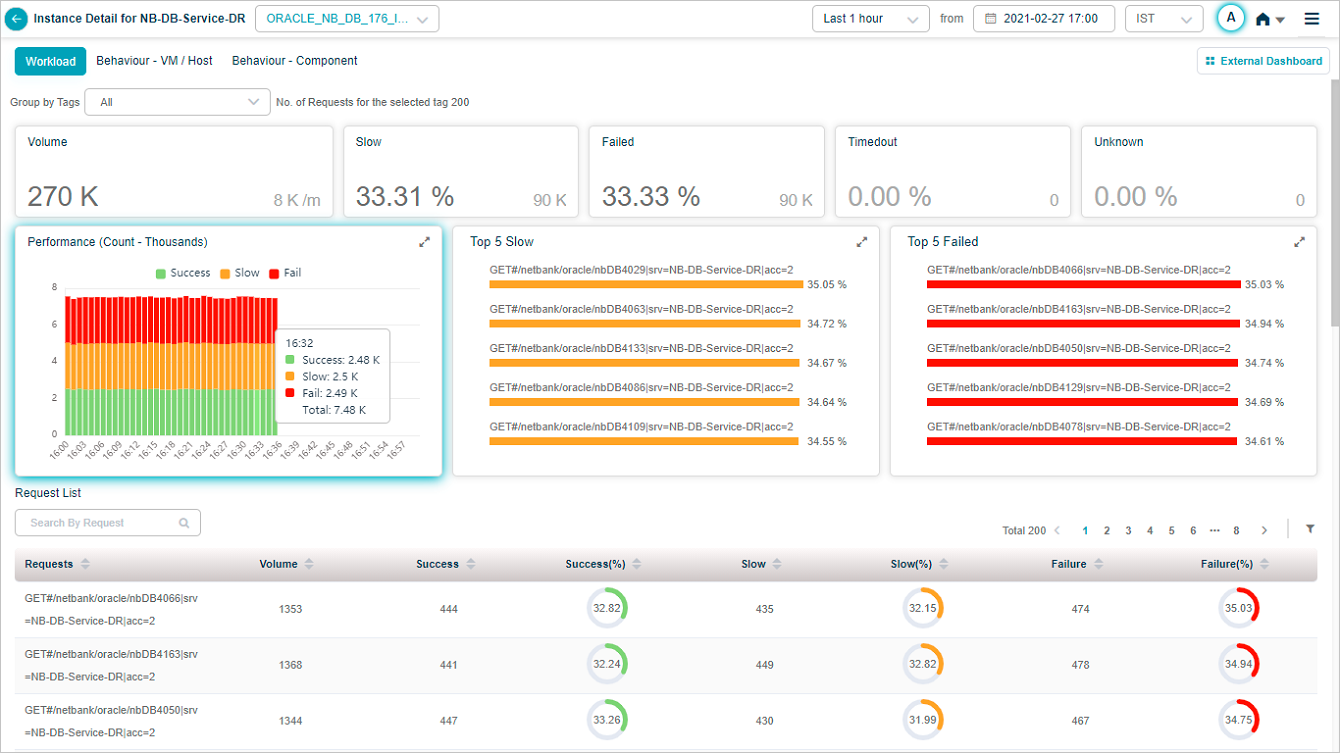
Request Dashboard at Instance Level
Select ![]() icon in a pod to display full view of the pod as follows.
icon in a pod to display full view of the pod as follows.
Request Dashboard at Instance Level