How Can We Help?
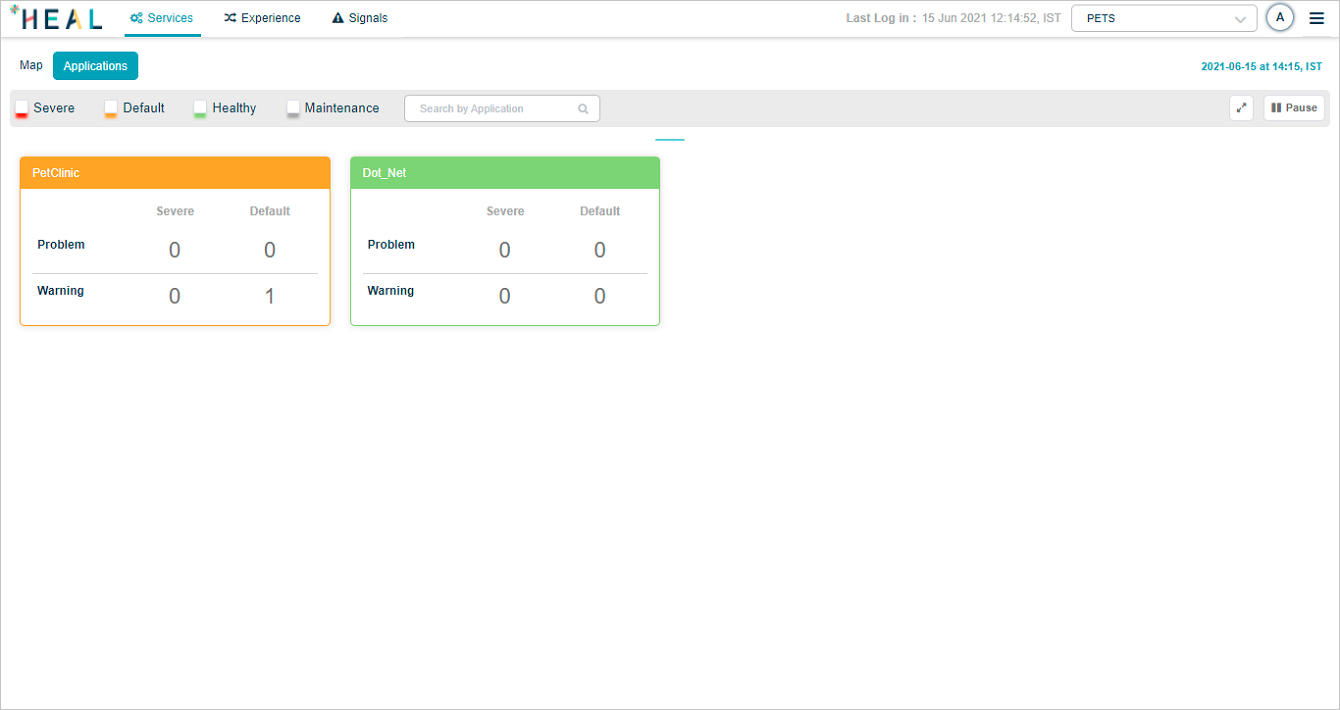
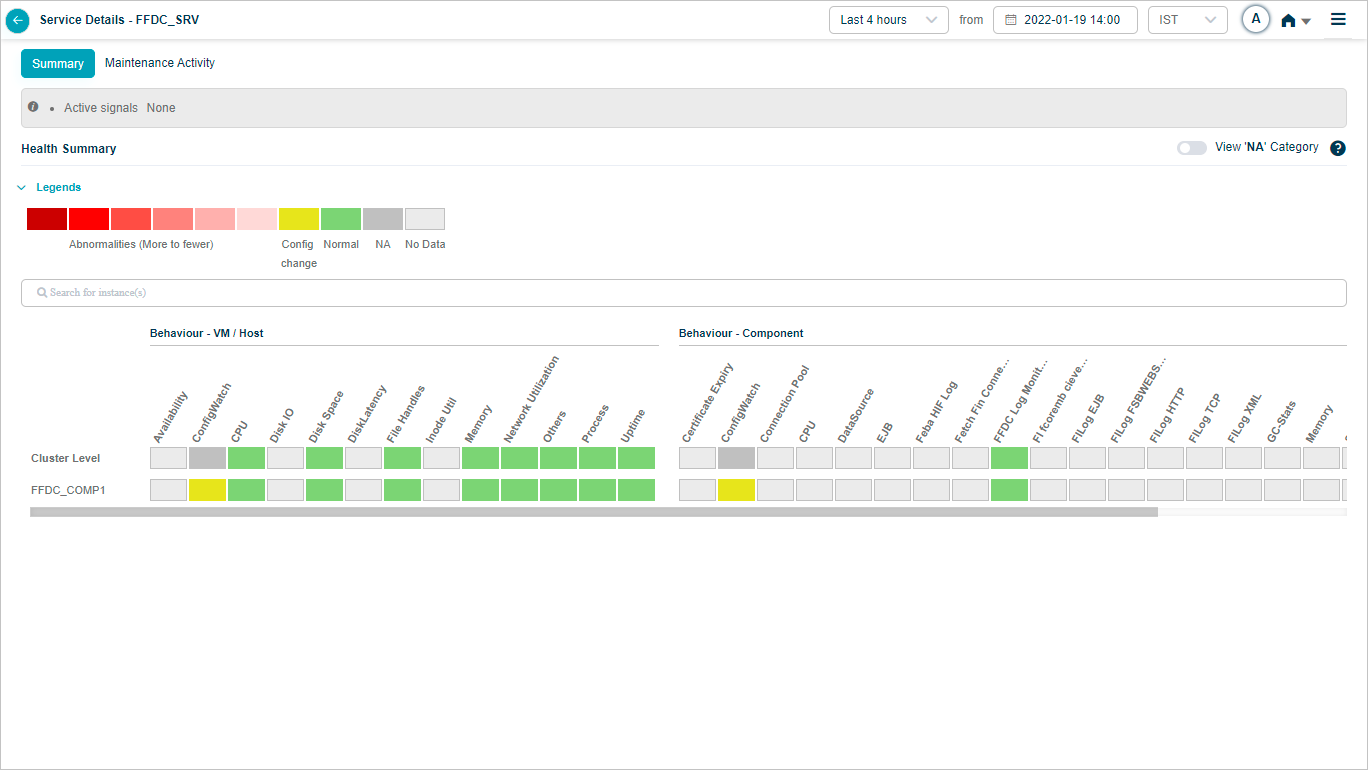
Select a service in the SDM screen to view the Service Details screen of a particular service. It provides a quick overview of the health of a service at that time. It displays several instances running on this service, Workload KPIs, Behavior KPIs, active signals, and events on the service. You only have access to those services mapped to applications assigned to you. You can select only those services in SDM to view the service details.

Service Details_Summary
Last Login Timestamp
You can view the date and time of your last login in the top right corner on all the screens in HEAL UI.
Service Details_Summary
Events
HEAL application generates events based on thresholds.
Types of Thresholds:
Normal Operating Range (NOR)
Also termed as the Dynamic Range, the NOR is a sequence of high and low values that the application generates over time. The application uses our unique Machine Learning (ML) models to create these values, incorporating aspects like load-behavior correlations.
Our Machine Learning Engine (MLE) is tasked with generating and periodically adjusting these NORs, maintaining accuracy and relevance.
To establish dynamic thresholds, the system employs multiple ML techniques and saves these thresholds as time series value ranges.
Safe Operating Range (SOR)
The SOR, often referred to as the Safe Range, is a static range made up of an extremely high value and a low value.
Administrators are responsible for setting this range, relying on current metric values, and using a pair of high or low values.
The SOR, along with the availability Key Performance Indicators (KPIs), adhere to persistence or suppression rules at the service level. Administrators can modify these rules in the Control Center at the service level, as necessary.
Types of KPIs
Workload KPIs – Workload KPIs are the Key Performance Indicators of the amount of load in terms of Request & Response served by the instance, status, and response time of the request. Business information captured in the response to Request adds input to the Experience Journey. Requests aka transactions are technical requests (e.g., URI call) received by a Service from an external actor or another service.
Behavior KPIs – Behavior KPIs are Key Performance Indicators about how the monitored instances behave or function. Behavior KPI can be a Performance metric or an Availability metric.
Performance Metric KPI – Performance Metric KPI represents the performance information of the component and host instances. The values can be numerical values of different types.
Availability KPI – Availability KPIs represent the state of instances and ports. The form can be either up or down. The values are binary (0 or 1). See
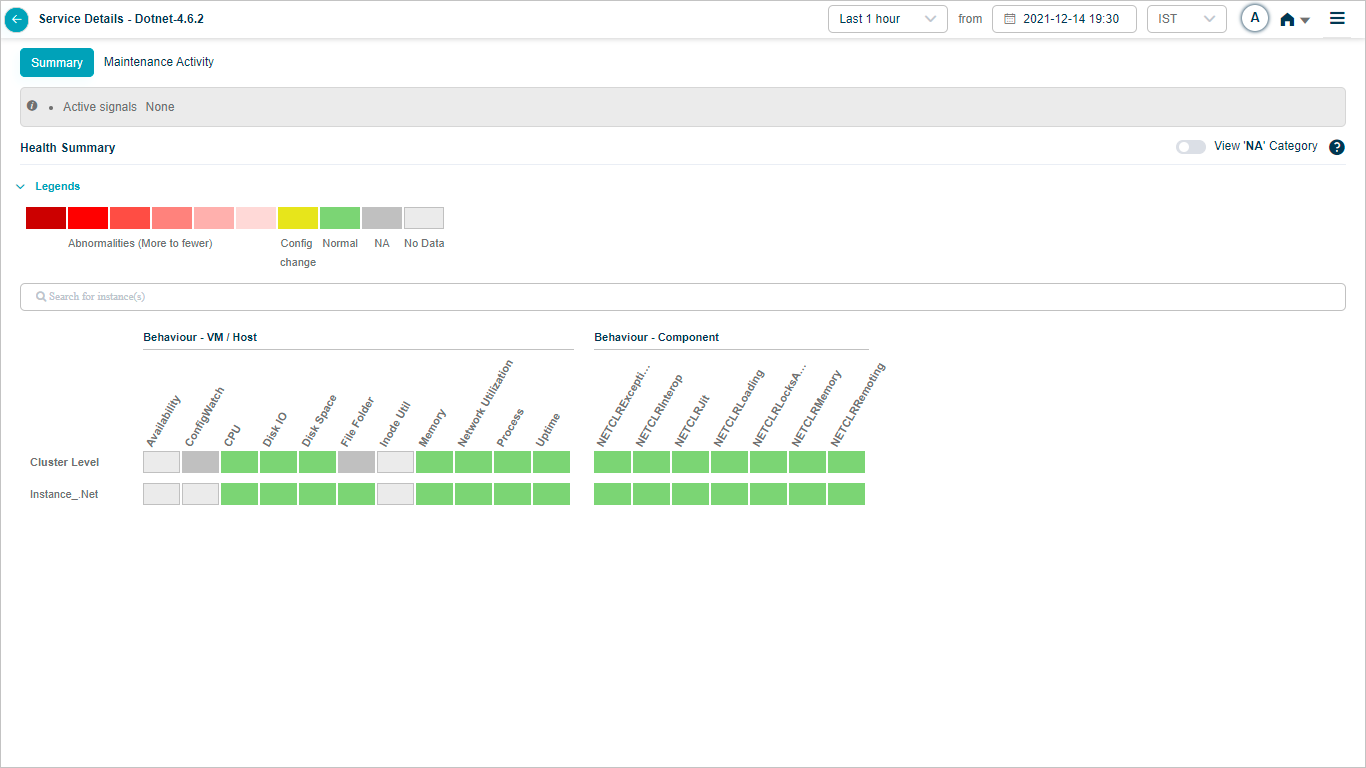
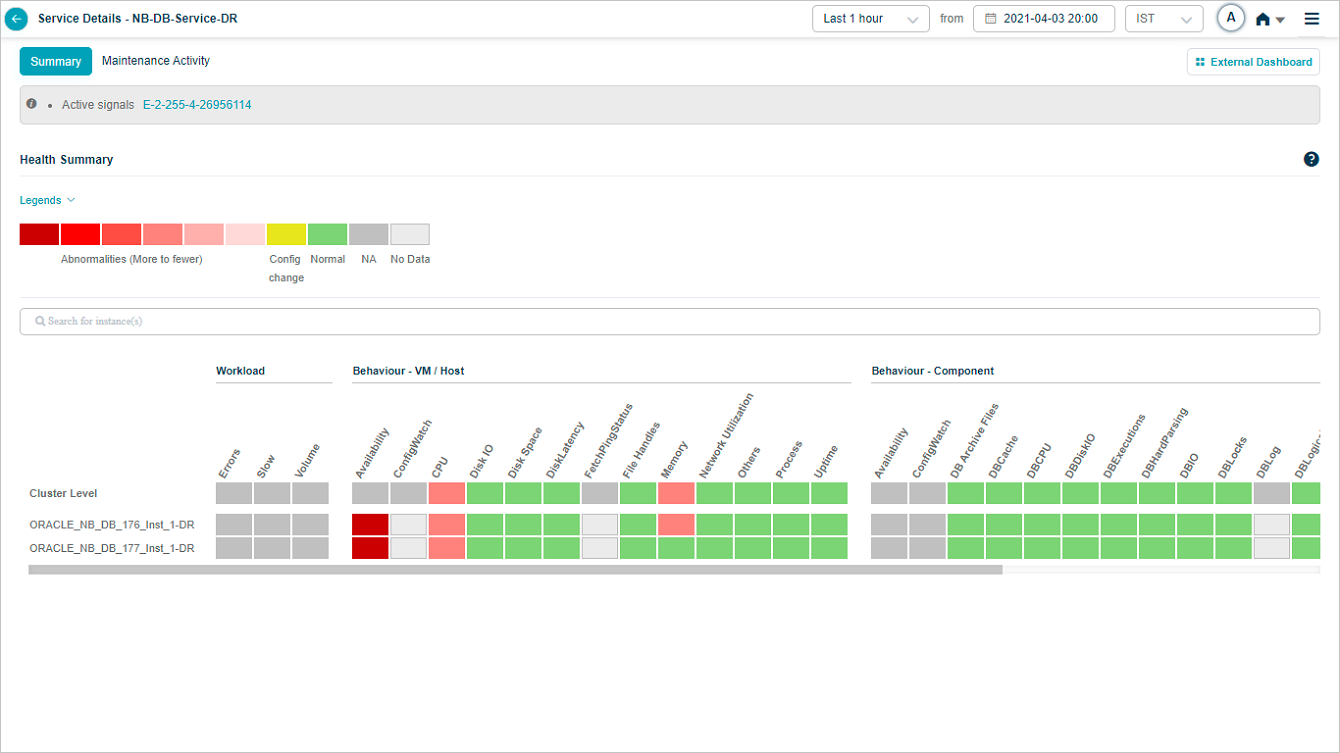
Overview Heat Map
Heat Map
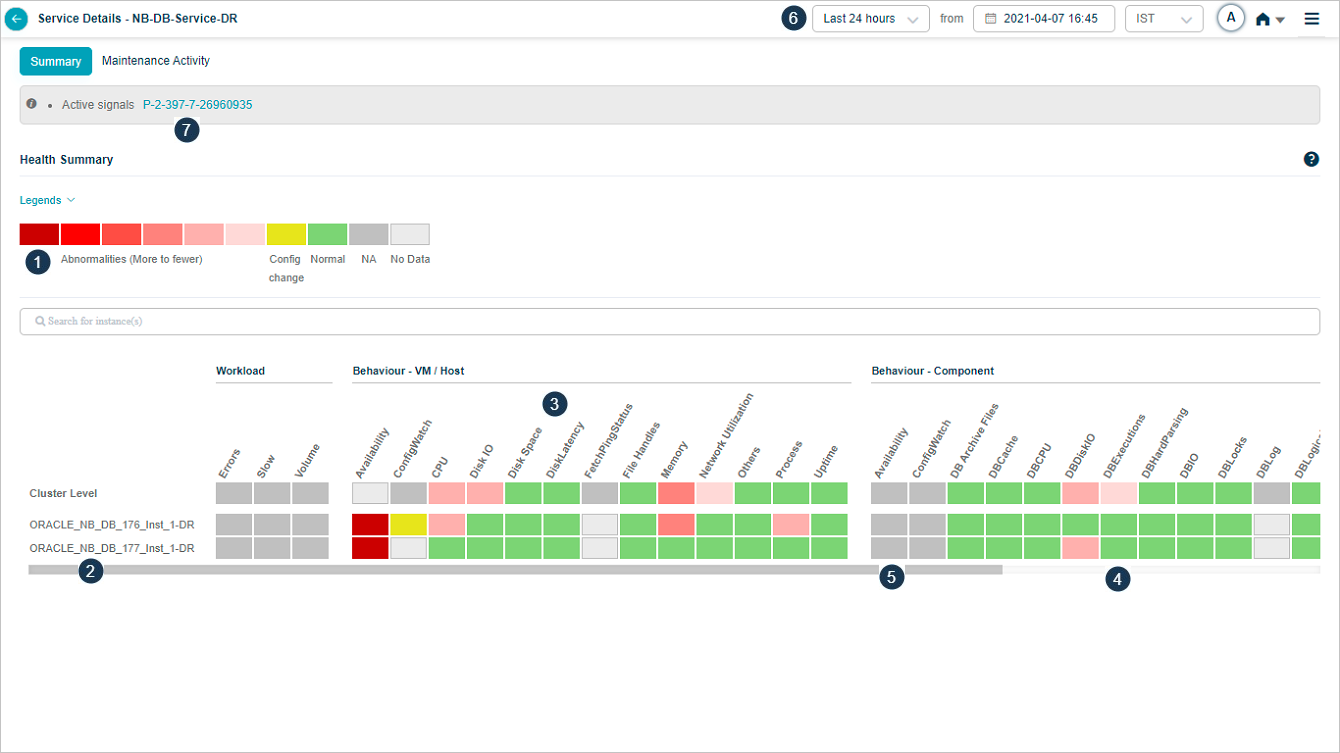
| 1 | Events are indicated from highest to lowest. |
| 2, 3 | Instances and KPI categories are listed in alphabetical order. You can create a service with host instances only. Refer Service Creation. In this case, only host instances are listed in the heat map with cluster on top. You can see a message “No component instance is mapped to this service”. Instances with events are displayed before the instances without events. If multiple instances have events, these events are displayed in alphabetical order. |
| 4 | Each block in the overview heat map corresponds to a category for an instance or a cluster. |
| 5 | On hover on the blocks, the number of events are shown for the respective KPI categories at the instance or cluster level. |
| Gray blocks indicate those KPI categories are not applicable (not defined) at either cluster or instance levels. | |
| 6 | The last 1 hour is the default selected time. |
| 7 | Comma-separated lists of active problems are displayed. |
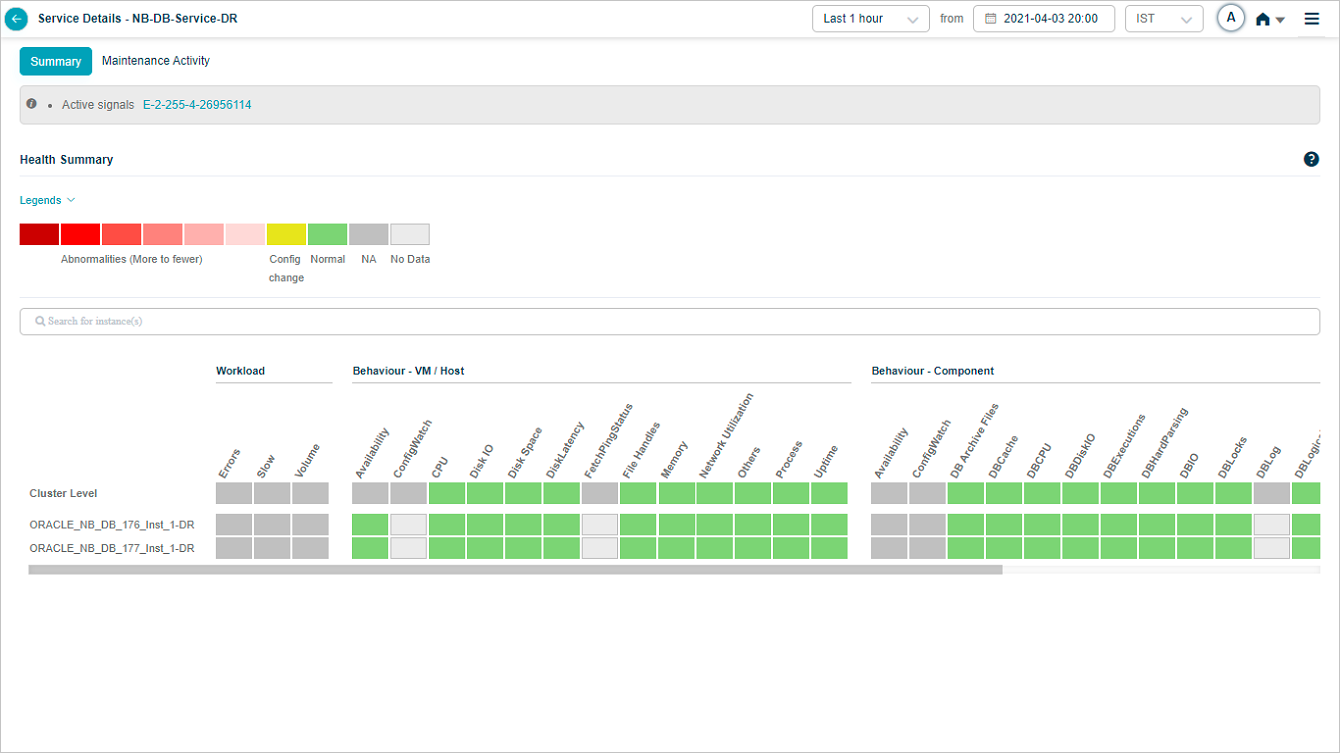
Service Details without any events looks as below.
Heat Map
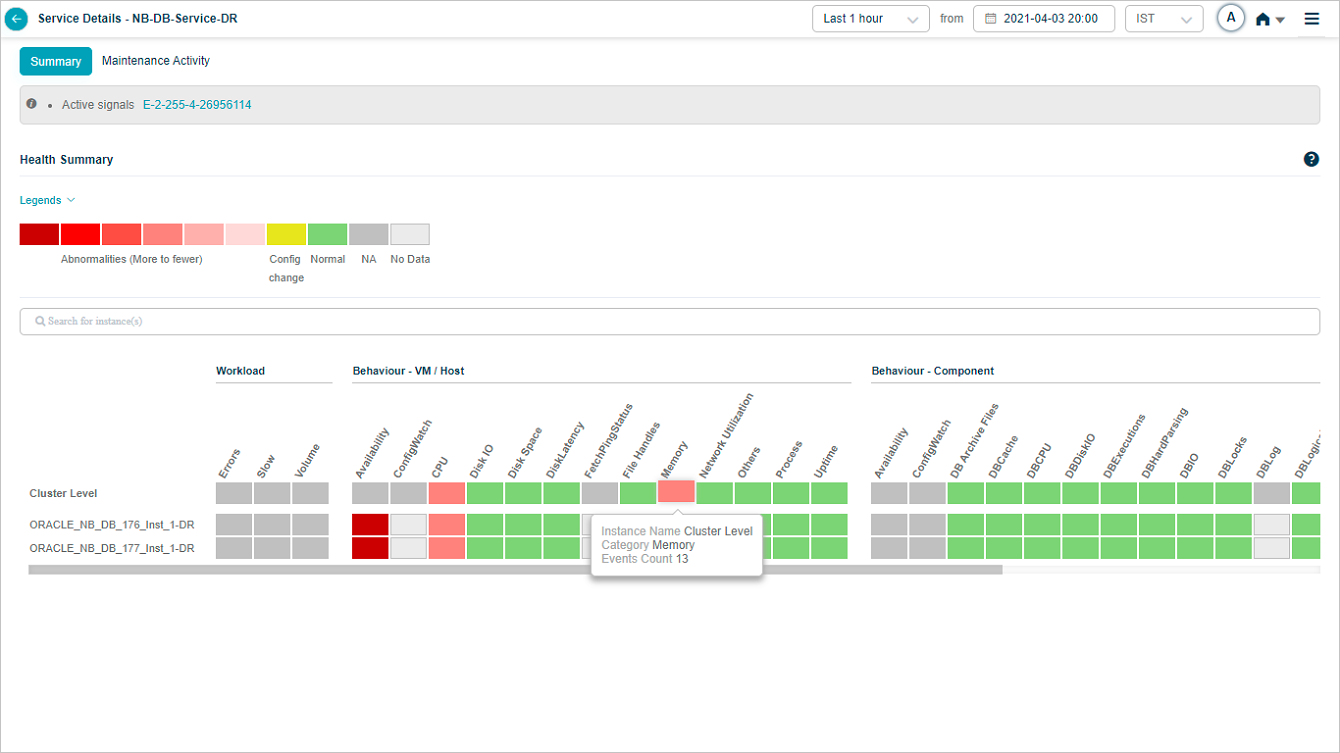
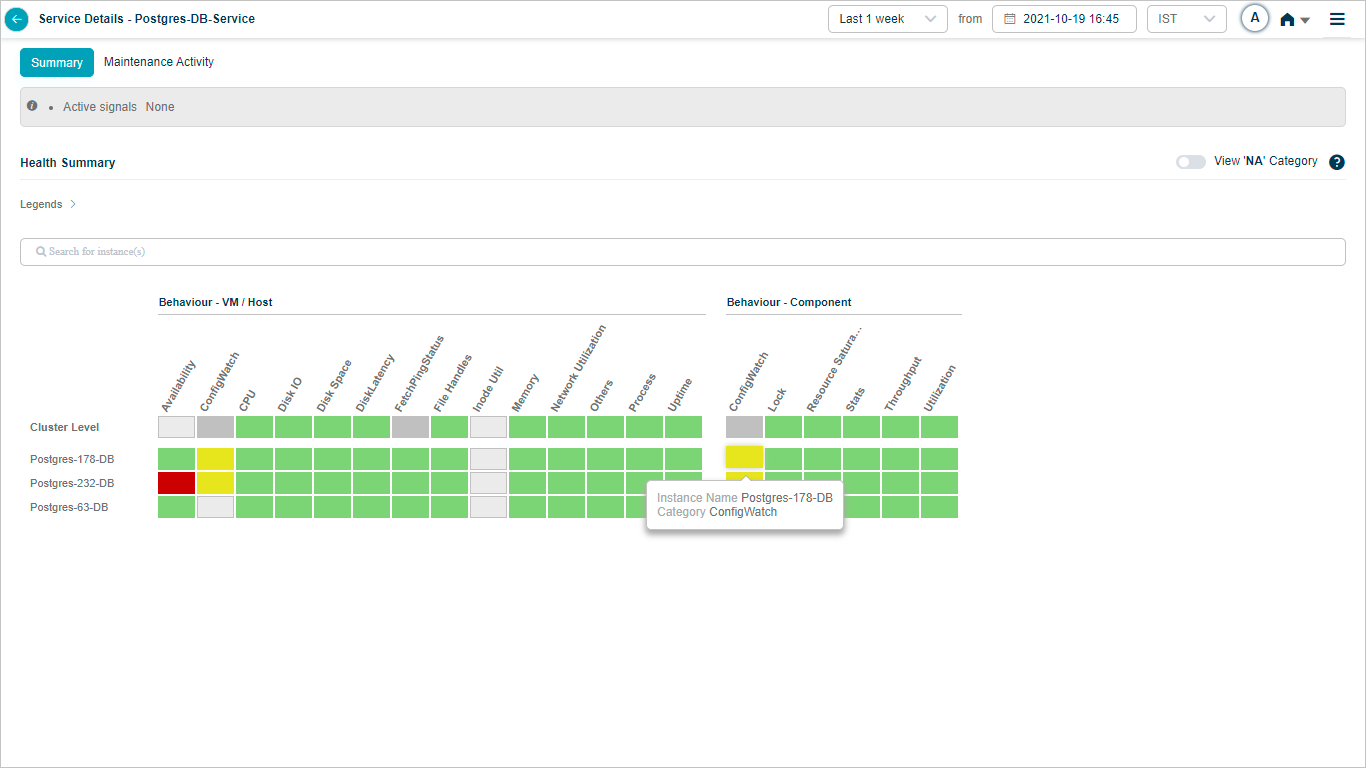
Hovering on a block with events at cluster level looks as below.
Heat Map
Hovering on a block with events at instance level looks as below.
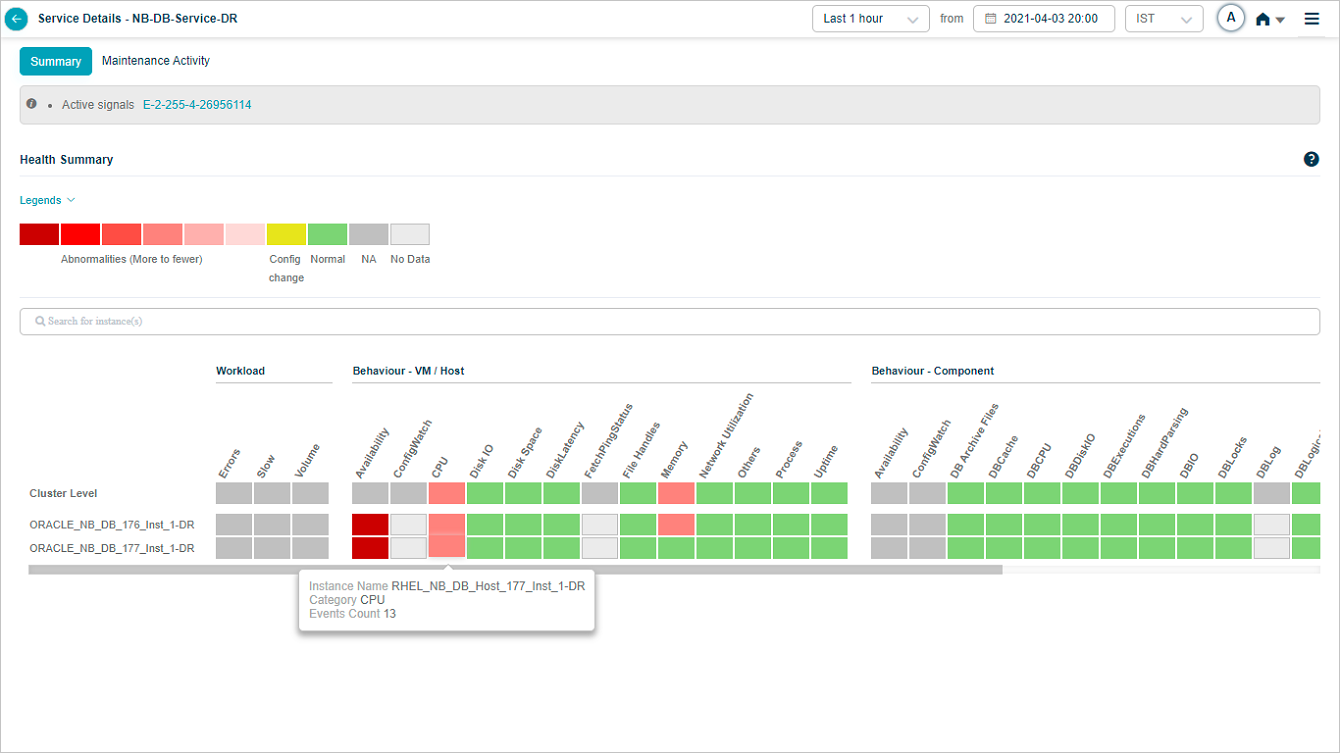
Heat Map
Heat Map
Heat Map
Hovering on a component instance displays the IP Address of the host as shown in following screen.

Select help icon  to display information on the service details as below.

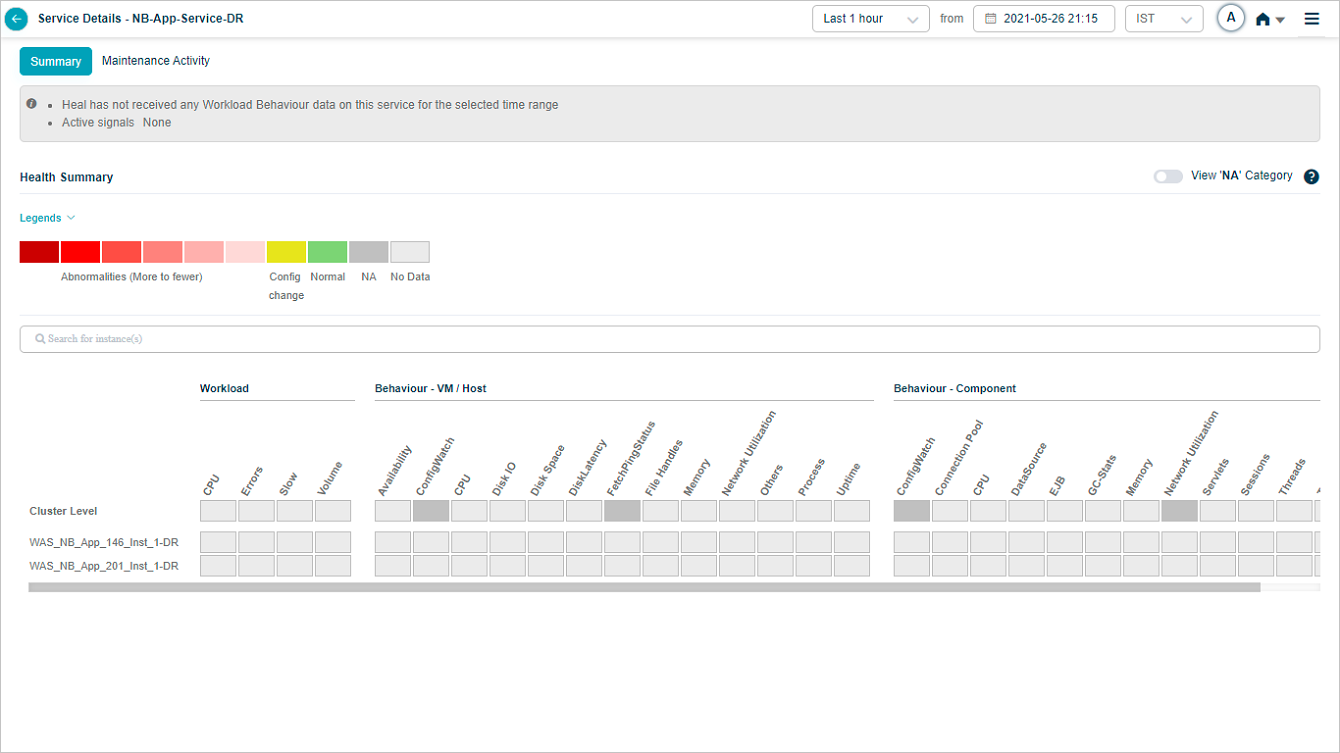
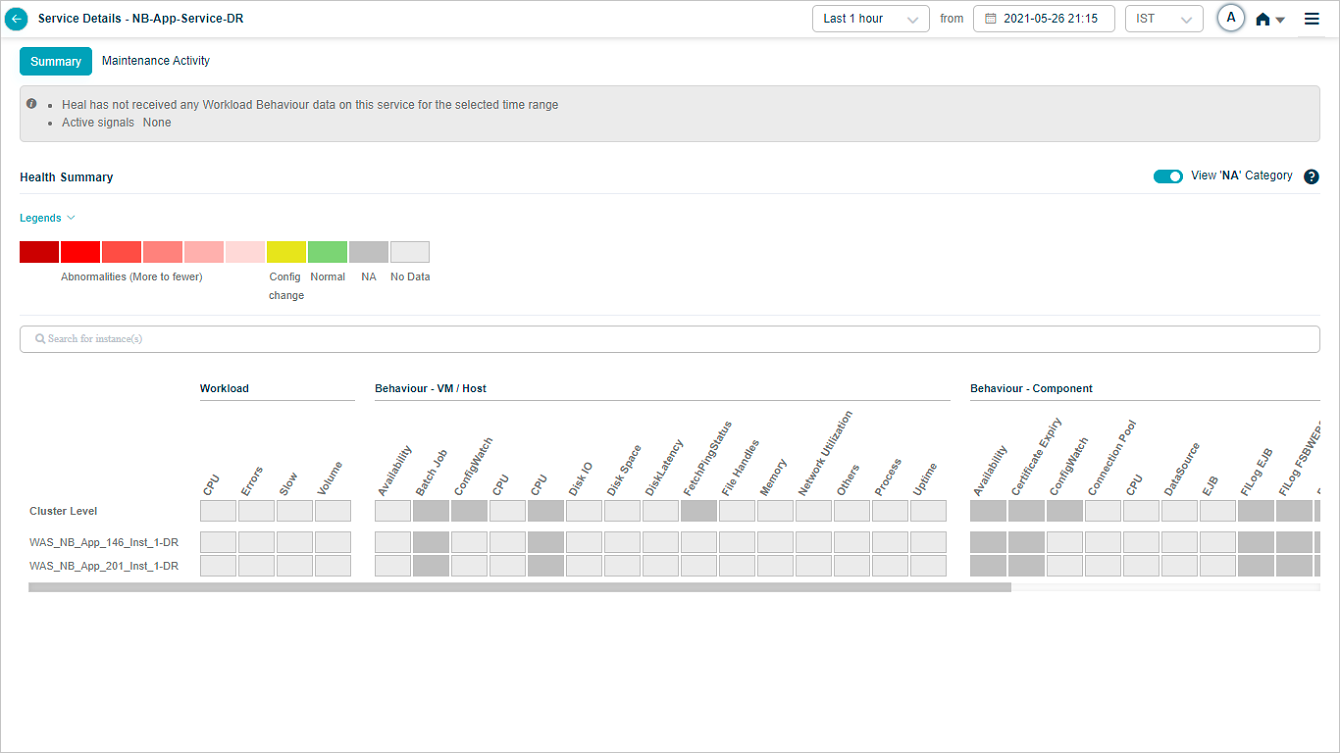
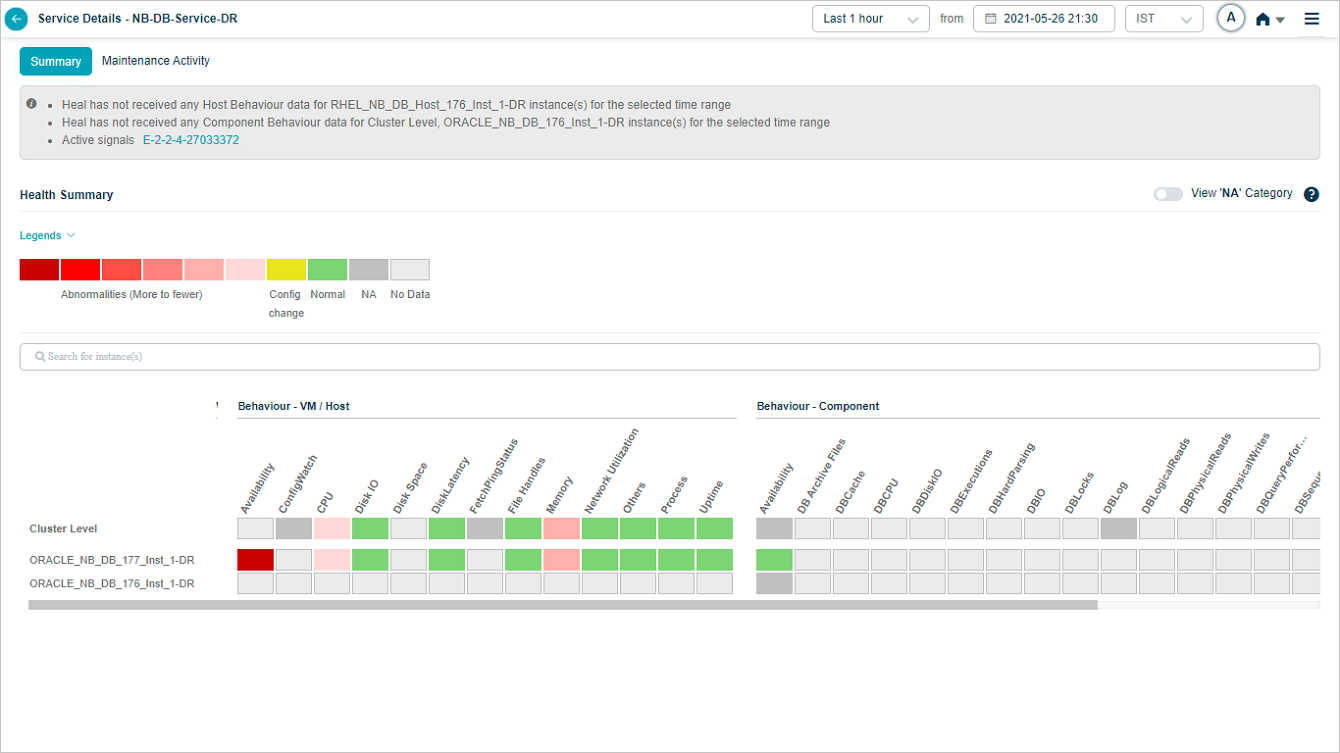
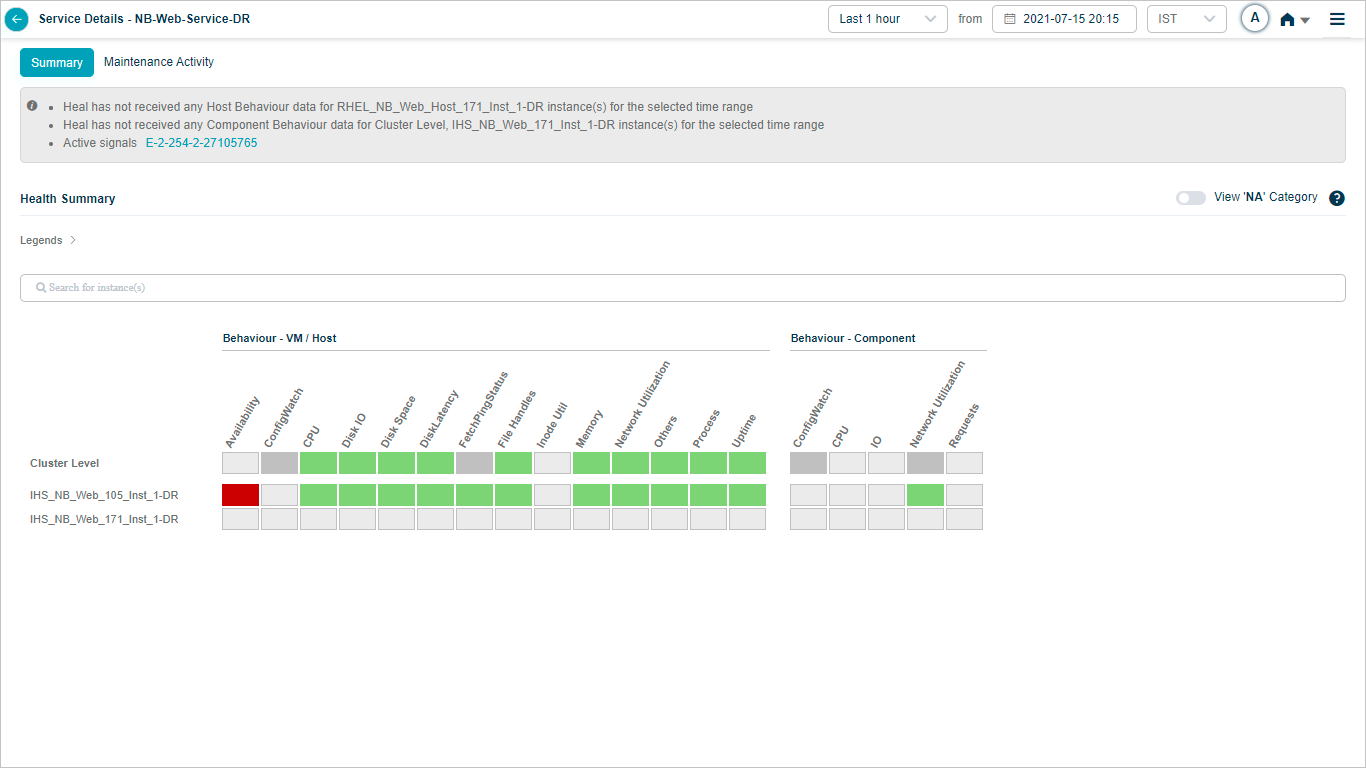
No Data for the Selected Time Range

When there are more instances, you can scroll across to view all the instances.

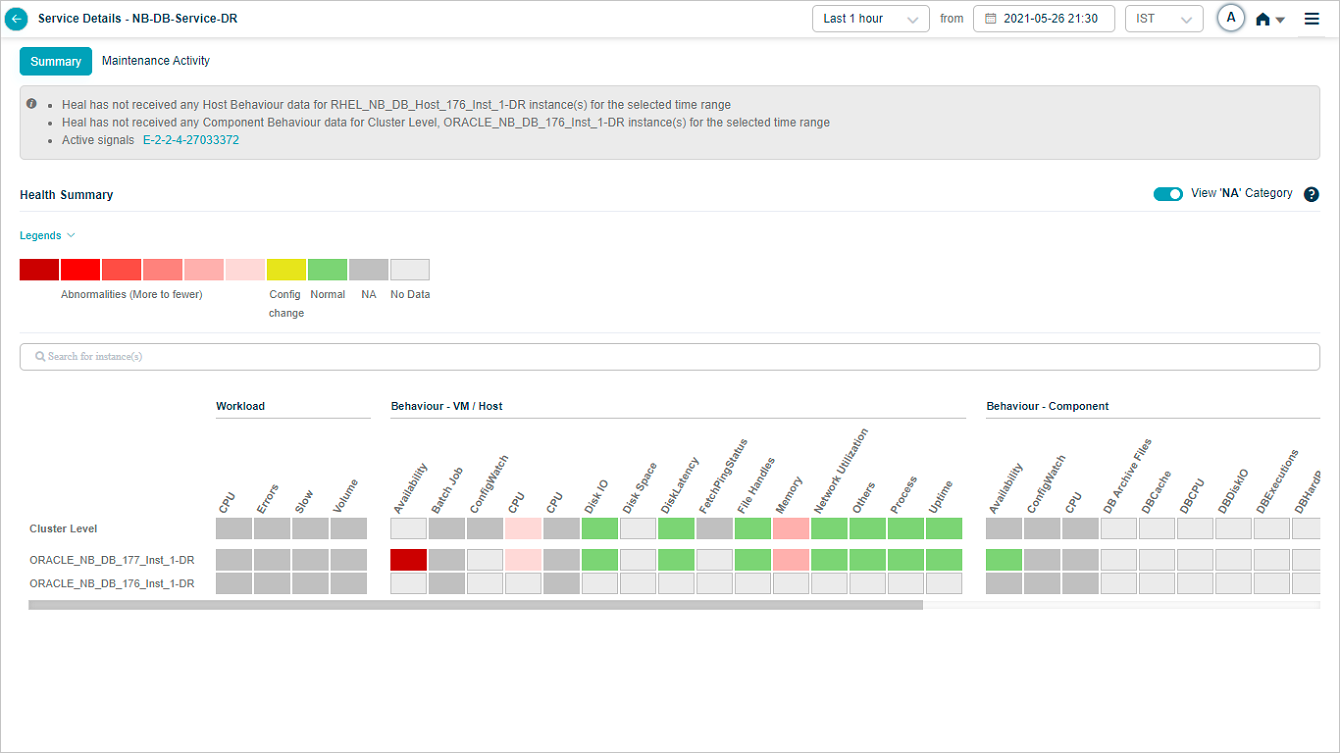
Showing or Hiding NA Categories
HEAL hides NA categories by default. Turn ON the slider to view the categories with all the KPIs at cluster and instance level as NA.
Enable NA Category
Enable NA Category
Enable NA Category
Enable NA Category
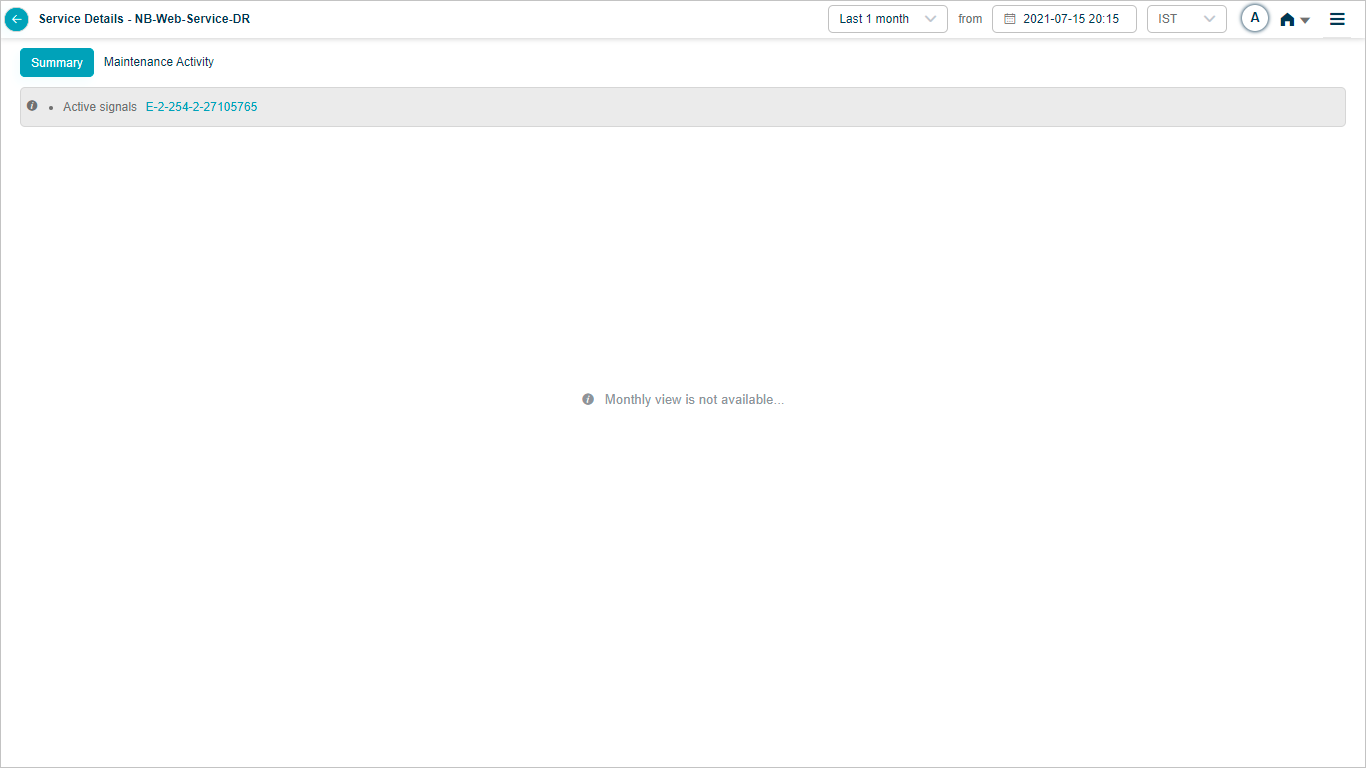
Heat Map Monthly Data
Monthly Heat Map
When you select Last 1 month in the duration box in the Service Details screen, then HEAL displays a message as per the following screen. HEAL does not display heal map data for the last 1 month period.
Monthly Heat Map
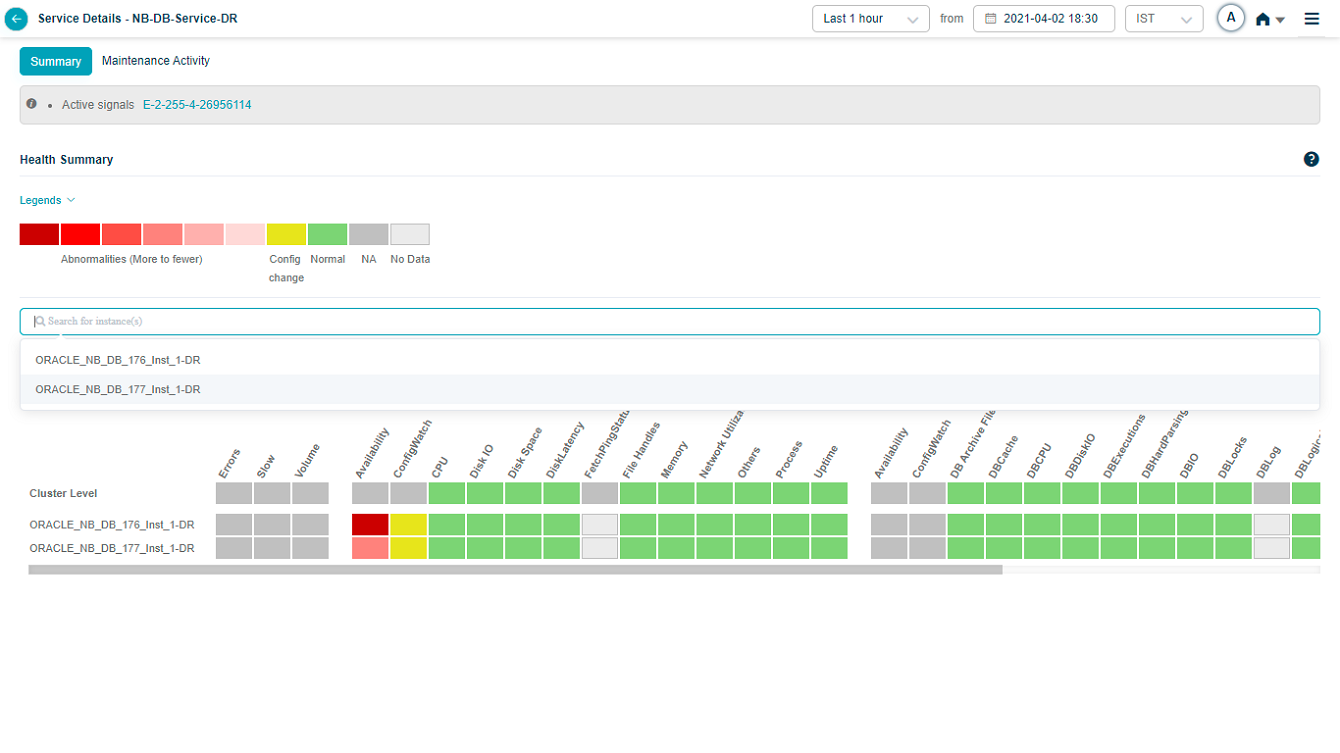
Searching For Instances
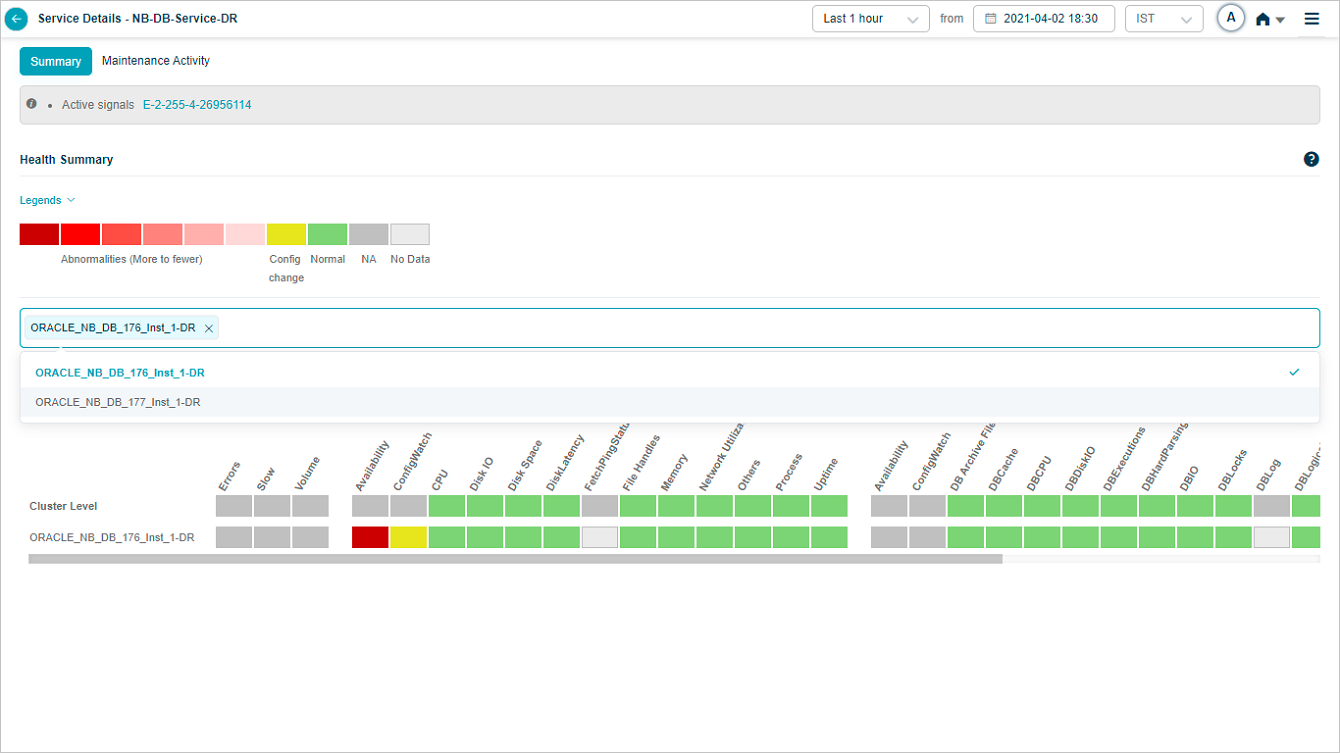
You can search for specific instance(s) of your choice in the Heat Map screen. It helps when there are multiple instances available. You can select single or multiple instances in the search box.
Heat Map_Specific Instance
Heat Map_Specific Instance
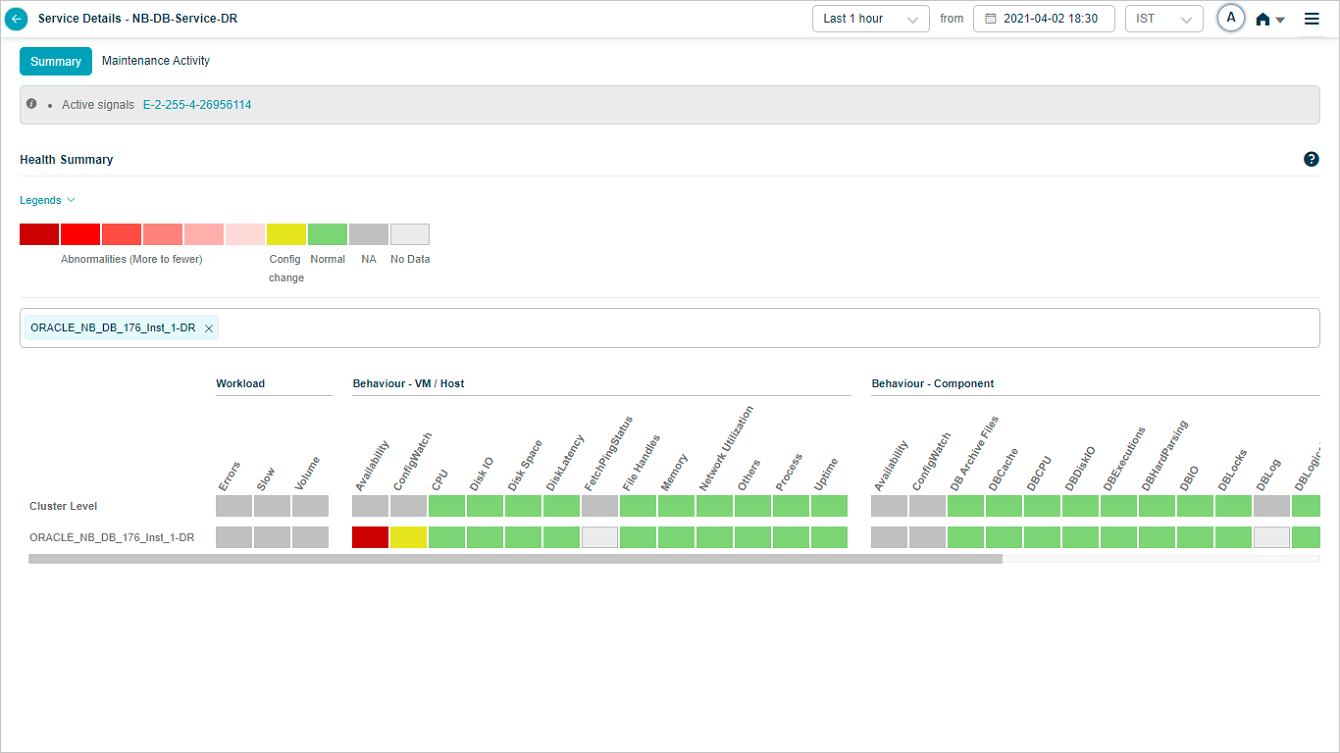
You can view data only for the selected instance(s).
Heat Map_Specific Instance
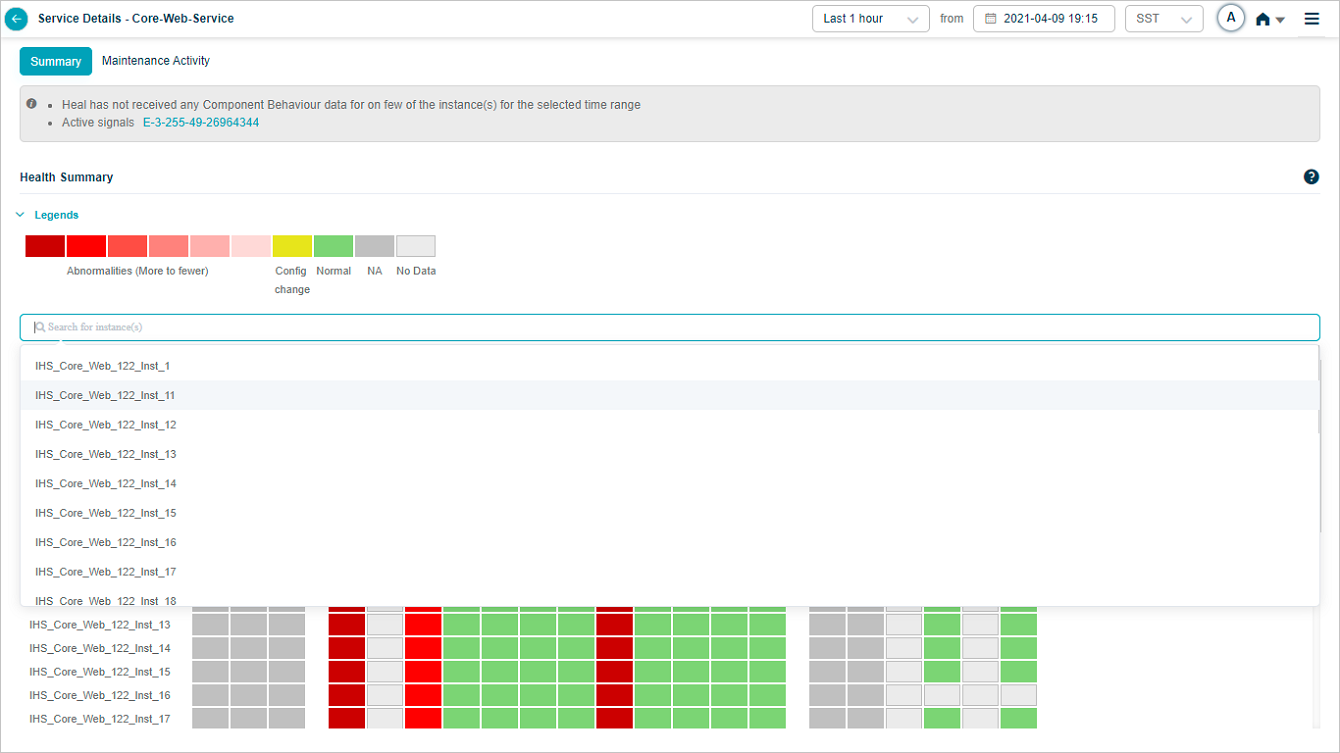
Heat Map_Specific Instance
Service Maintenance Details
When a service is under maintenance, collected data is processed and stored in the database. Service Heat Map displays the blocks in green when there are no events and data is available. Heat Map displays blocks in light grey color when data is not collected. Data is not used to generate events via SOR or NOR. Signals are not generated during this time period. If a Signal is open just before the maintenance window period begins, it is closed if all the services under the Signal are under maintenance. If only one service out of many in a Signal is under maintenance, then the Signal is not closed. If you select a time range in which the service is under maintenance, in the service details screen, the Heat Map displays the UM icon in Summary section.
Service Details screen displays host and component instances below Cluster Level. Component instances may belong to different hosts; or few component instances may belong to the same host.
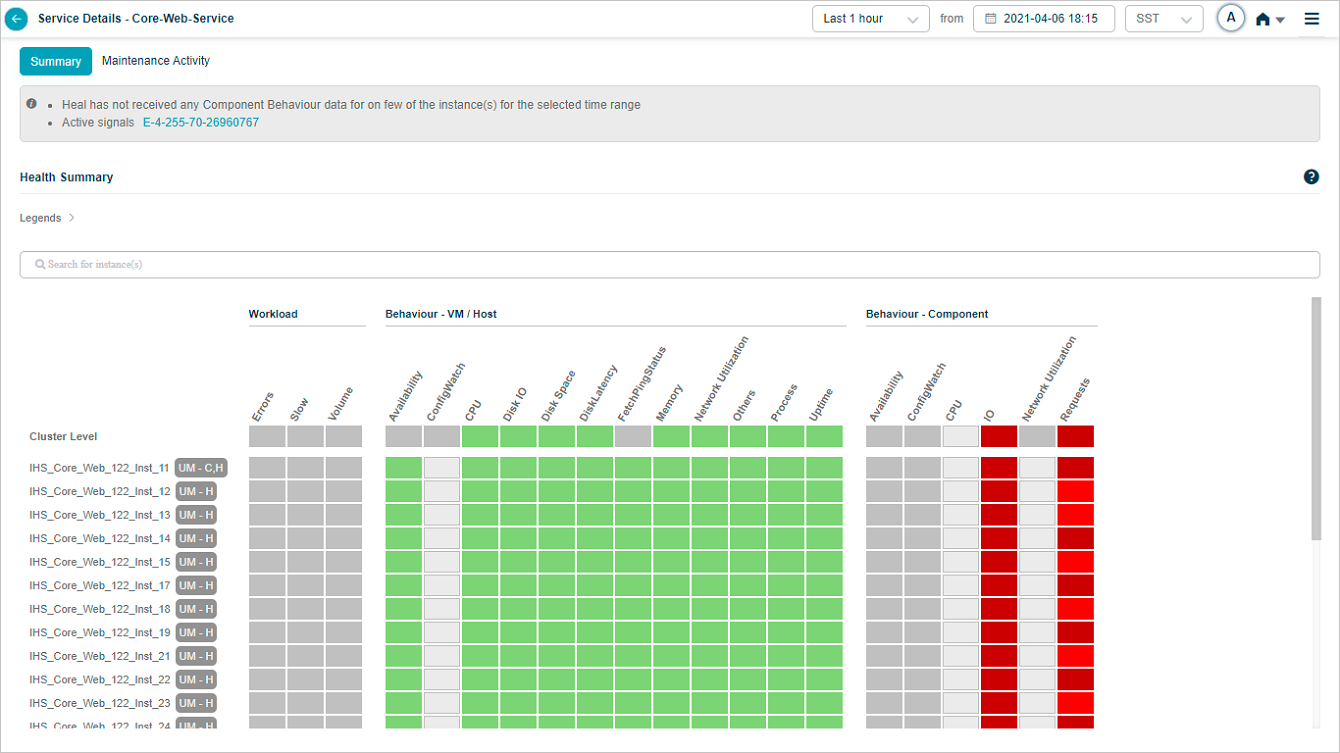
Service Maintenance Details
UM – C : This indicates that only a particular component instance is under maintenance.
UM – H : This indicates that only a particular host instance is under maintenance.
UM – C,H : This indicates that all the component instances running on the host and also the host are under maintenance.
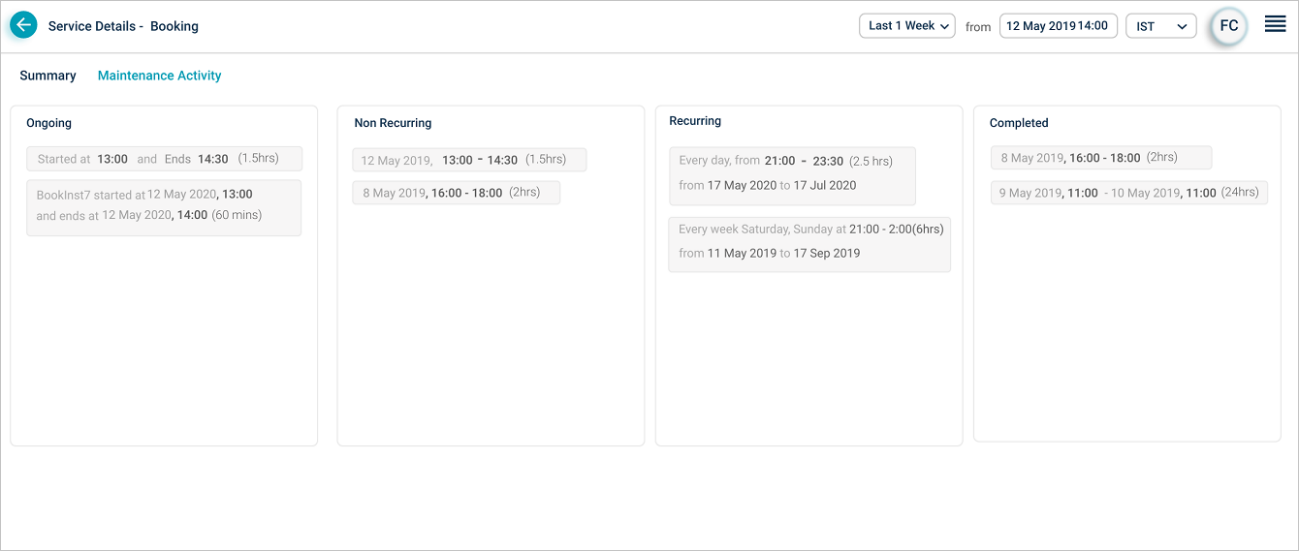
A service can have multiple maintenance windows set. The Maintenance Activity section displays Ongoing, Non-Recurring, Recurring, and Completed windows.
- Ongoing – This displays the time period for the current active maintenance activity for the service.
- Non-Recurring – This displays the date and time of one time maintenance activities for the service.
- Recurring – This displays the recurring maintenance pattern details. It displays the daily, weekly, and monthly maintenance windows set for the service.
- Completed – This displays the date and time of the finished maintenance windows for the service.
Scheduled and Ad hoc Maintenance
Service Details
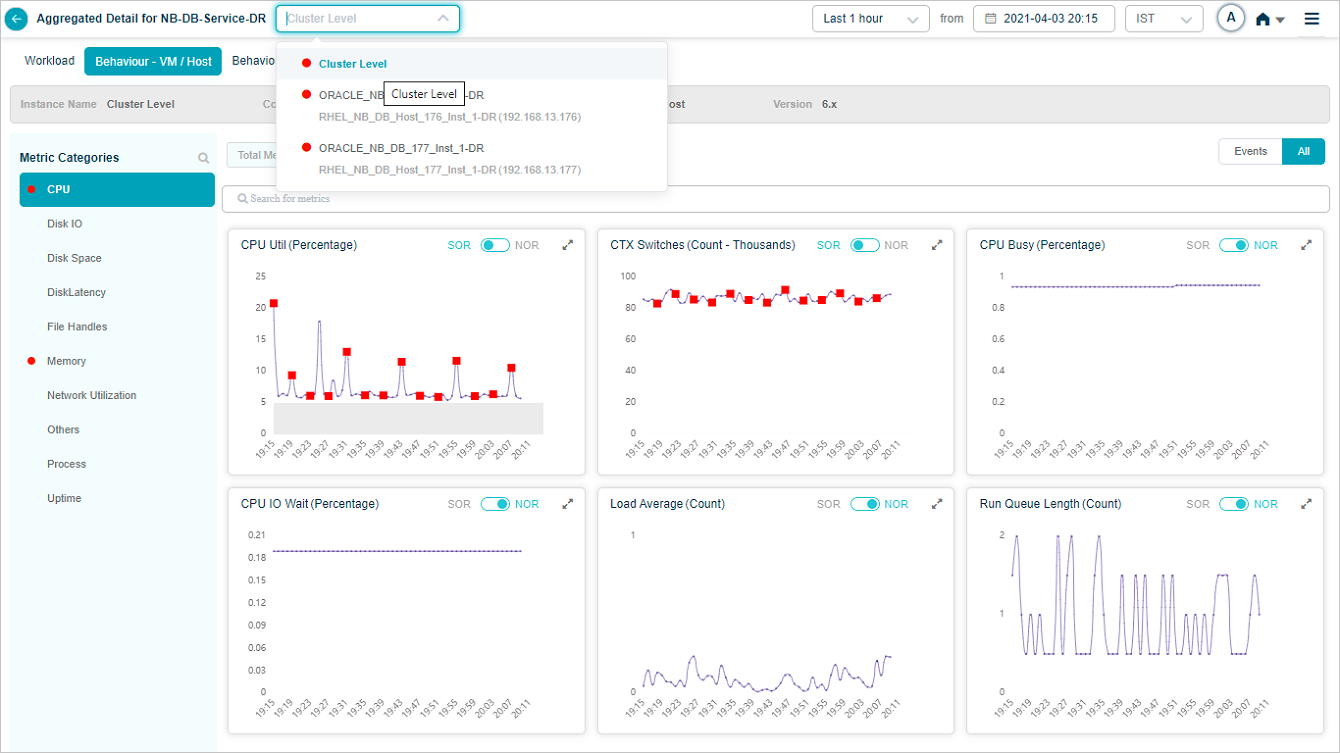
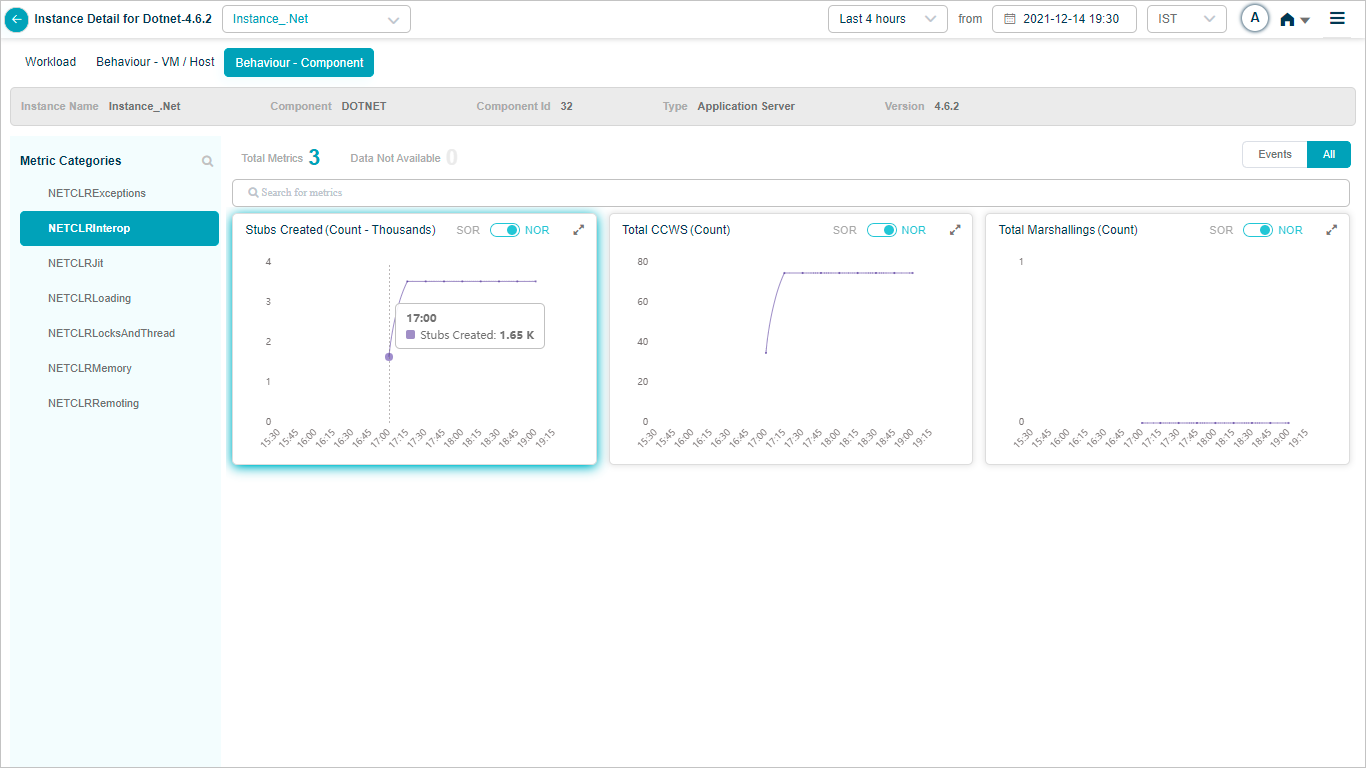
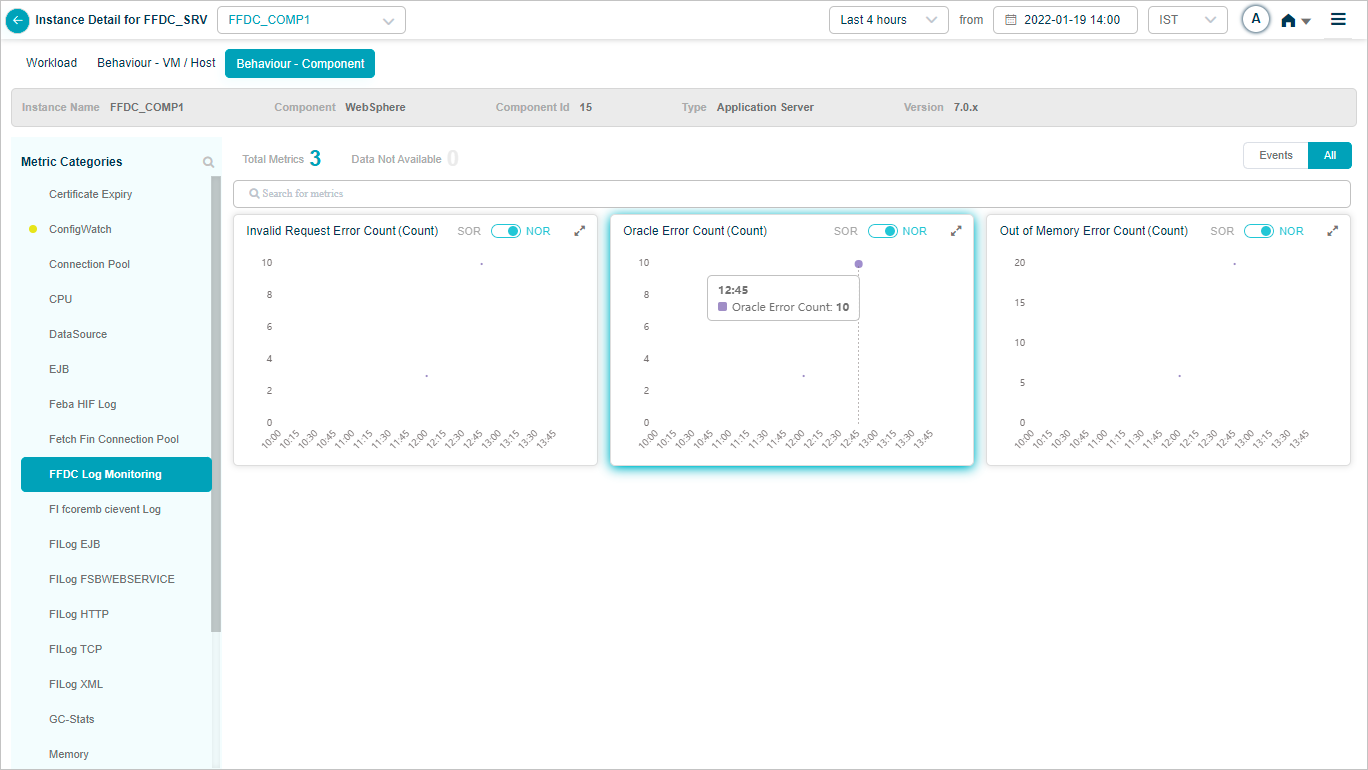
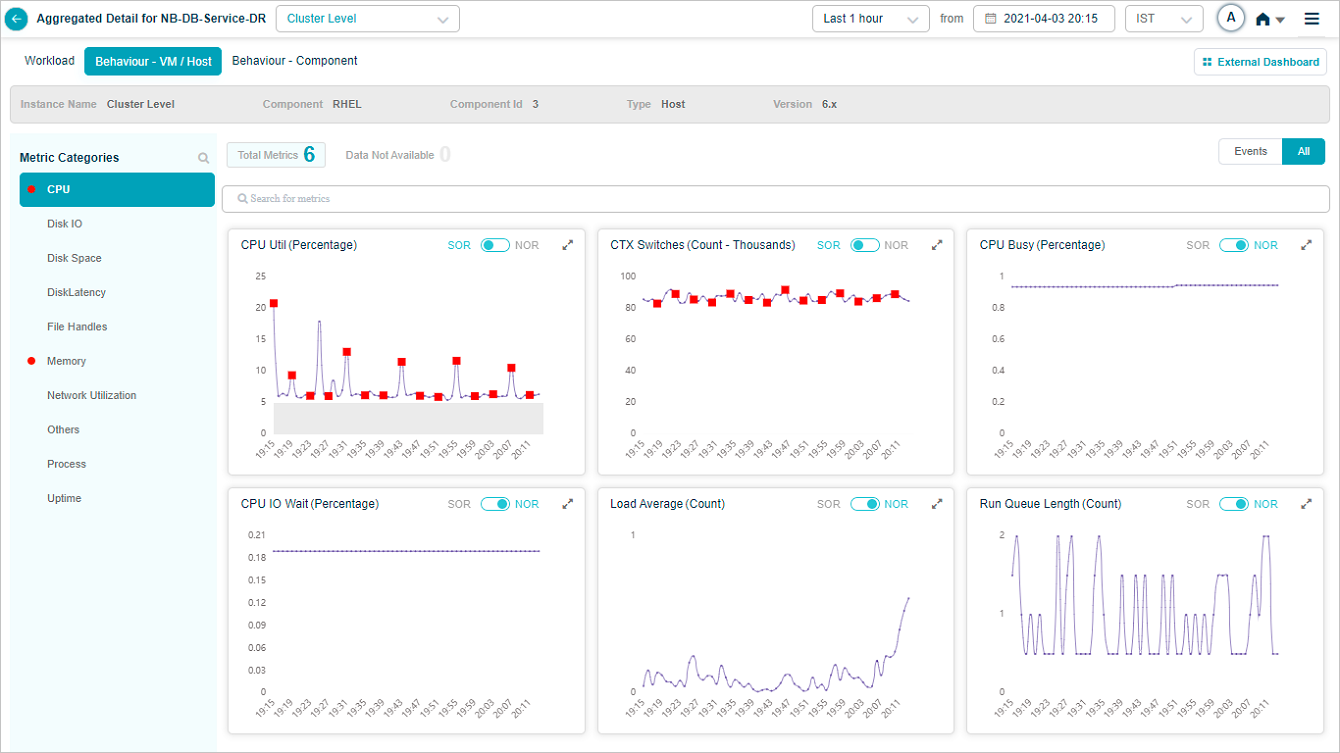
KPI Data at Cluster/Instance Level
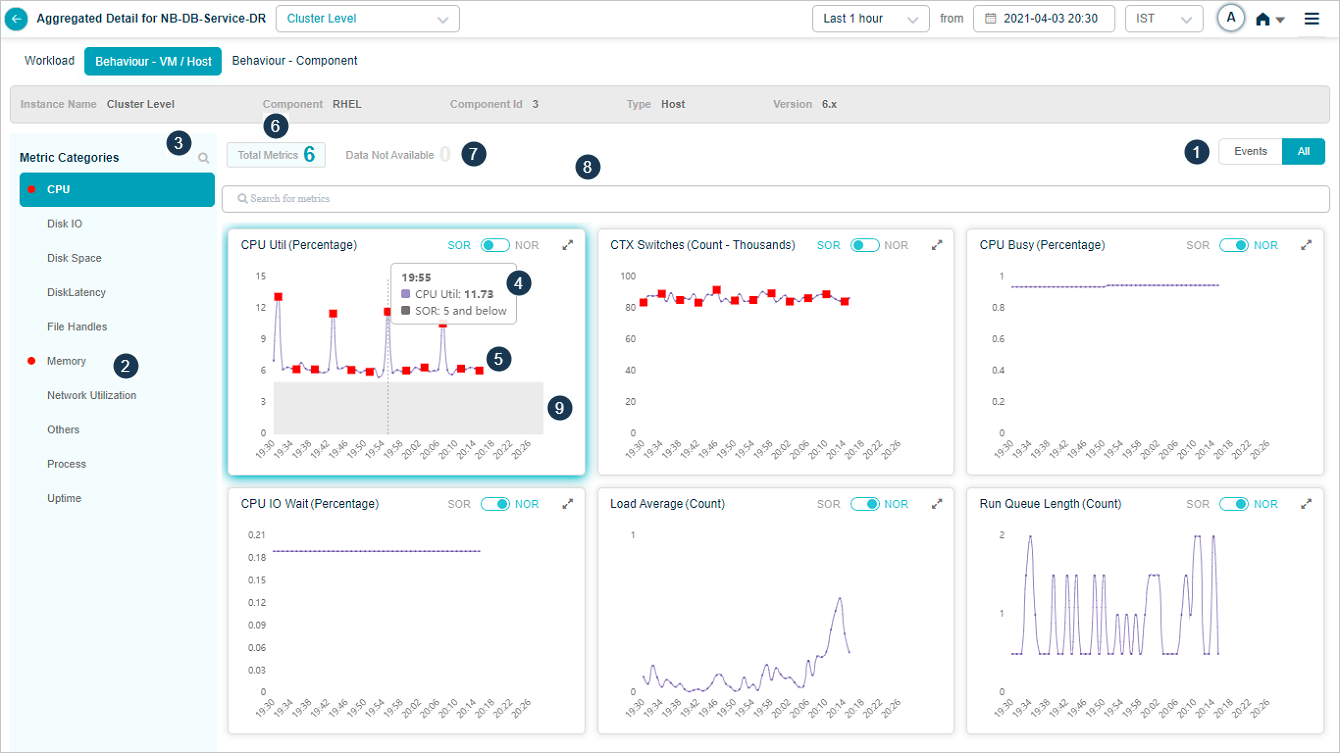
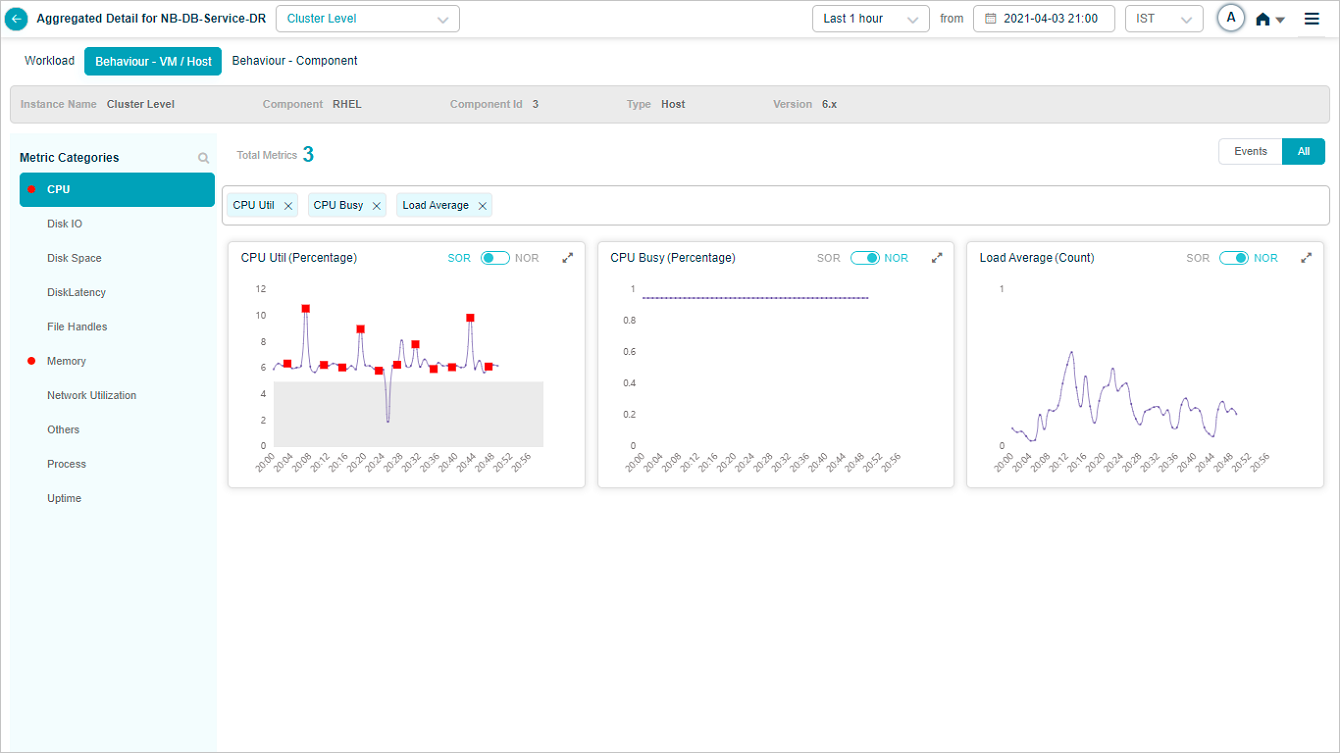
Select on a KPI category in overview heat map to bring up the metrics related to that KPI category. On select of CPU category at cluster or instance level displays this screen. It brings up CPU related metrics.
Drop box near the service name at the top of the screen contains all the instance names. You can choose a specific instance to navigate to the screen of the respective instance to view those details.
KPI Data_Instance Level
KPI Data_Instance Level
| 1 | If        event(s) is there on a KPI category, then Events option is selected by default. When there is no event, then ALL option is selected as default. KPIs with events are shown first followed by KPIs without any event. event(s) is there on a KPI category, then Events option is selected by default. When there is no event, then ALL option is selected as default. KPIs with events are shown first followed by KPIs without any event. |
| 2 | All service behavior-related metrics are available here, arranged by categories. A Red circle is displayed next to the category name if any event is generated for the category. The Amber circle is displayed next to Config Watch category if there are any configuration changes. |
| 3 | Search option to search for categories. KPIs under that category show up post search. If a non-group KPI is not part of any category, then it is placed under category “Others”. |
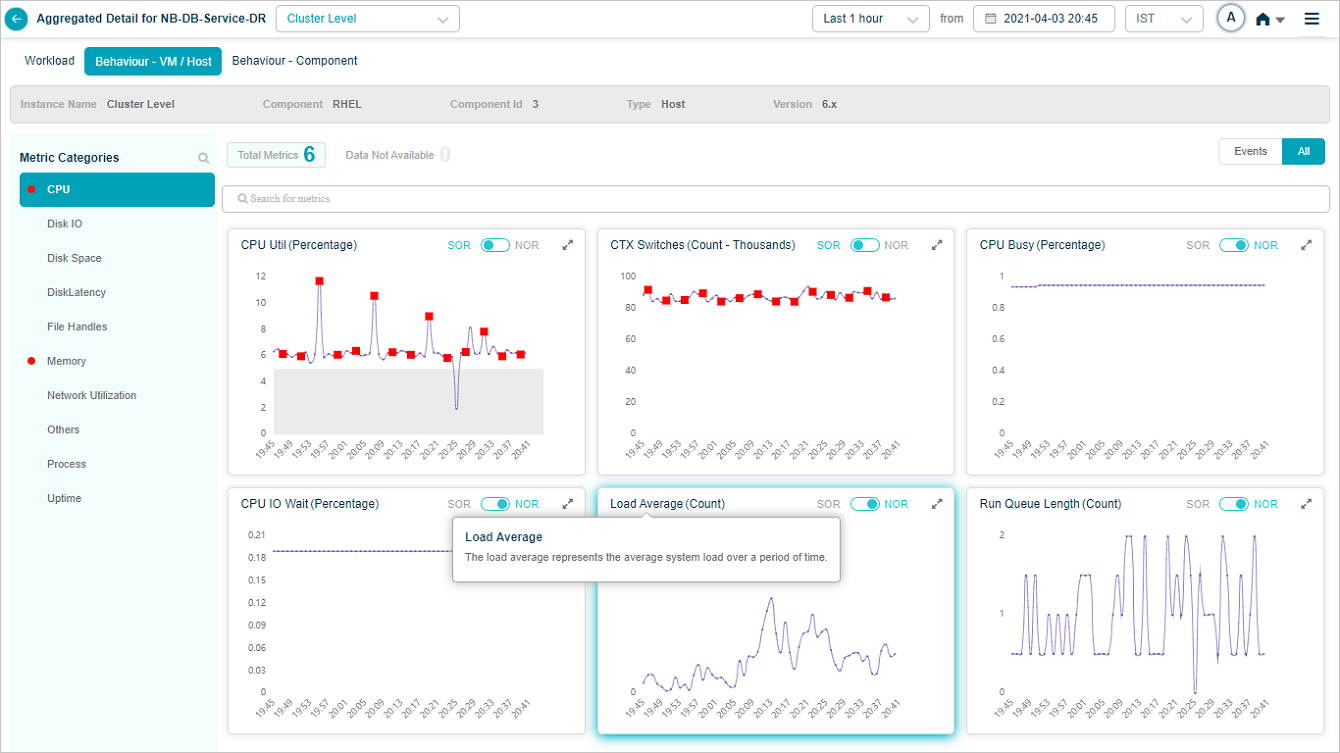
| 4 | Hover on the dots to see KPI value for that time interval. This displays time instance in the top. Value indicates the actual KPI value at that time instance. Normal operating range (NOR) is defined by MLE. Admin can define Static Operating Range (SOR) using Control Center. |
| 5 | Events are highlighted as Red dots. Hovering on an event brings up specifics. |
| 6 | The total number of pods as part of this category containing data. |
| 7 | Total number of pods as part of the category which don’t contain data. |
| 8 | Search for KPIs within a category. Only the selected KPIs show up post search. |
| 9 | NOR and SOR bands are highlighted in the grey. For the Last 1 hour and Last 30 mins, HEAL displays minute KPI data. The SOR band is visible if configured. For a time period greater than 1 hour, rolled-up data is displayed depending on the time period selected. For example, for the Last 4 hours, 15 minutes data roll-up is displayed. For the Last 24 hours, 1 hour data roll-up is displayed. SOR and NOR bands are not displayed, even though events are visible. When SOR and NOR values are available, NOR is default selected and the slider is enabled. When none of them are available, NOR is default selected and the slider is disabled. When one of them is available, the slider shows the available option. |
Select Data Not Available to view the pods of the metrics which don’t contain data as displayed in following screen.
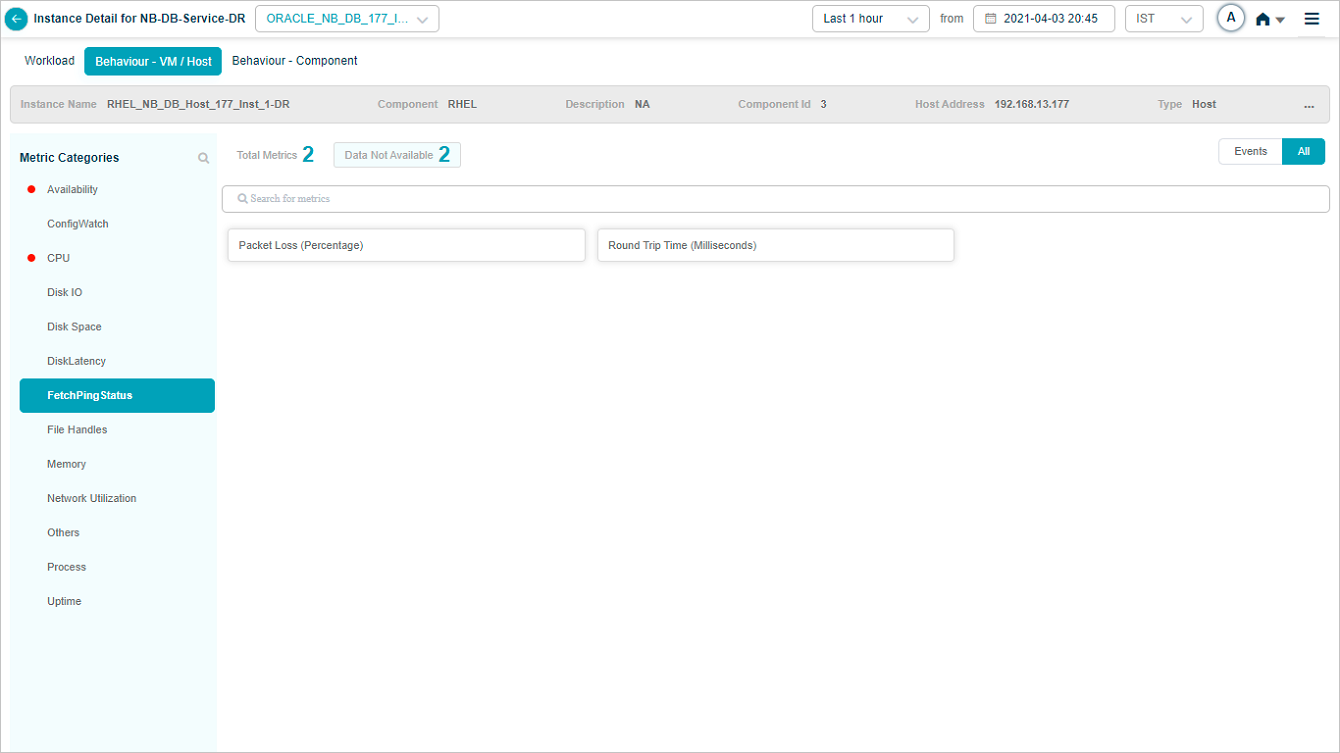
Metric – FetchingStatus
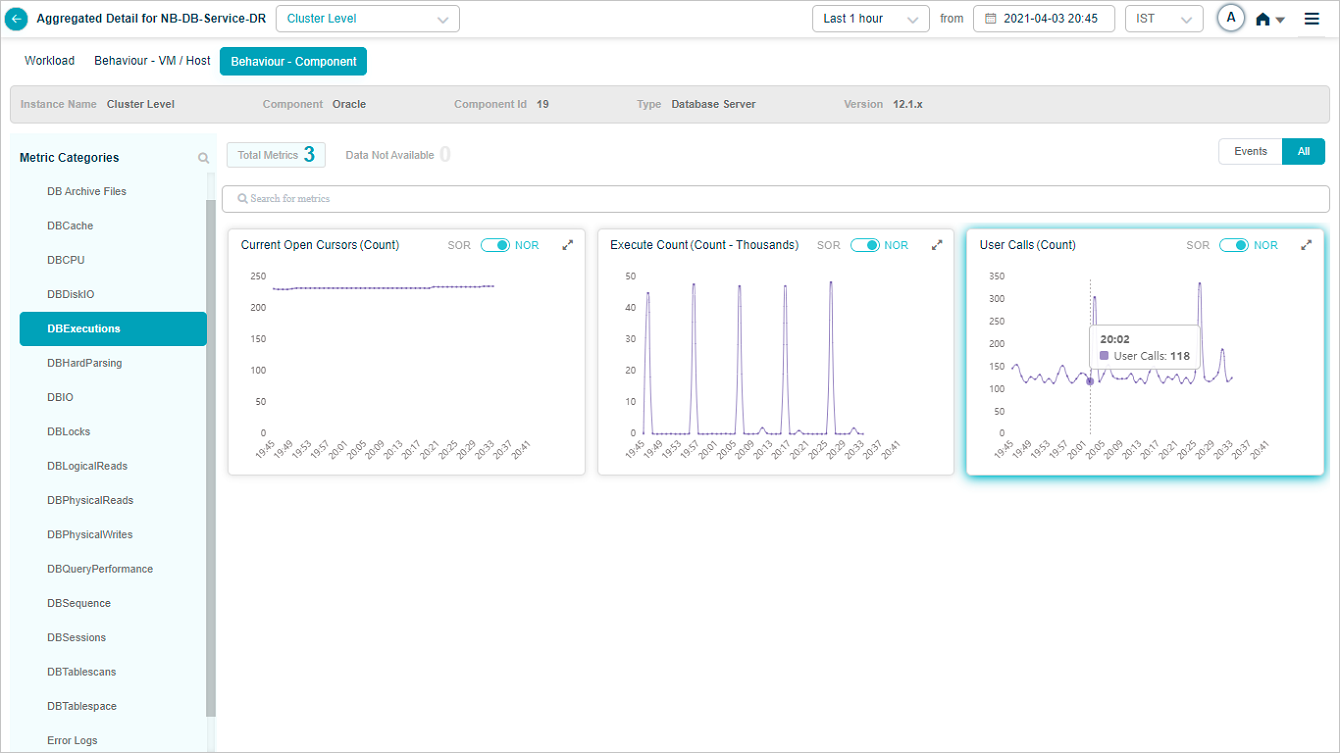
Metric – DBExecutions
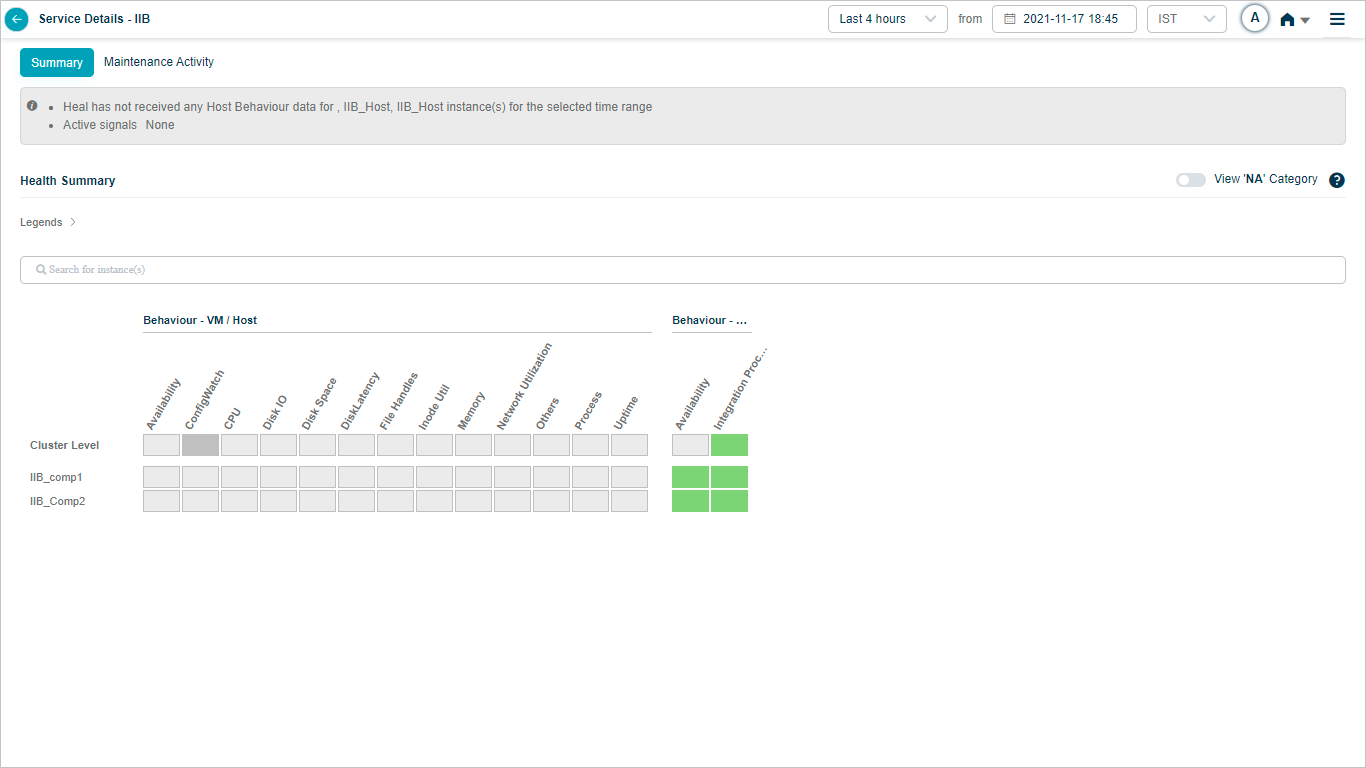
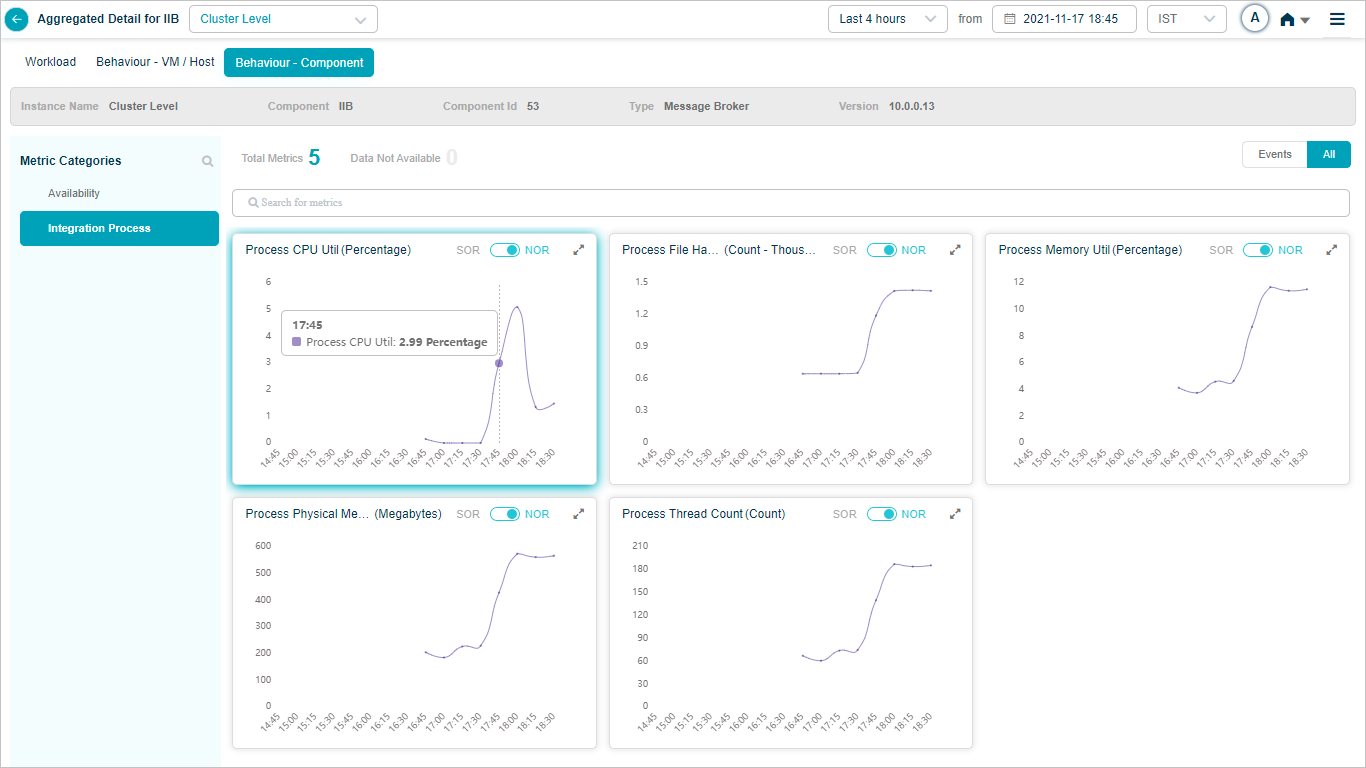
When you map IIB component instances to IIB component using Control Center, you can view IIB KPIs in HEAL.

Metric – Integration Process
Metric – Integration Process
If you need to monitor Kafka associated Zookeeper KPIs in HEAL, then map Zookeeper component instances to Zookeeper component using Control Center.
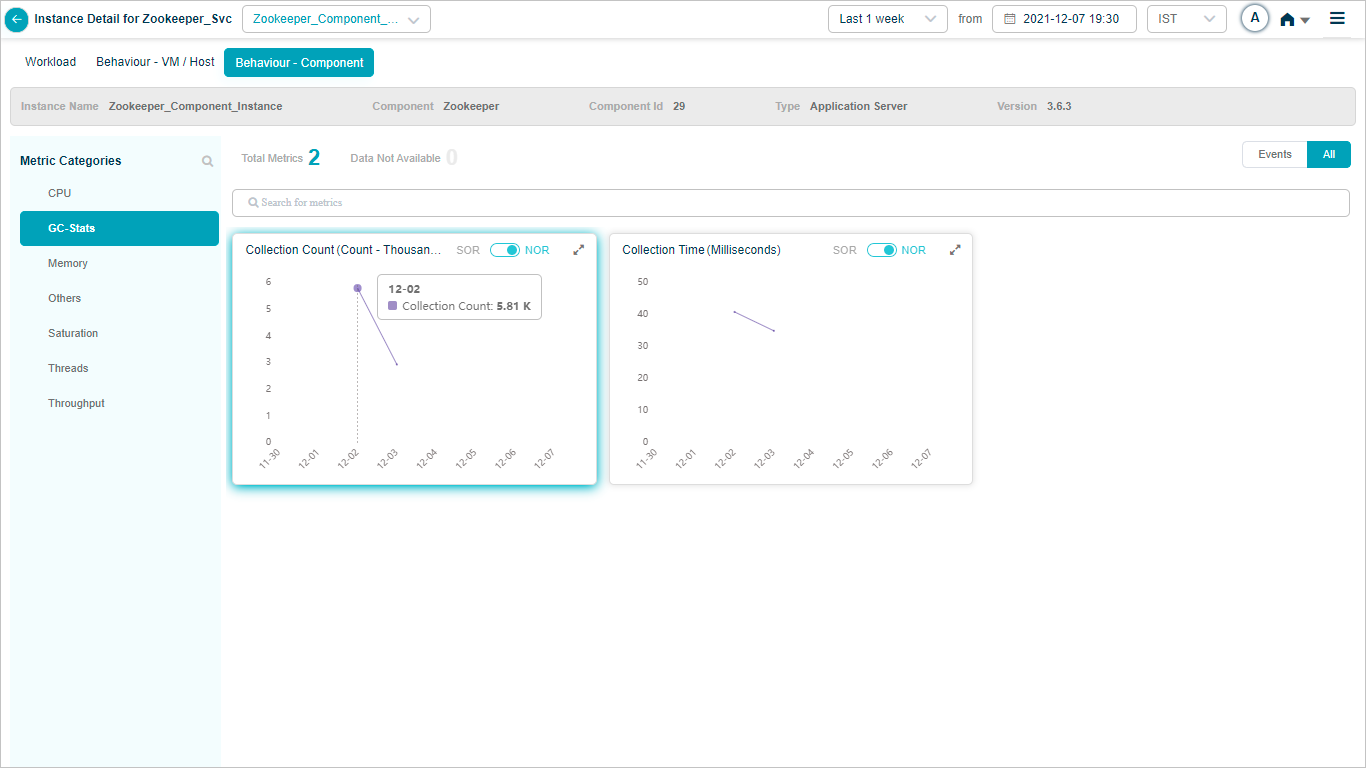
Metric – GC-Stats
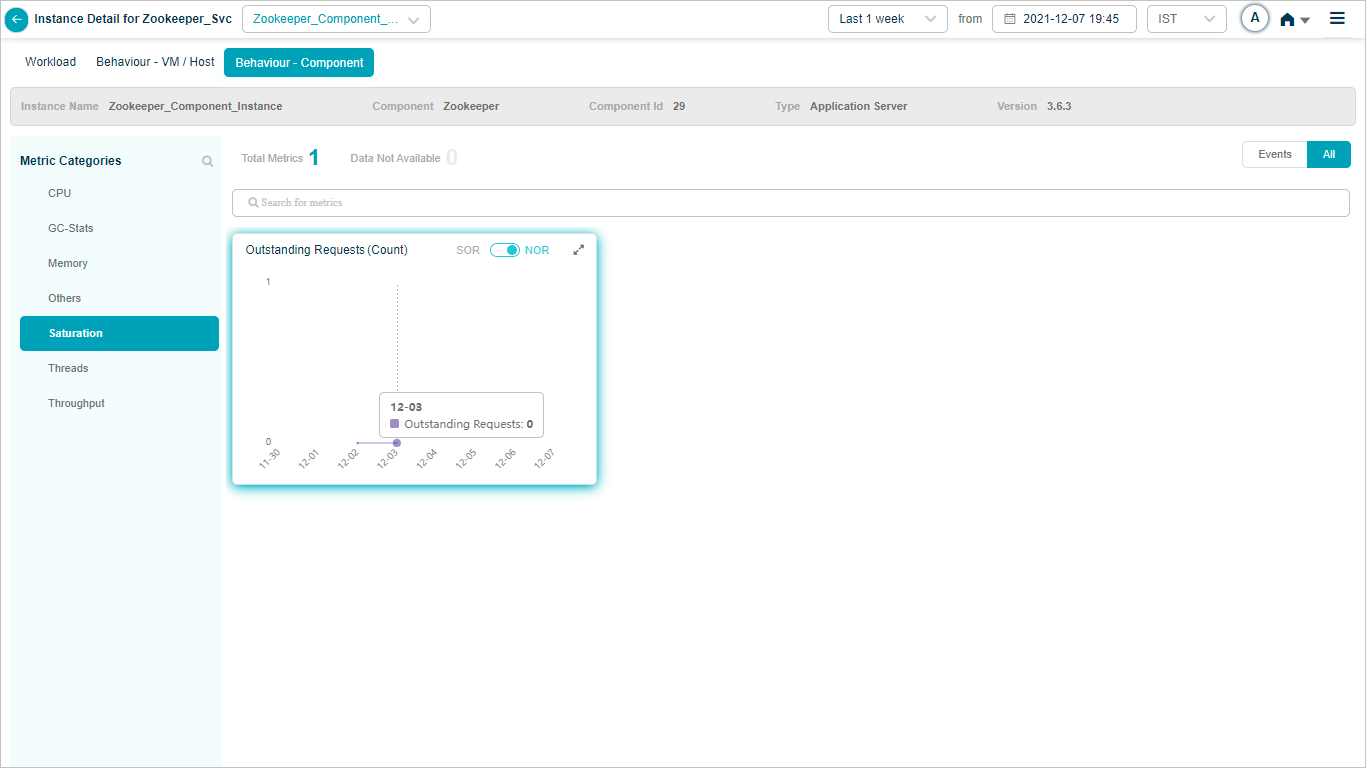
Metric – Saturation
When you map Kafka component instances to Kafka component using Control Center, you can view Kafka KPIs in HEAL.
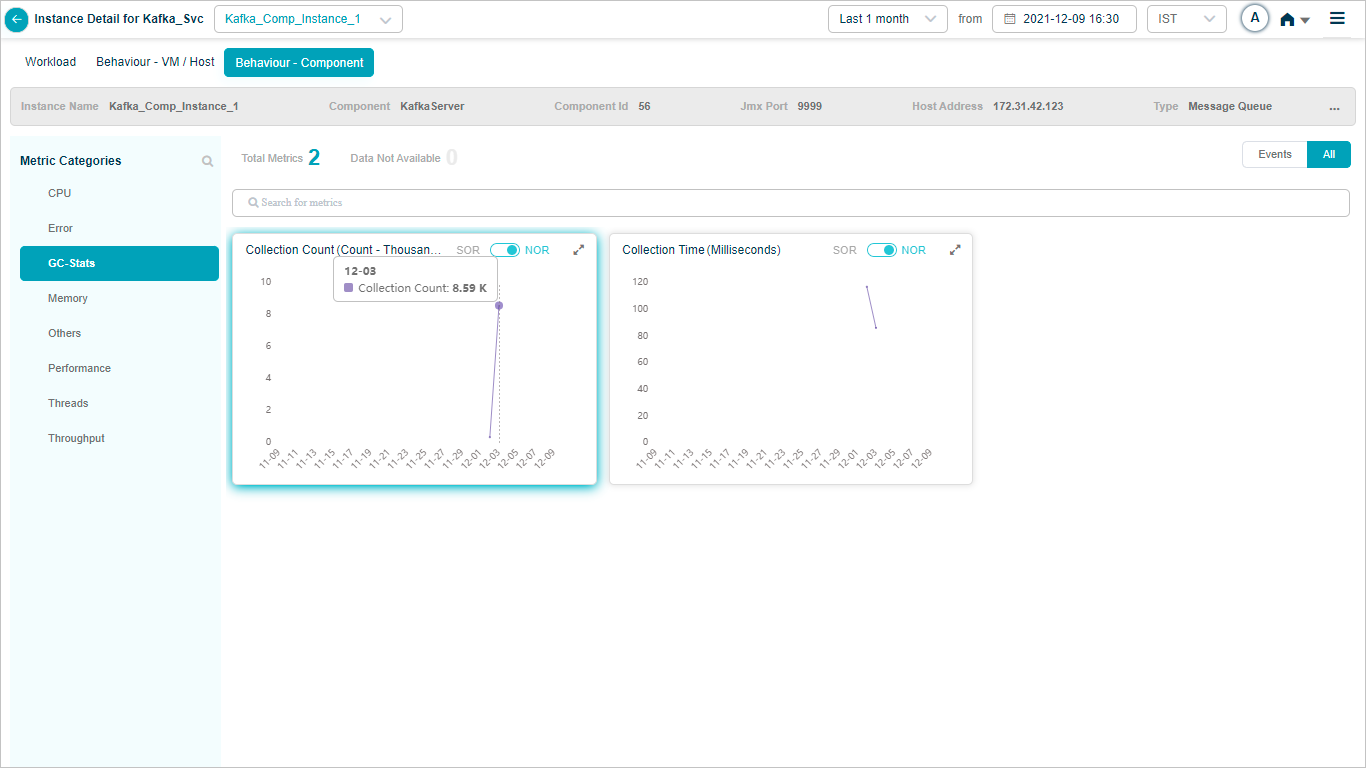
Metric – GC-Stats

When you map SAN_NAS instances to IBM storage component using Control Center, you can view IBM Storage KPIs in HEAL.
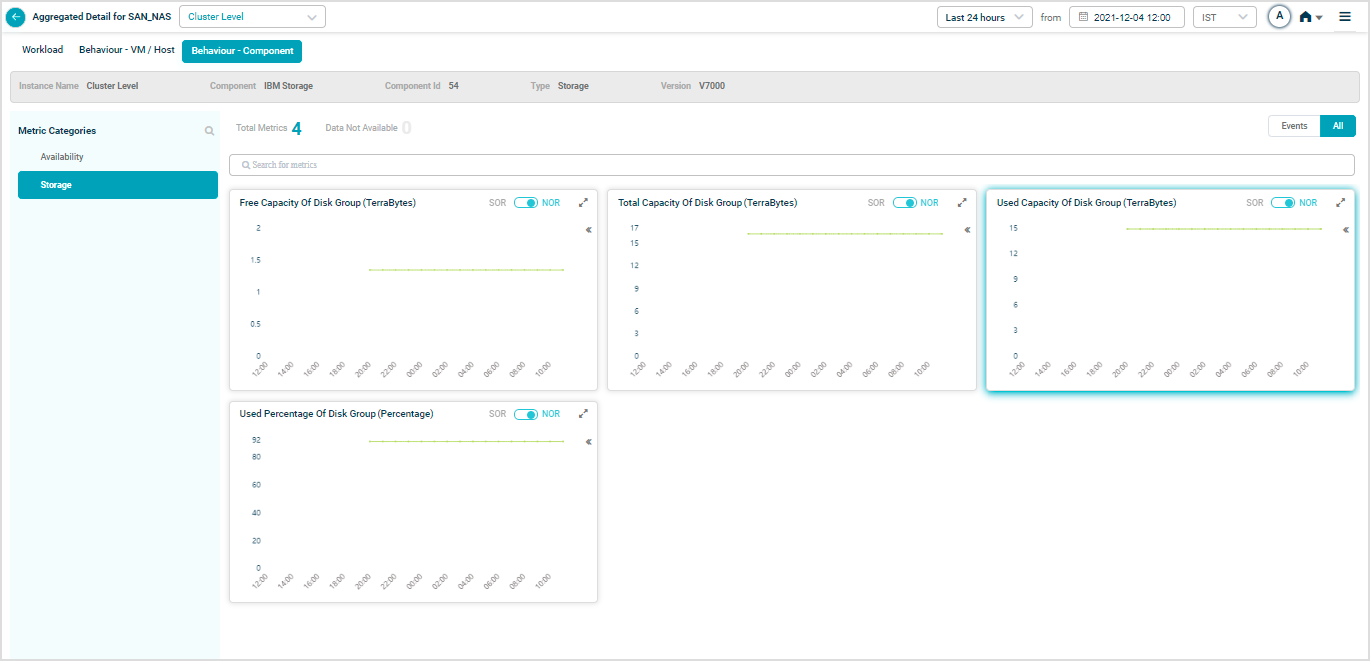
Storage
Sample Components with respective KPIs
Sample components with respective KPIs are given below.
DOTNET KPIs
When you map DOTNET component instances to DOTNET component using Control Center, you can view DOTNET KPIs in HEAL.
Health Summary
Metric – NETCLRInterop
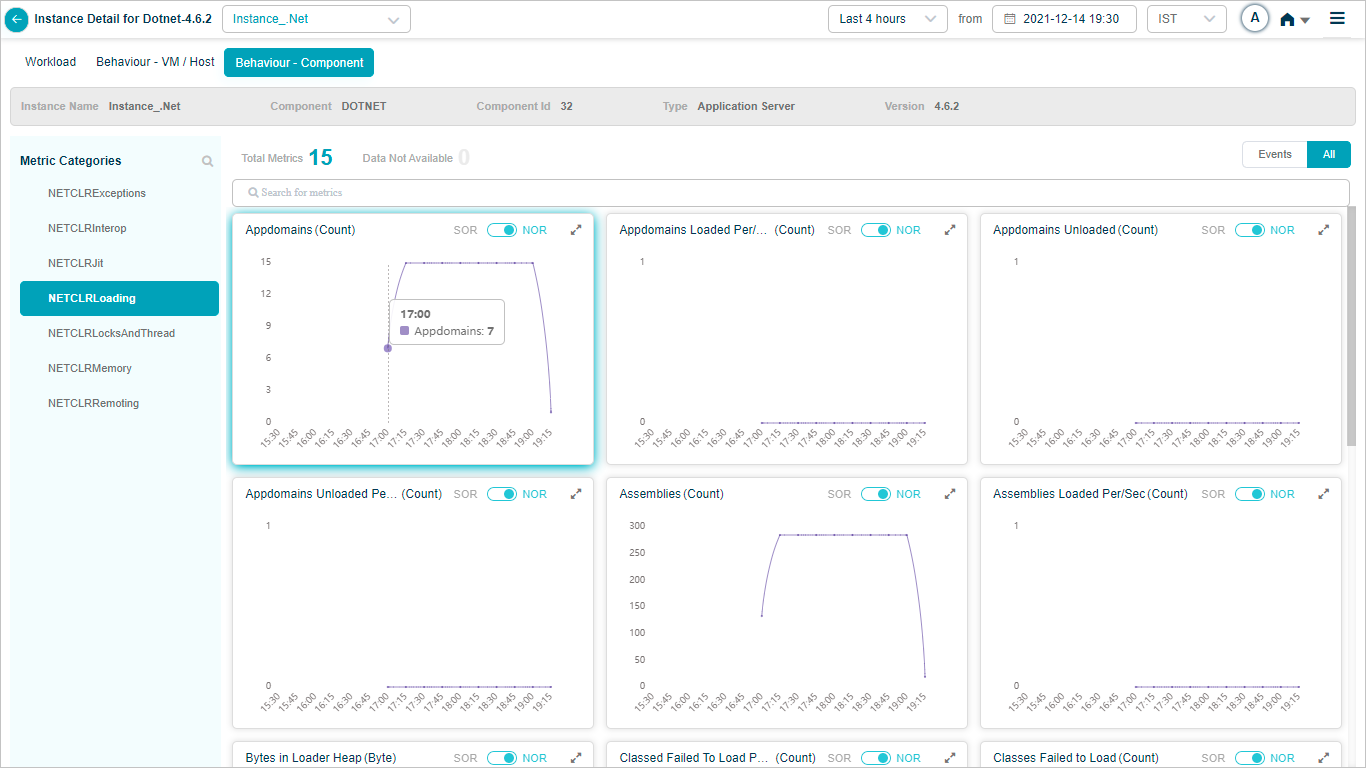
Metric – NETCLRLoading
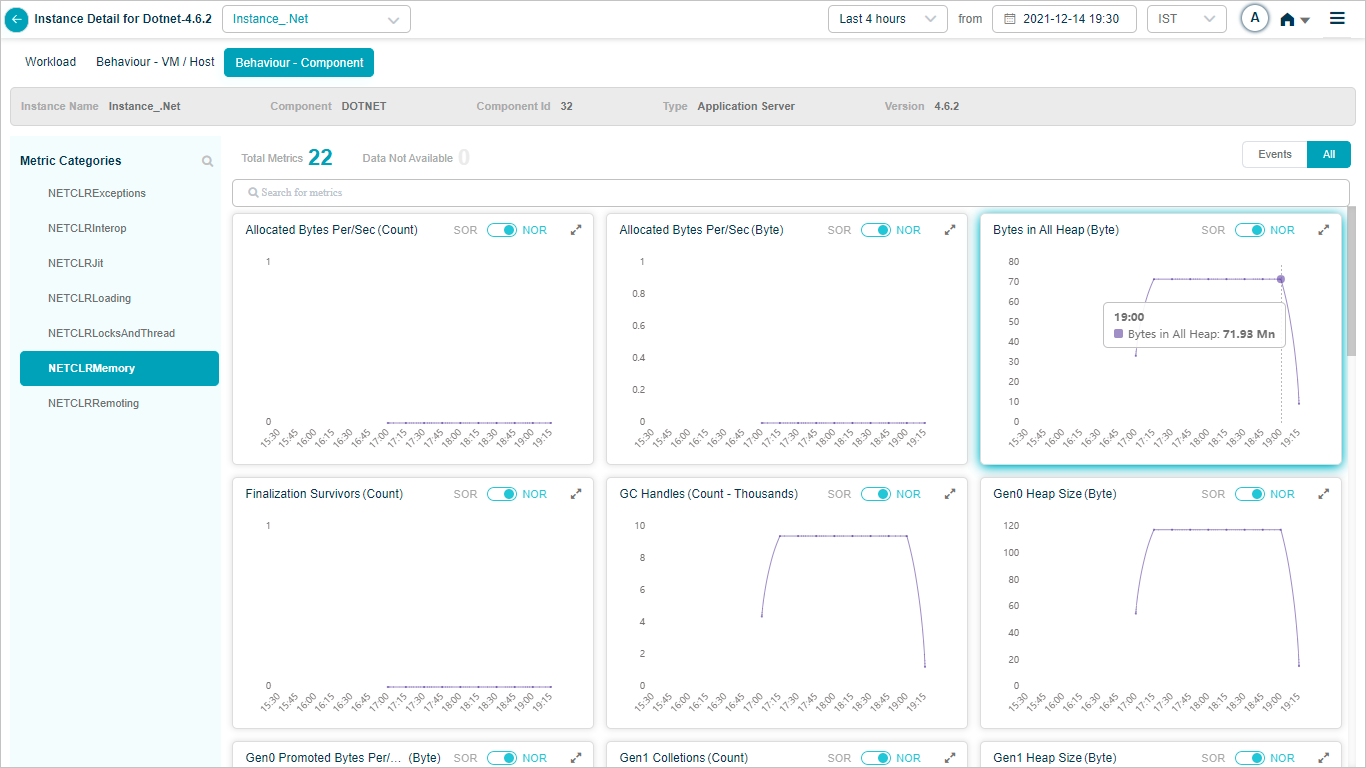
NETCLRMemory
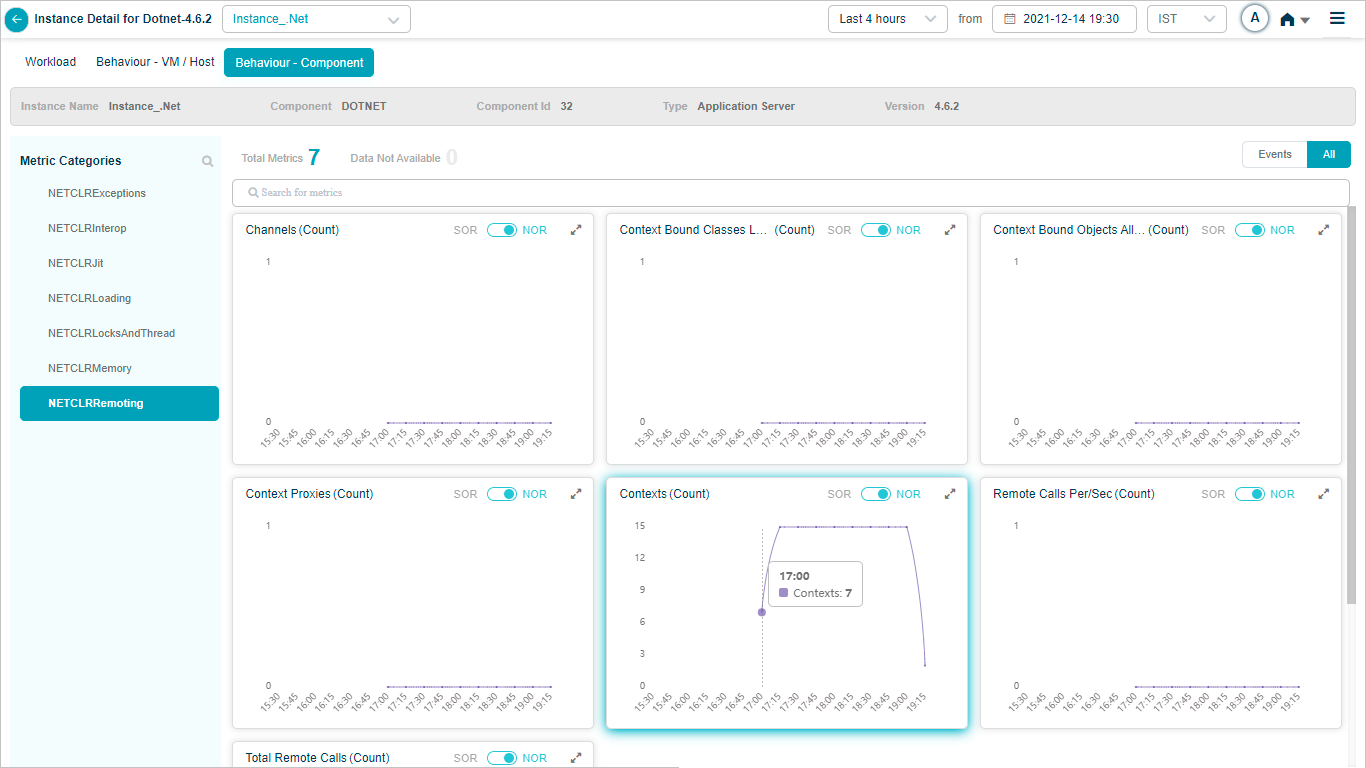
NETCLRRemoting
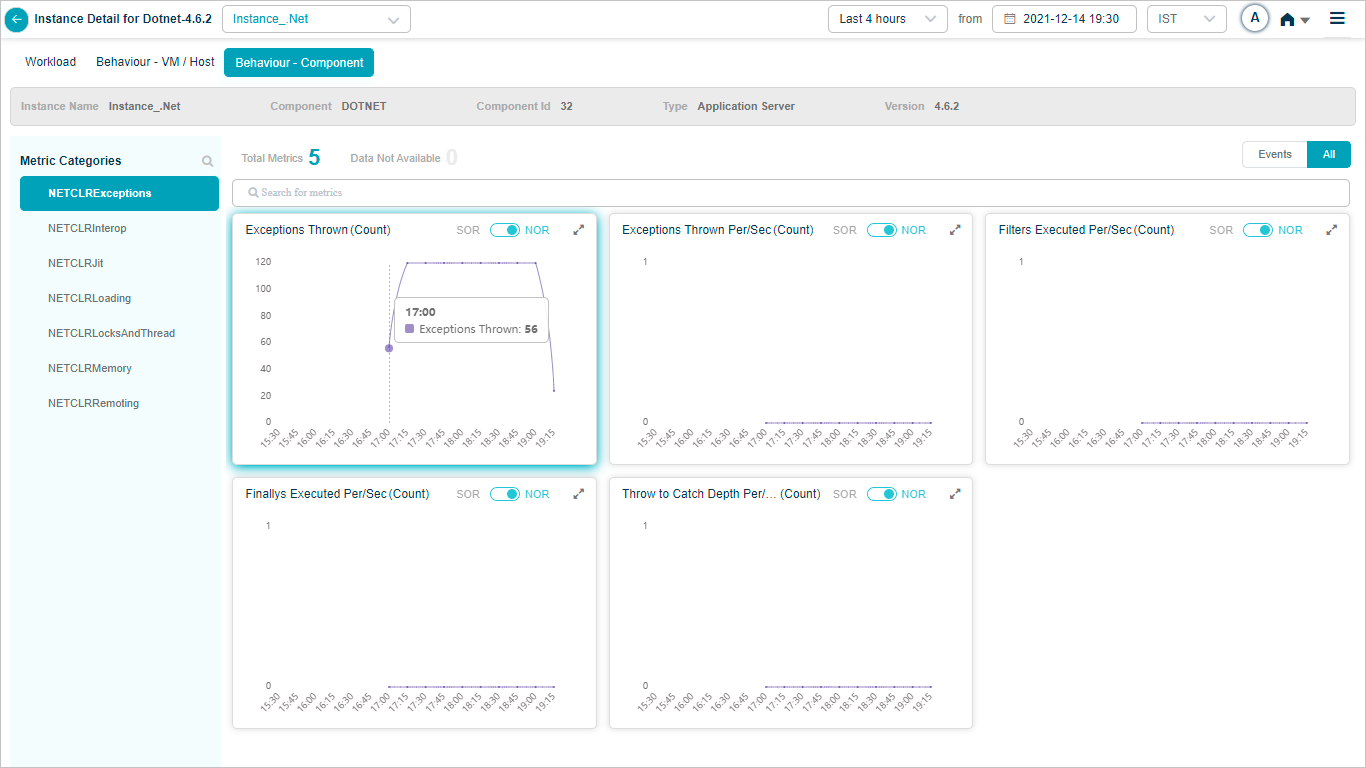
Metric – NETCLRExceptions
Mongo DB KPIs
When you map Mongo DB component instances to Mongo DB component using Control Center, you can view Mongo DB KPIs in HEAL.
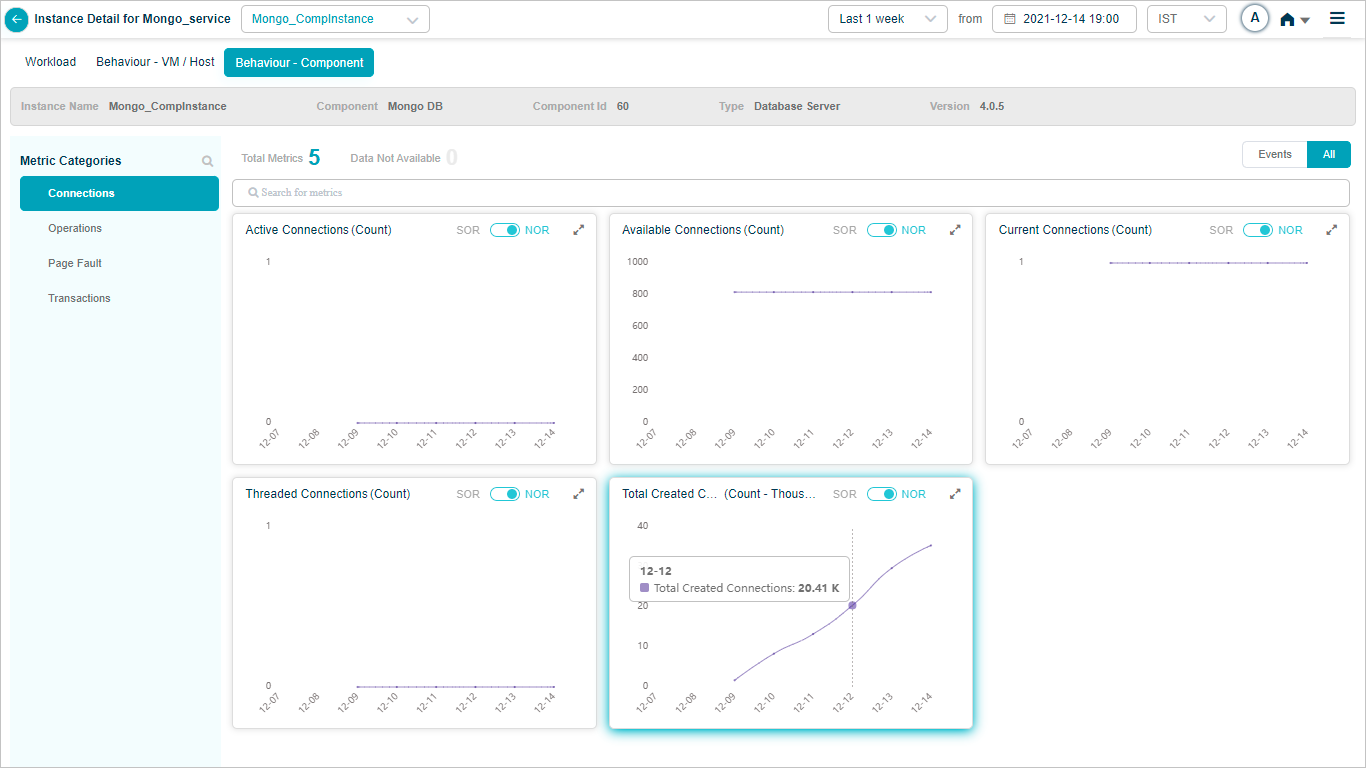
Mongo_CompInstance – Connections
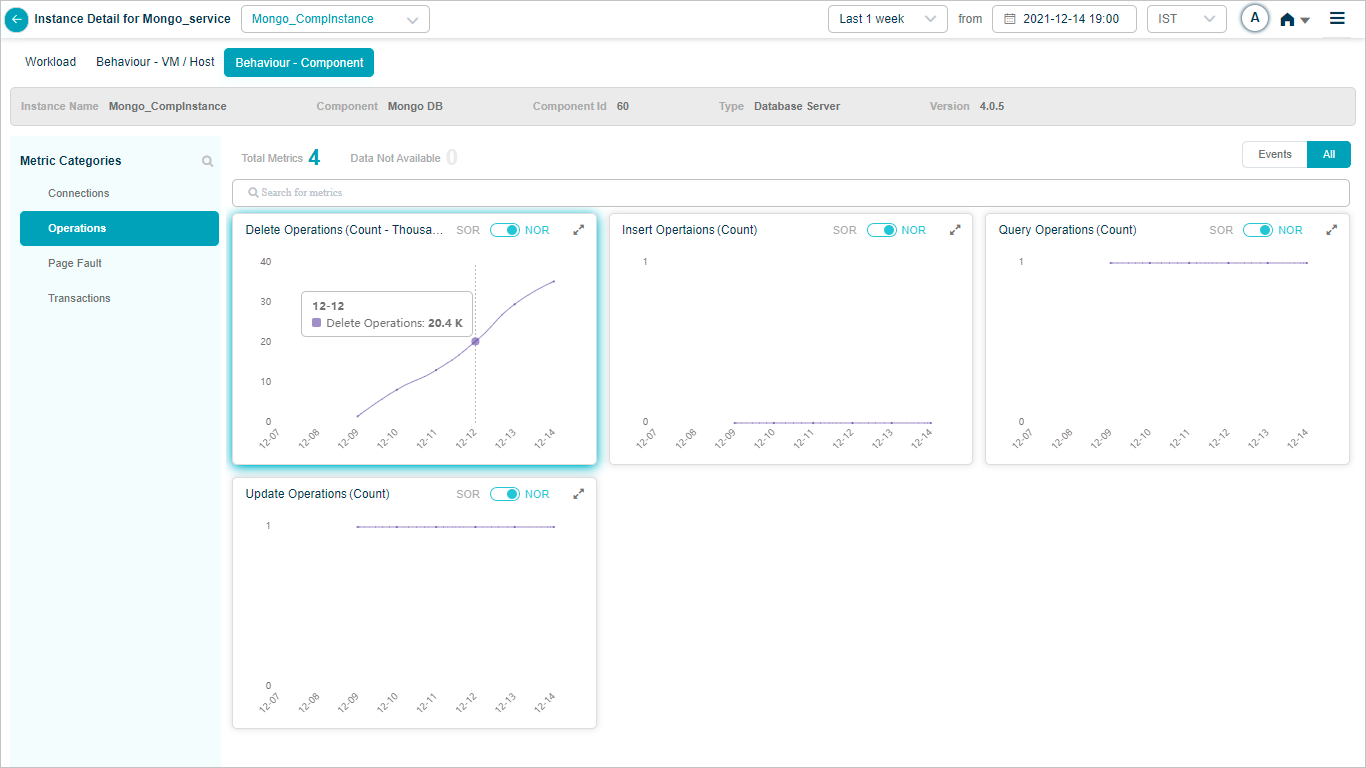
Mongo_CompInstance – Operations
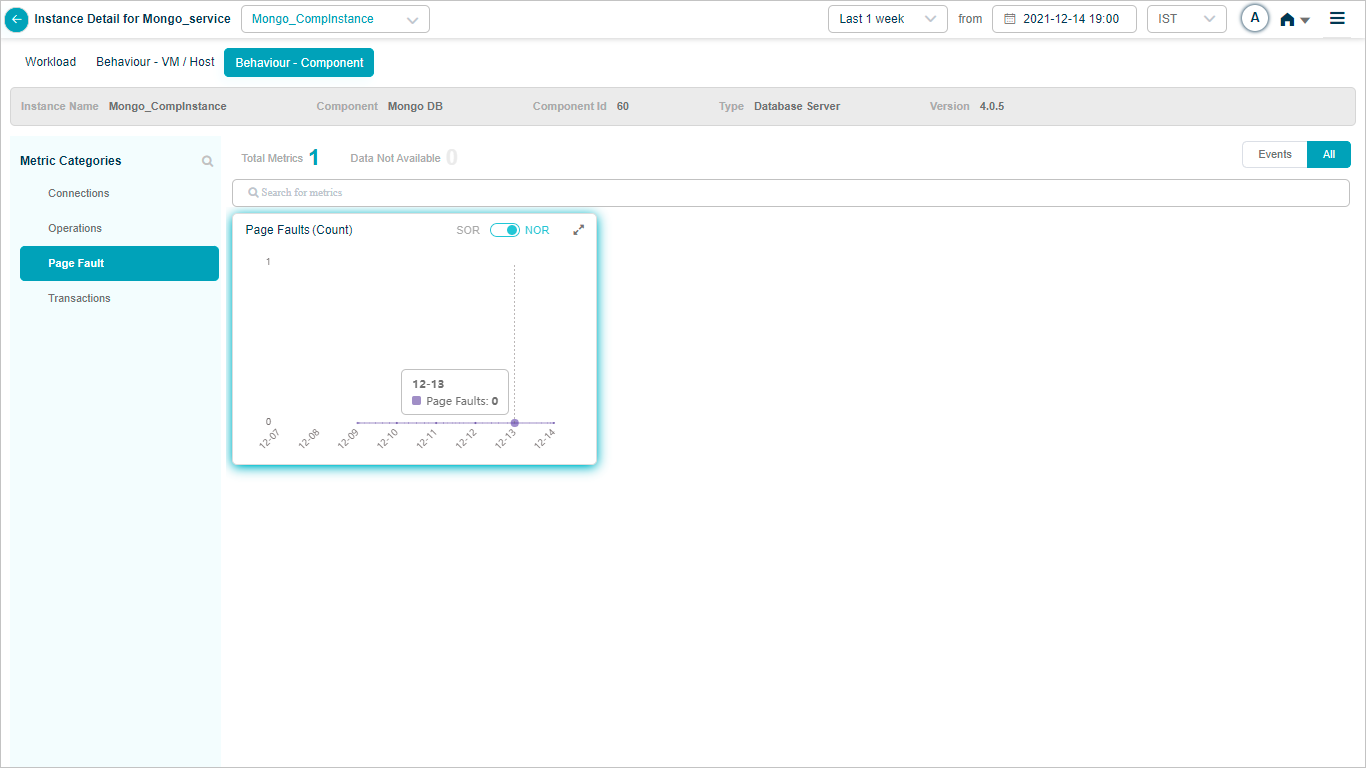
Mongo_CompInstance – Page Fault
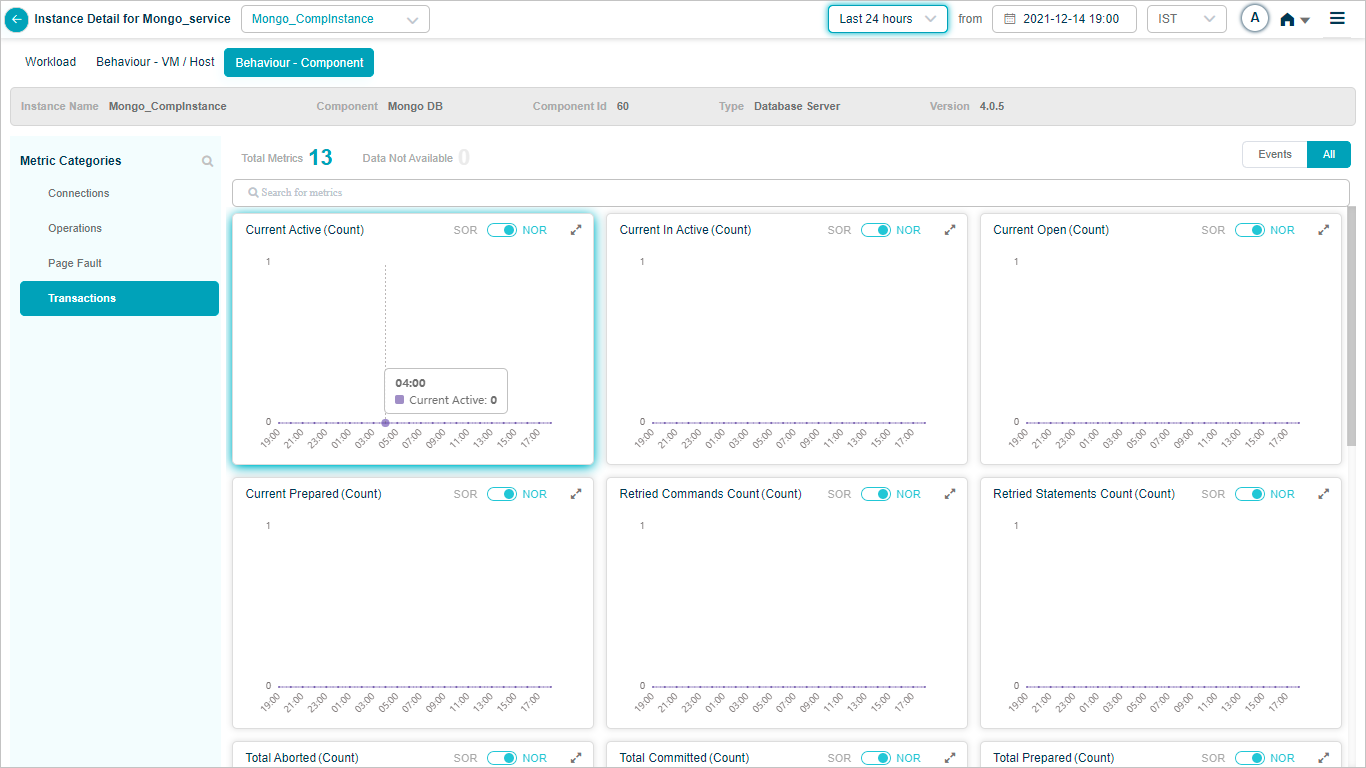
Mongo_CompInstance – Transactions
and
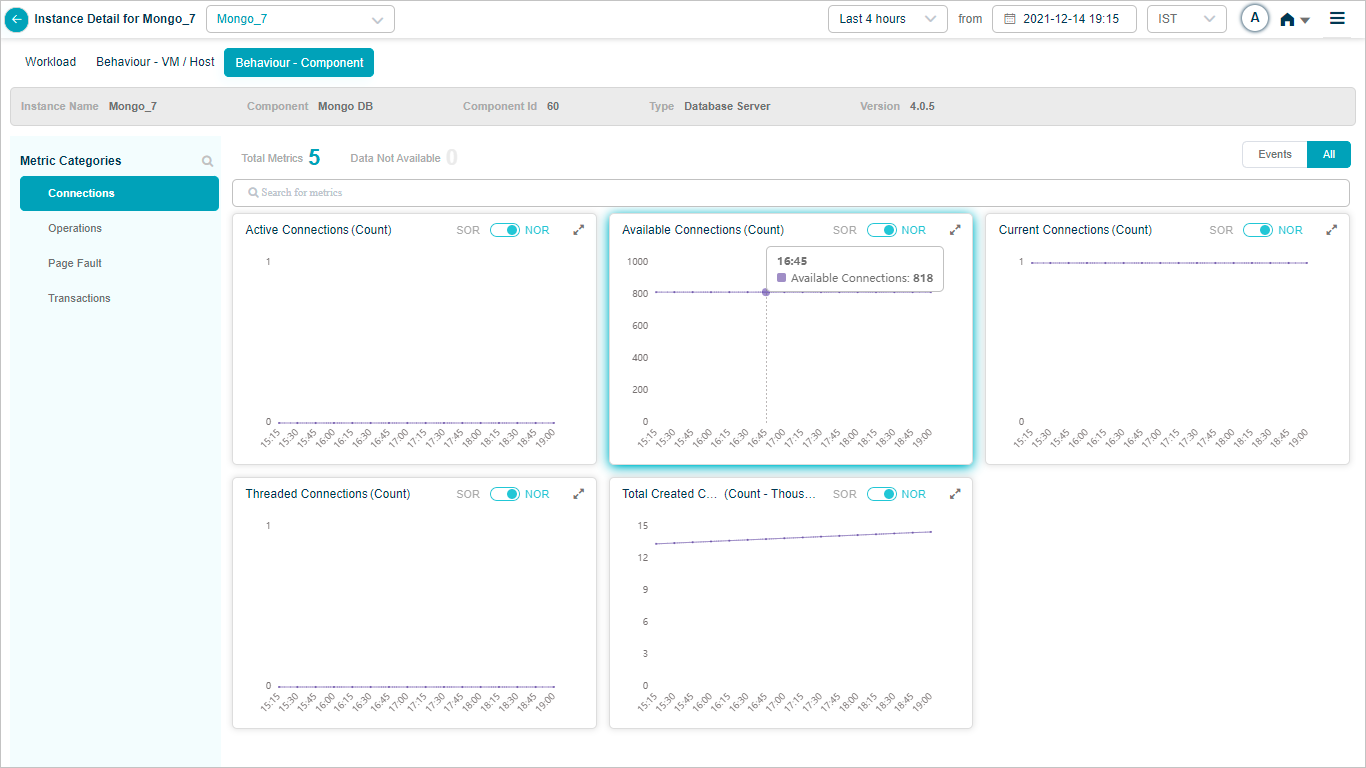
Mongo_7 – Connections
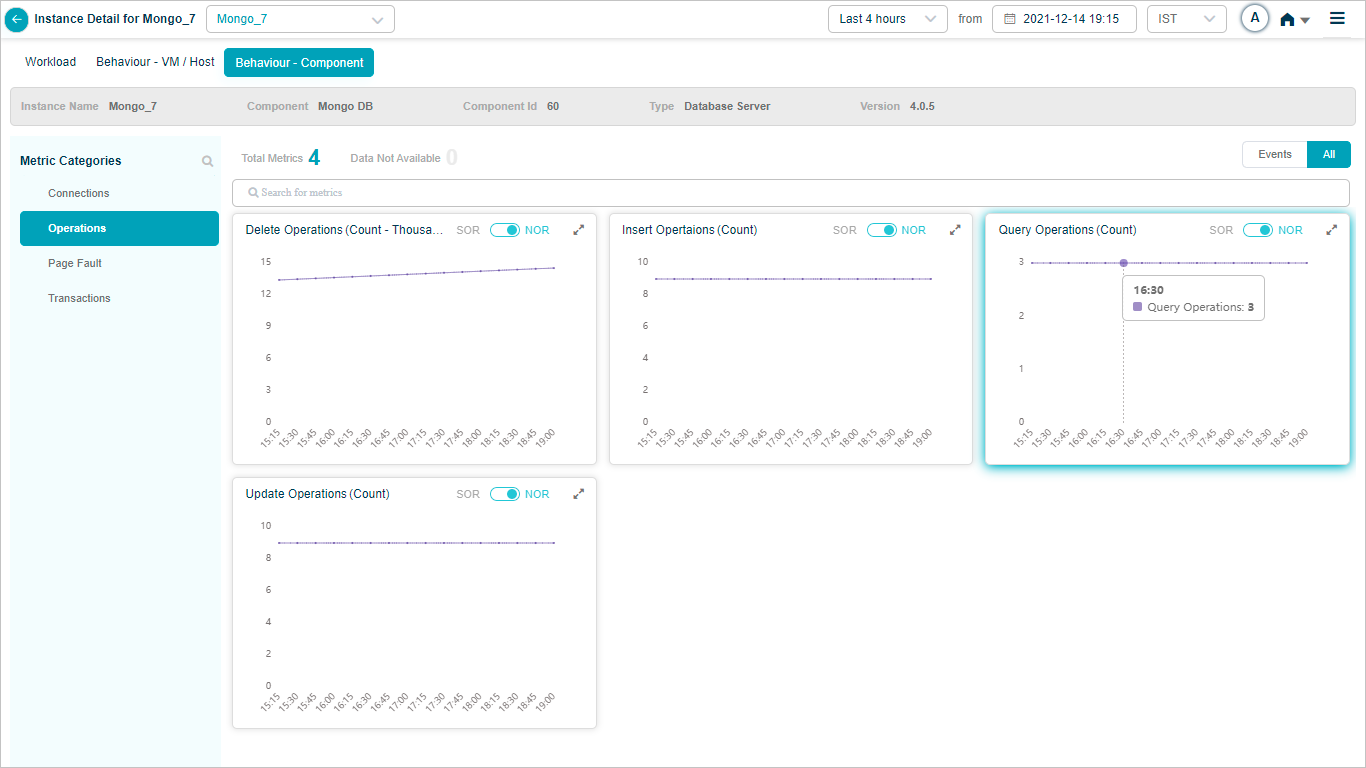
Mongo_7 – Operations
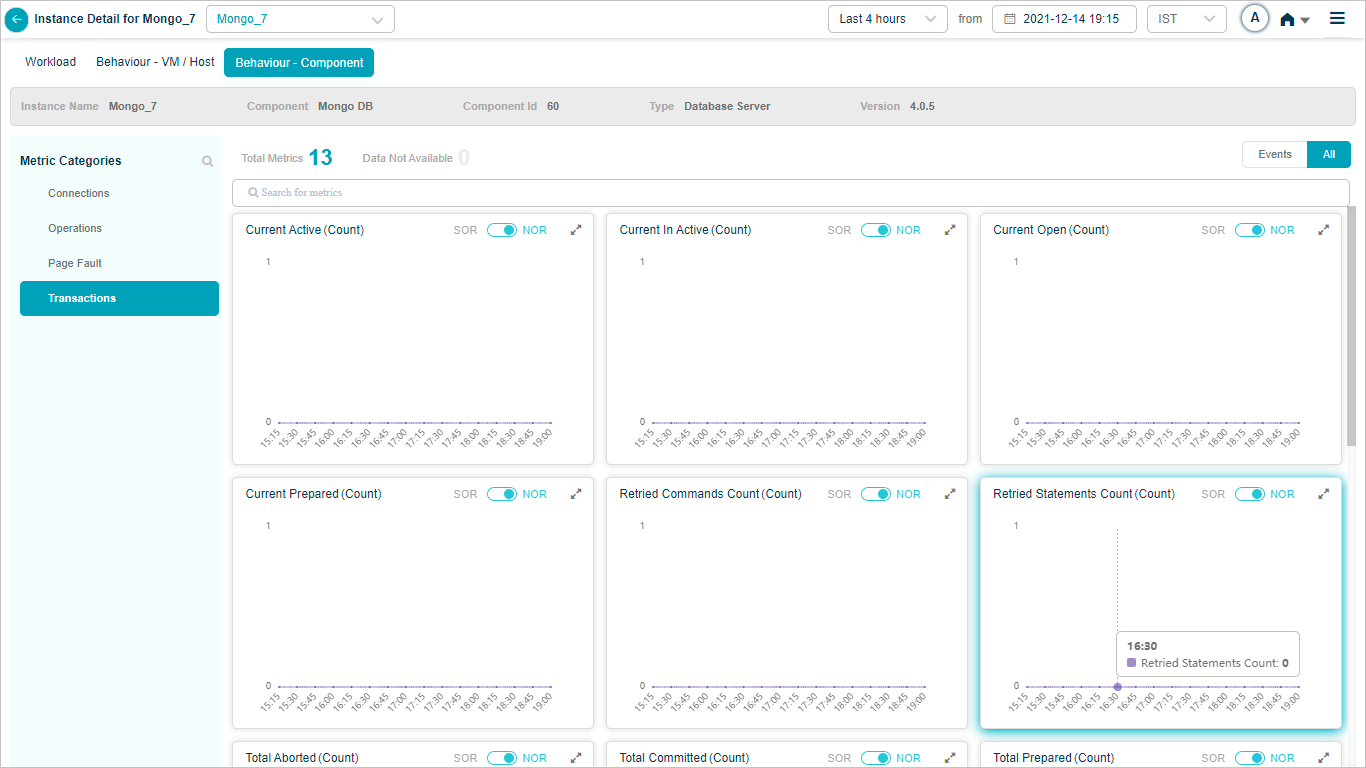
Mongo_7 – Transactions
Maria DB KPIs
When you map Maria DB component instances to Maria DB component using Control Center, you can view Maria DB KPIs in HEAL.
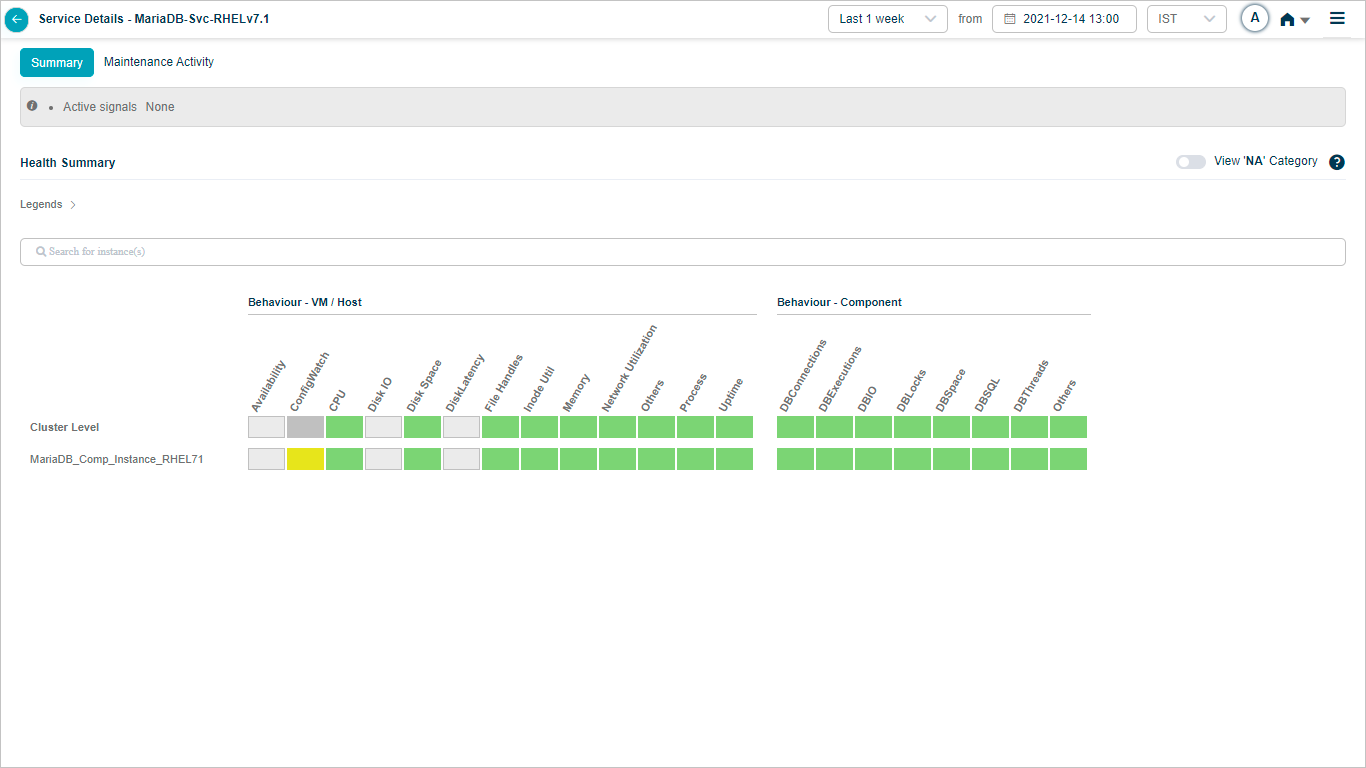
Health Summary
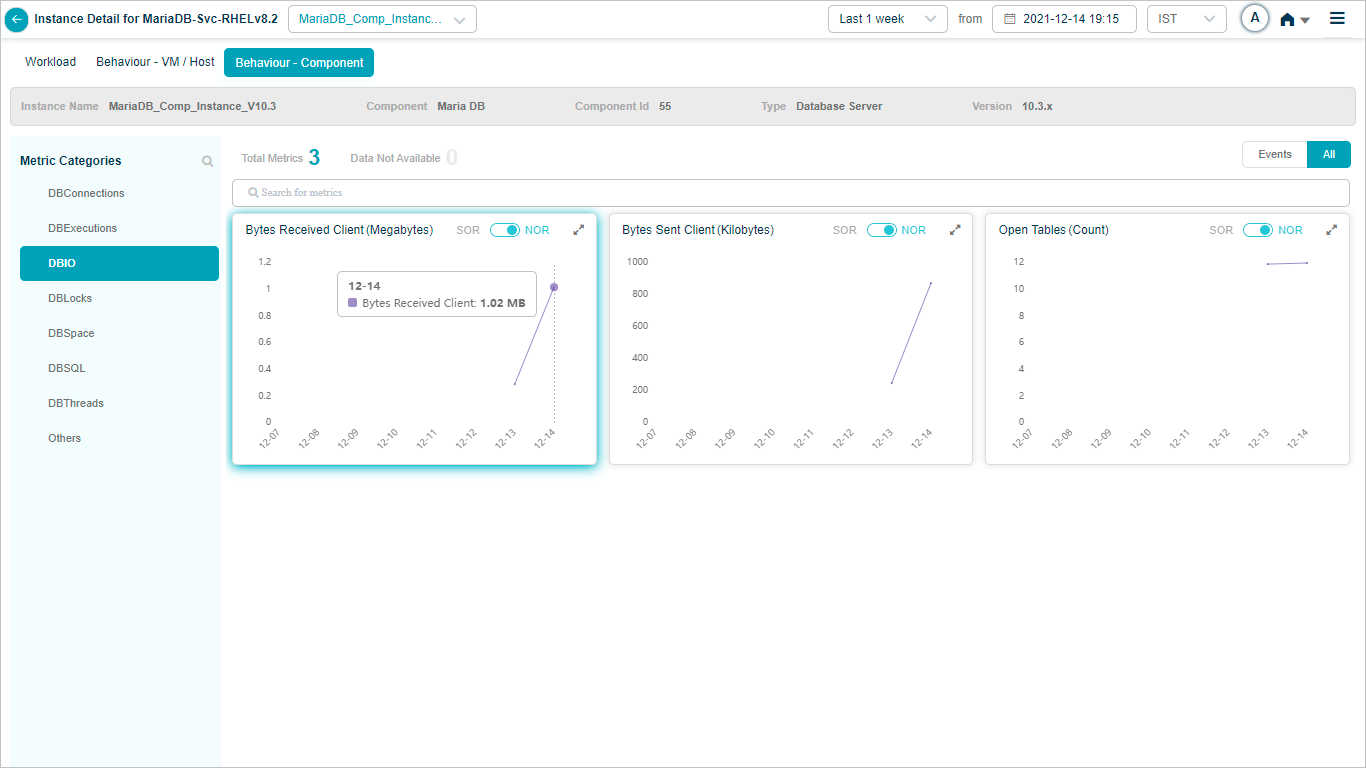
Metric – DBIO
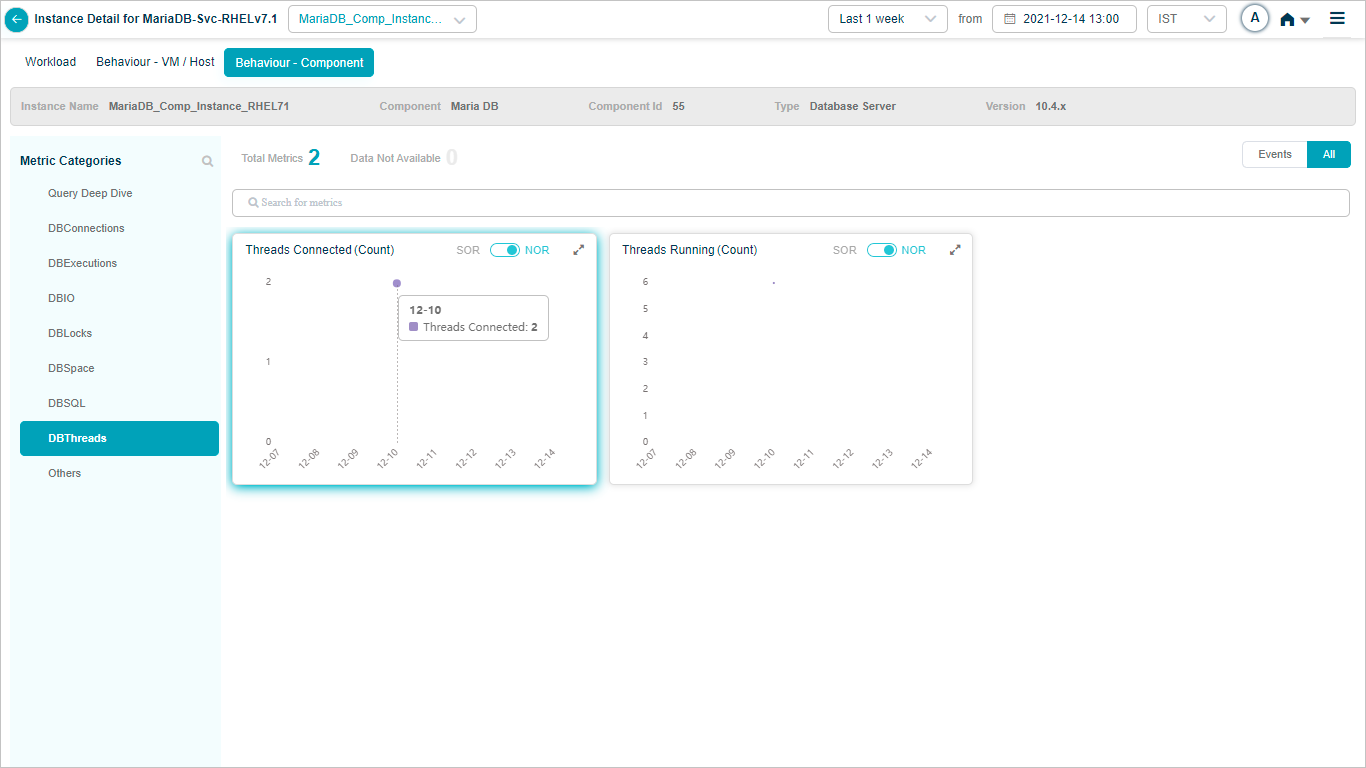
Metric – DBThreads
IIB Connector KPIs
When you configure IIB connector, you can view the KPIs of IIB Connector in HEAL.
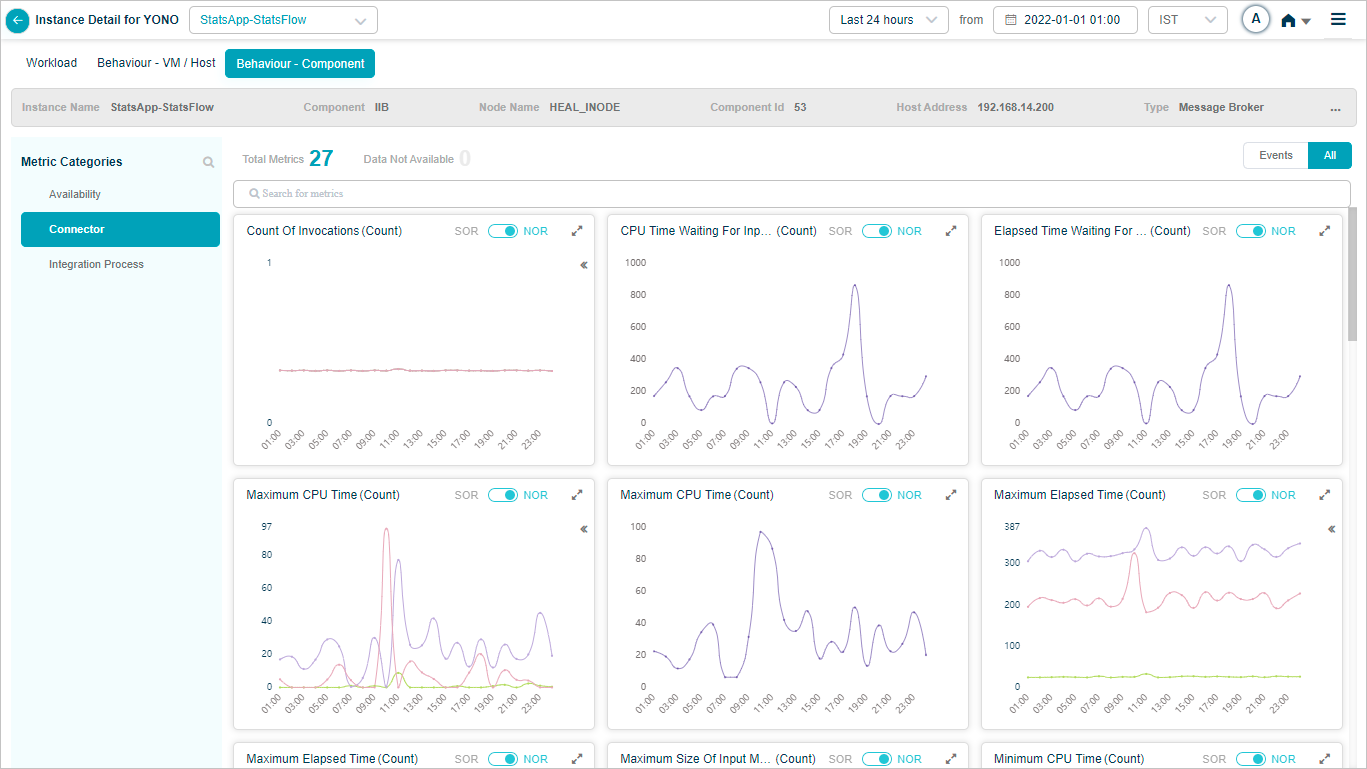
Metric – Connector
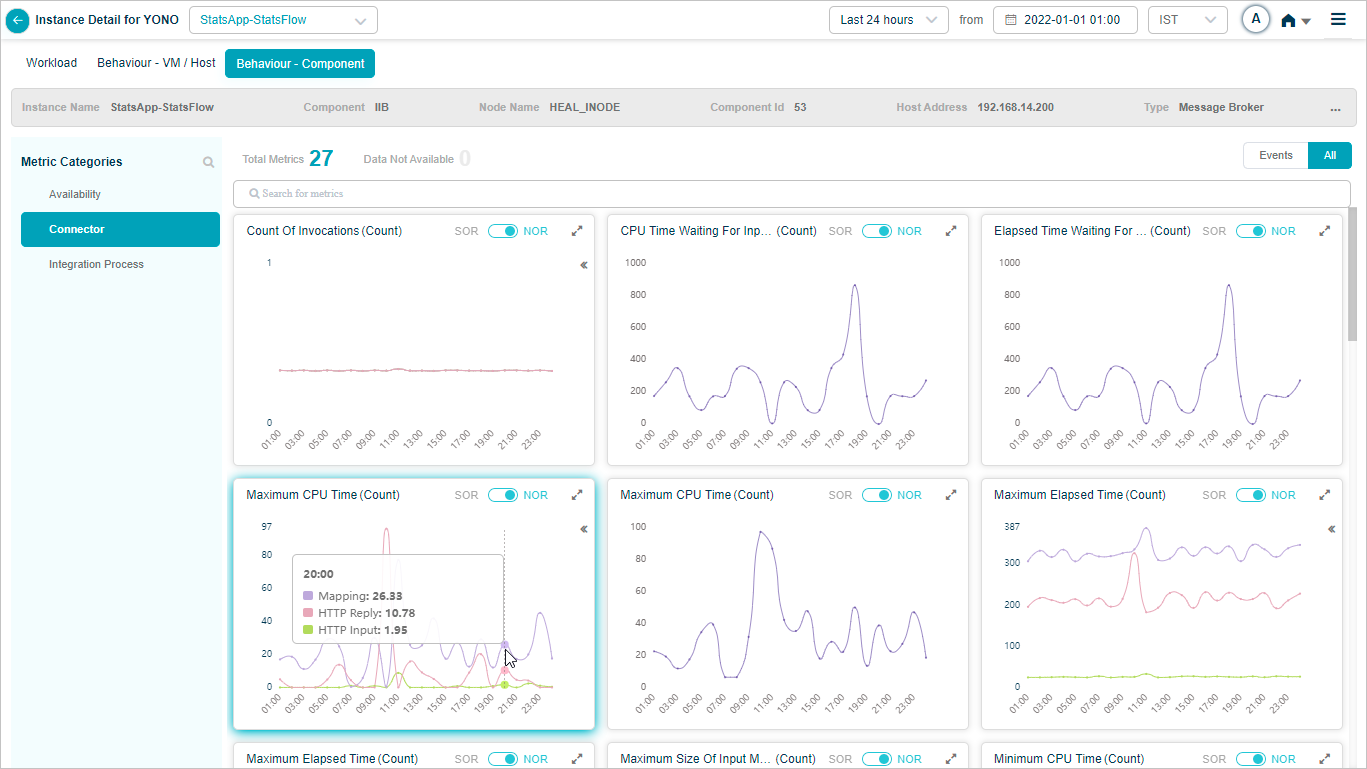
Metric – Connector_Maximum CPU Time (Count)
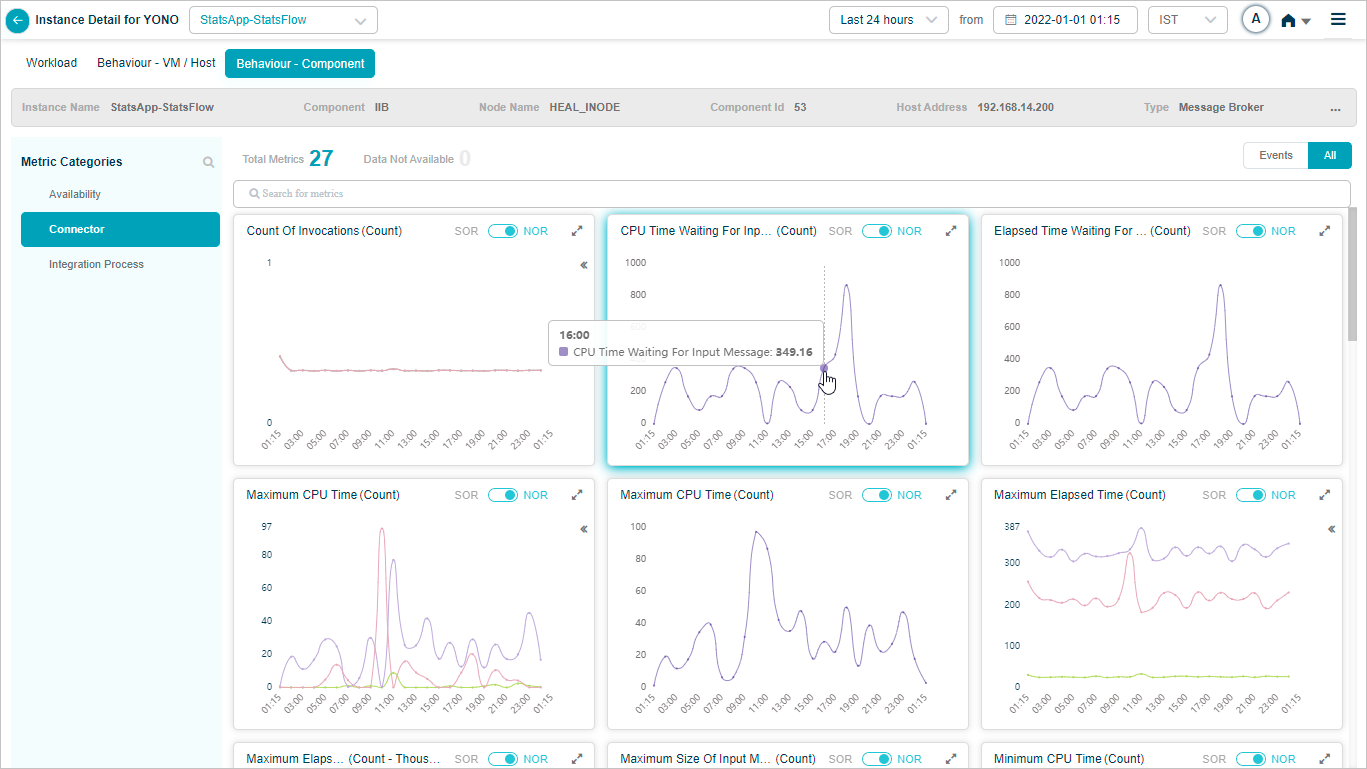
Metric – Connector_CPU time Waiting For Input Message
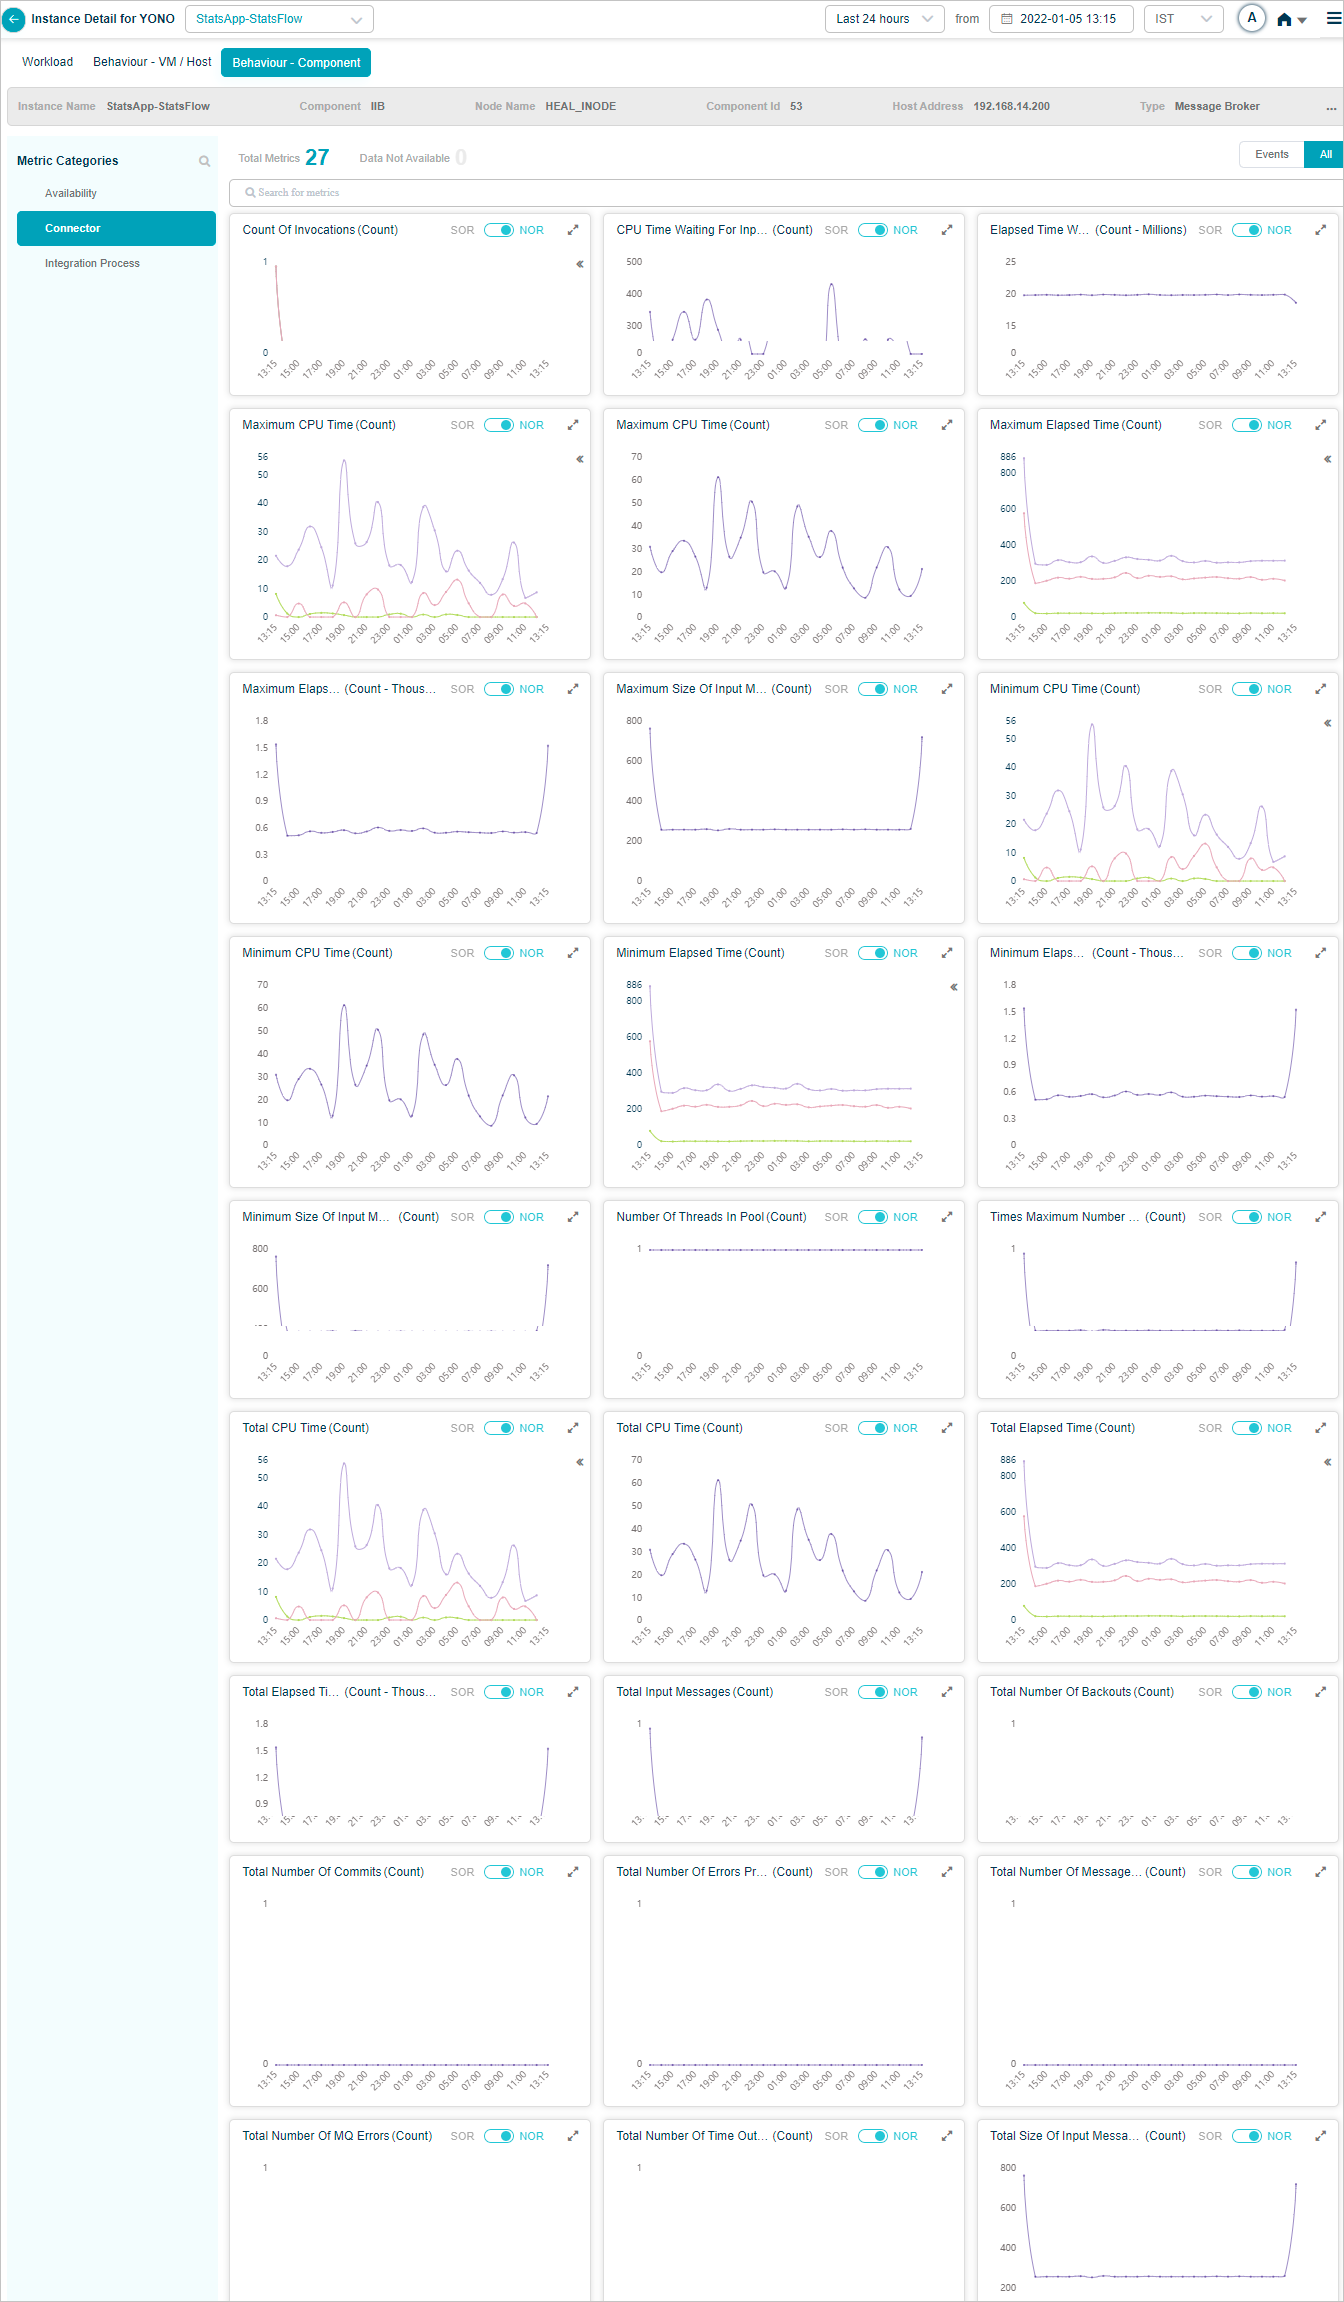
Metric – Connector
NGINX KPIs
When you map NGINX component instances to NGINX component using Control Center, you can view NGINX KPIs in HEAL.
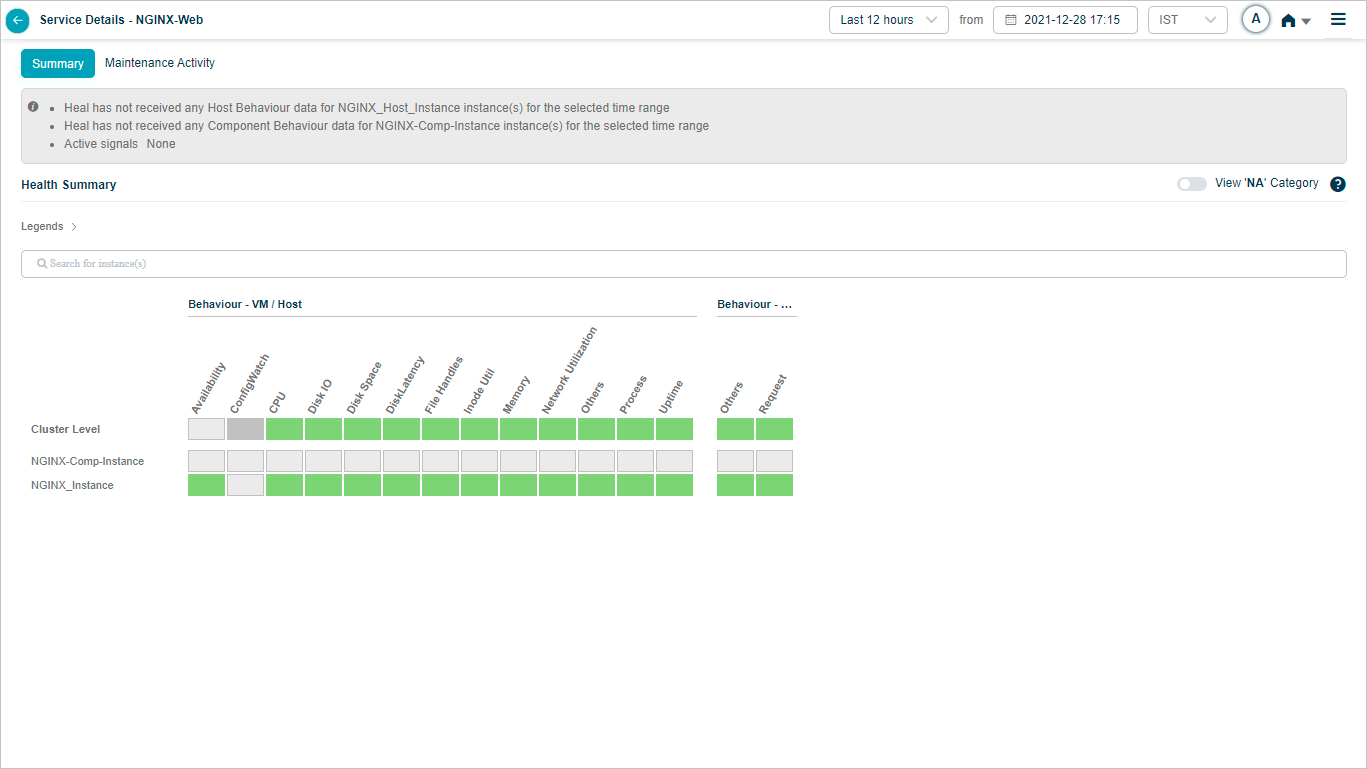
Summary
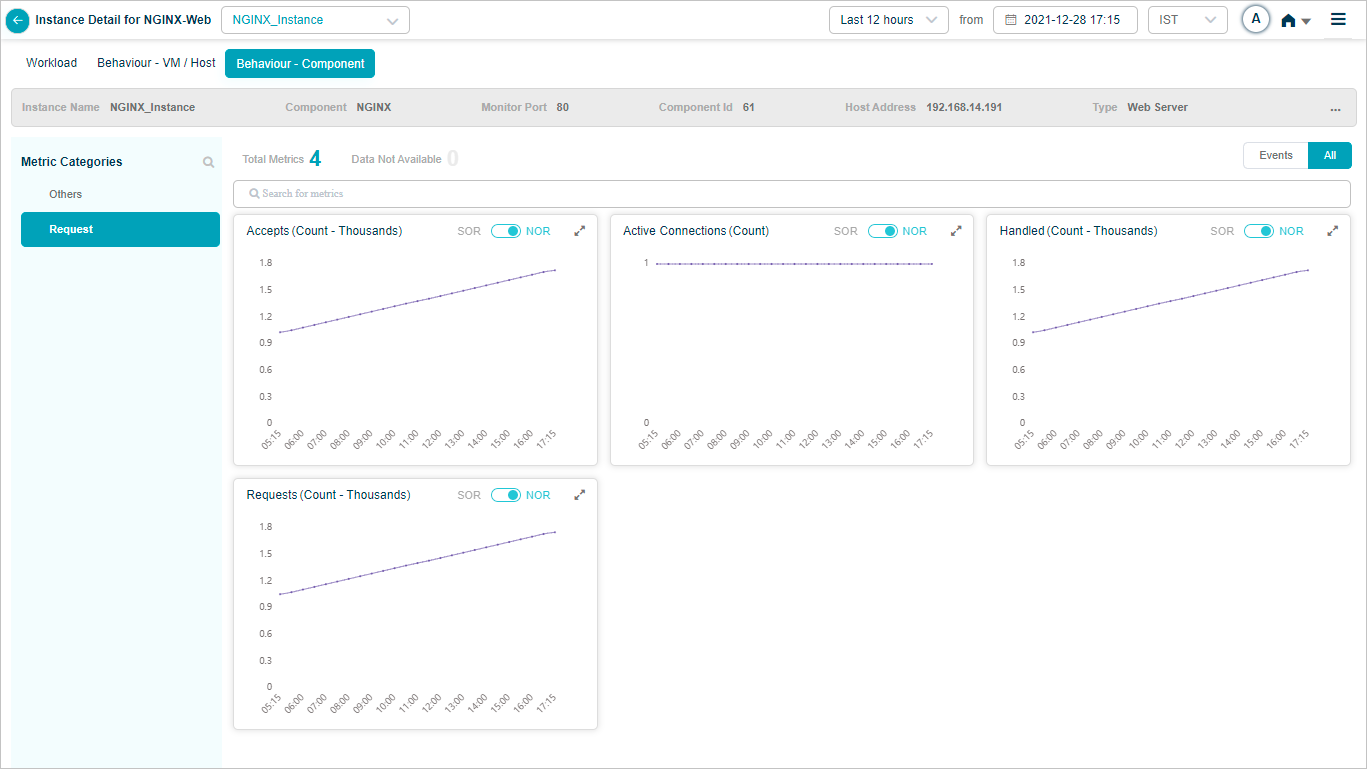
Metric – Request
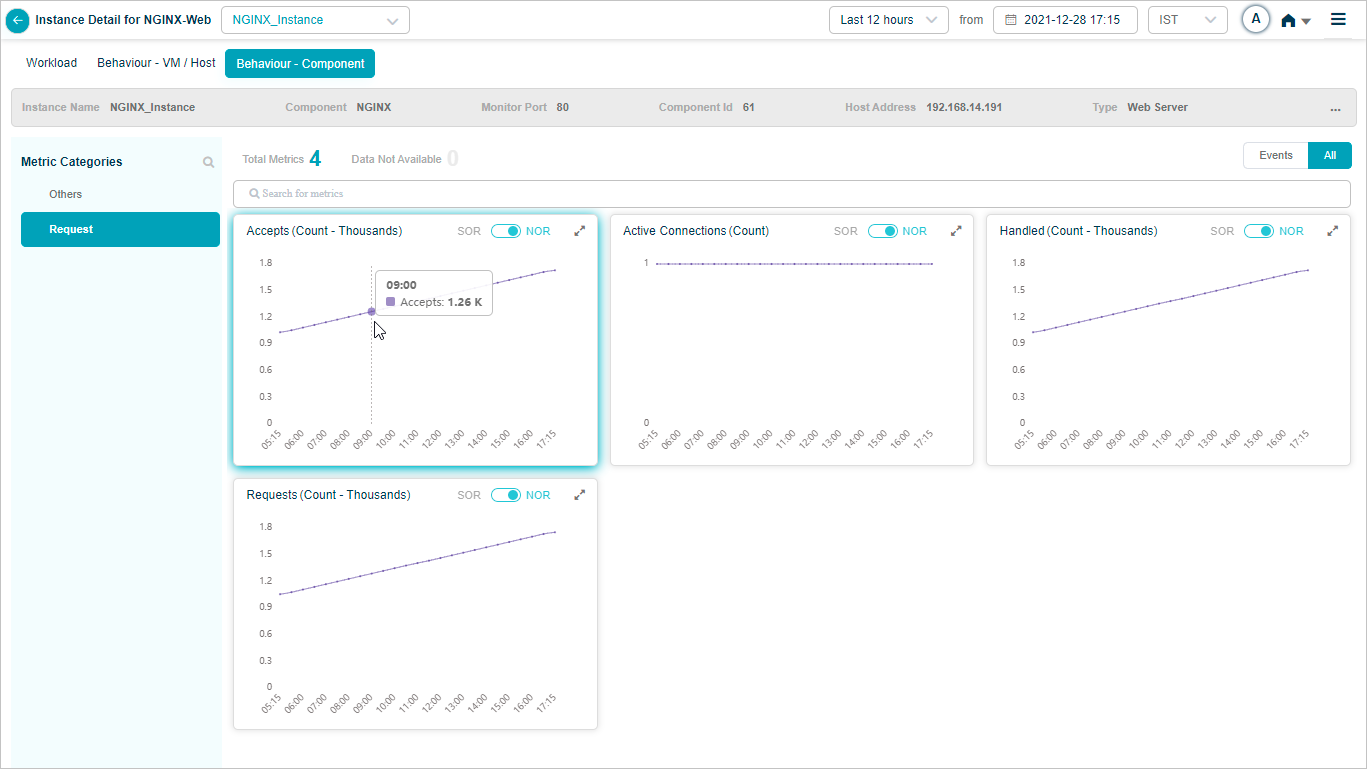
Metric – Request (Accepts)
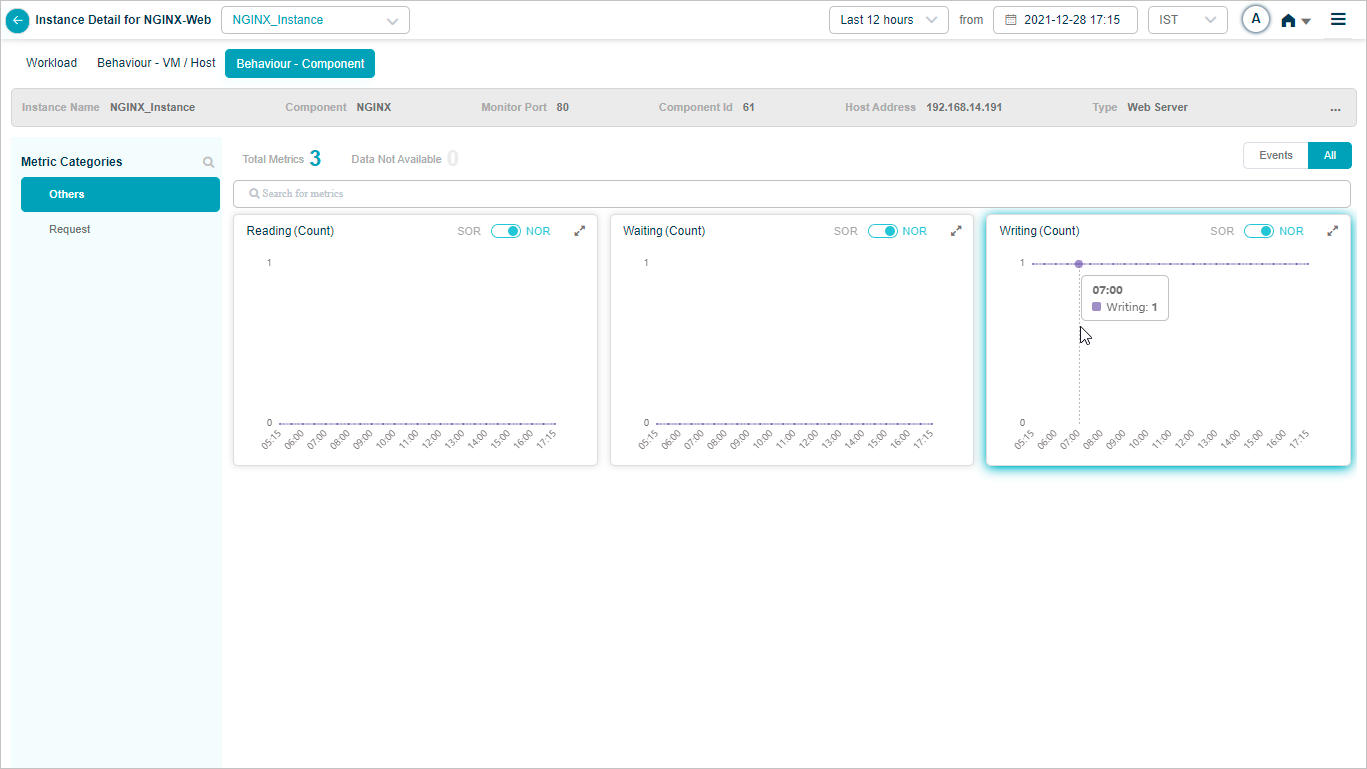
Metric – Request_Writing
Cloudant DB KPIs
When you map Cloudant DB component instances to Cloudant component using Control Center, you can view Cloudant KPIs in HEAL.
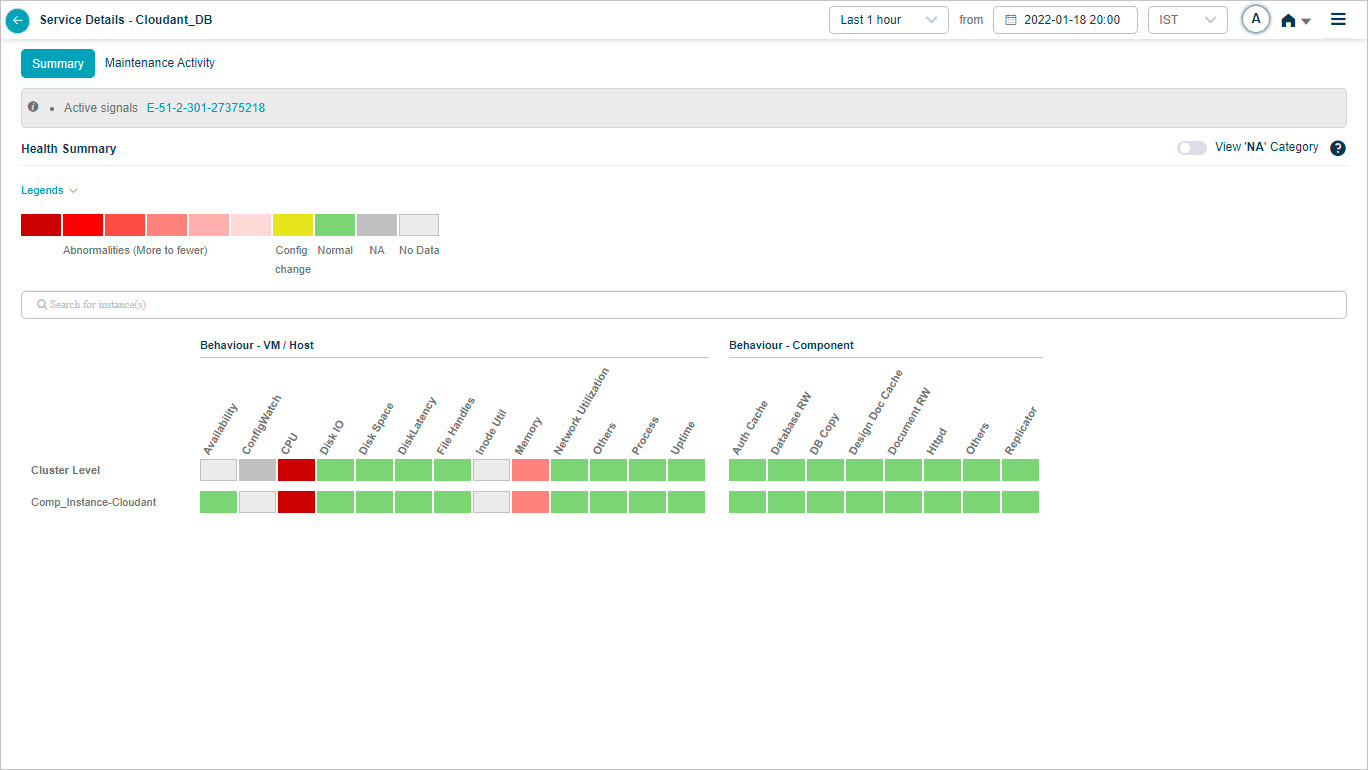
Health Summary
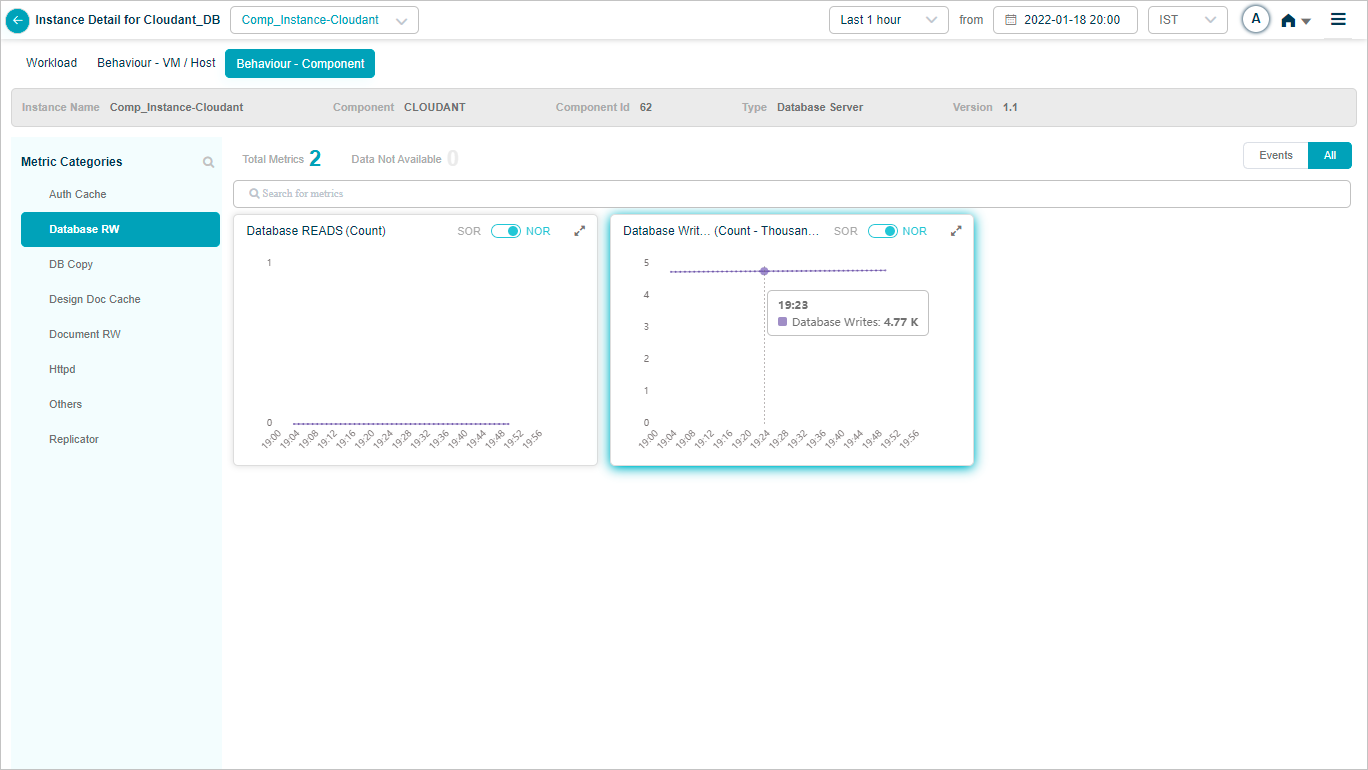
Metric – Database RW
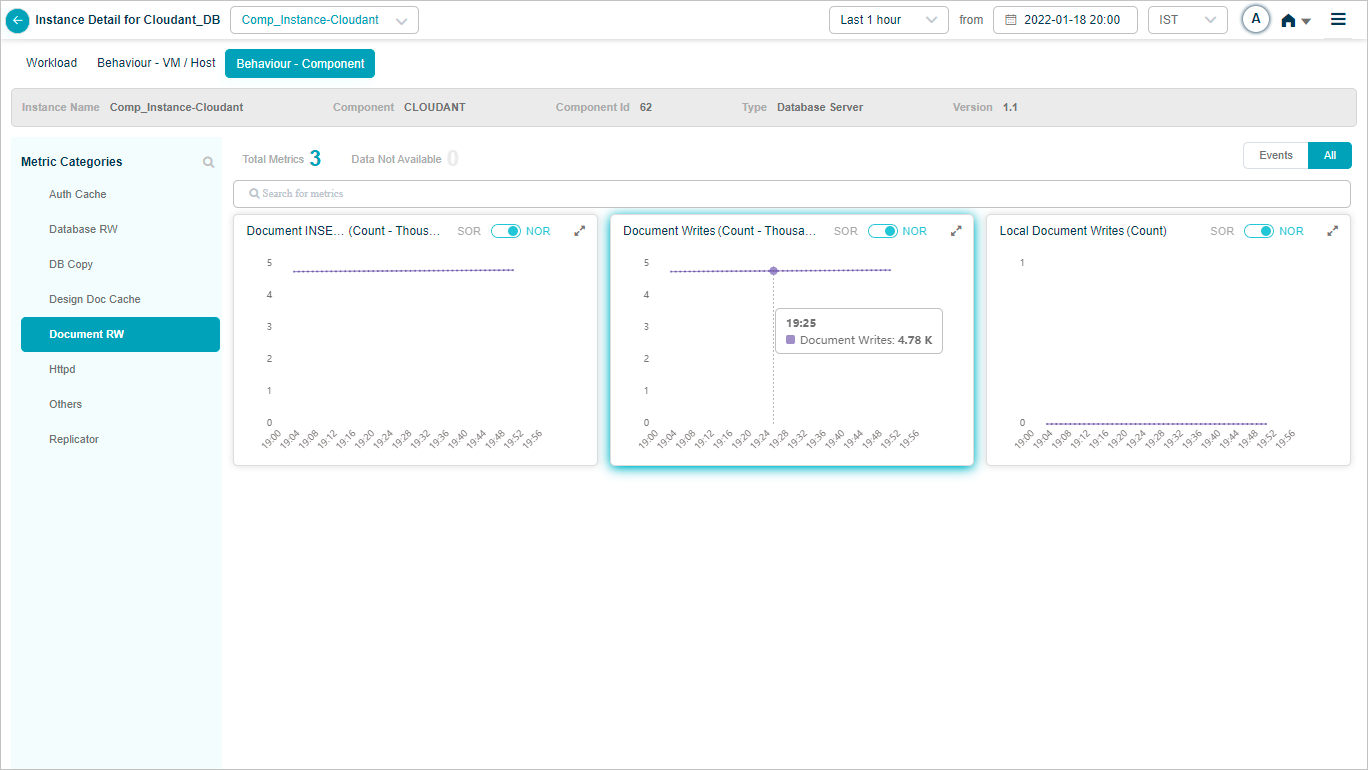
Metric – Document RW
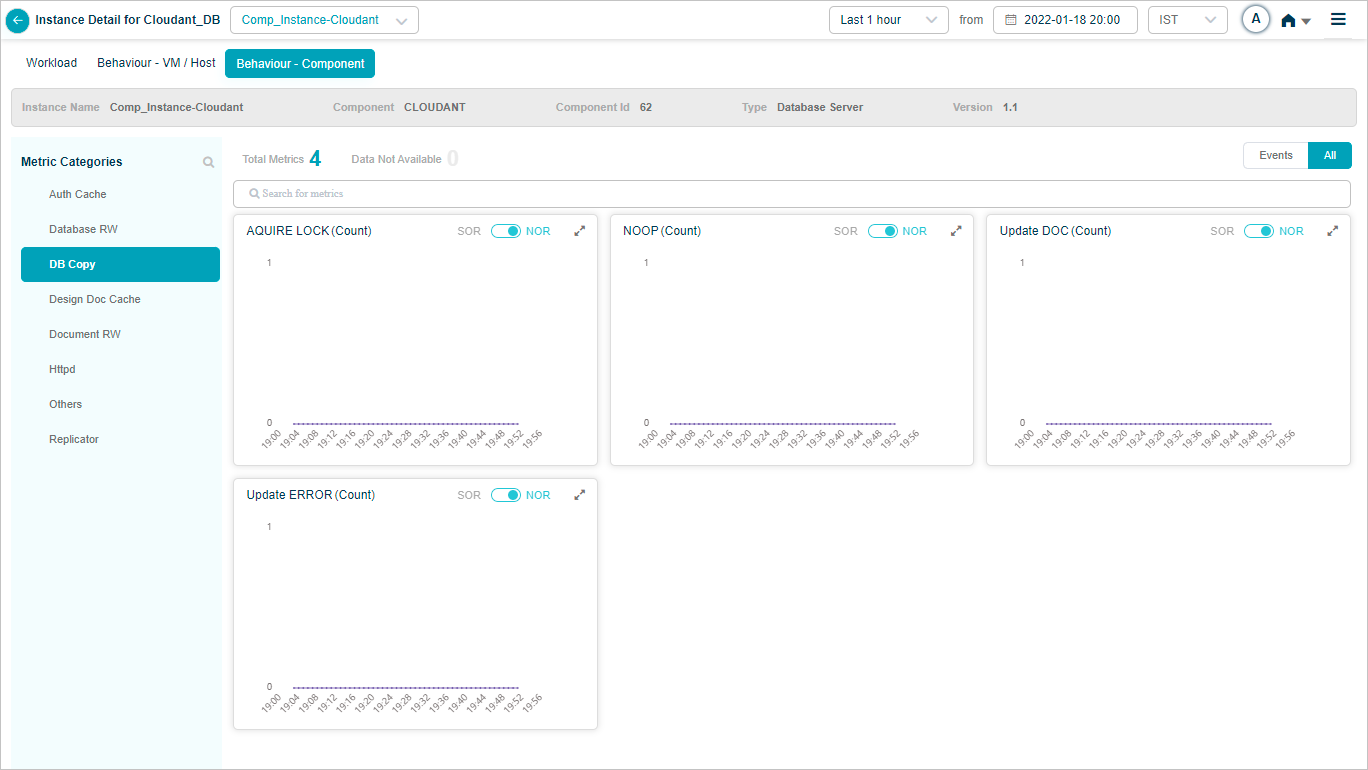
Metric – DB Copy
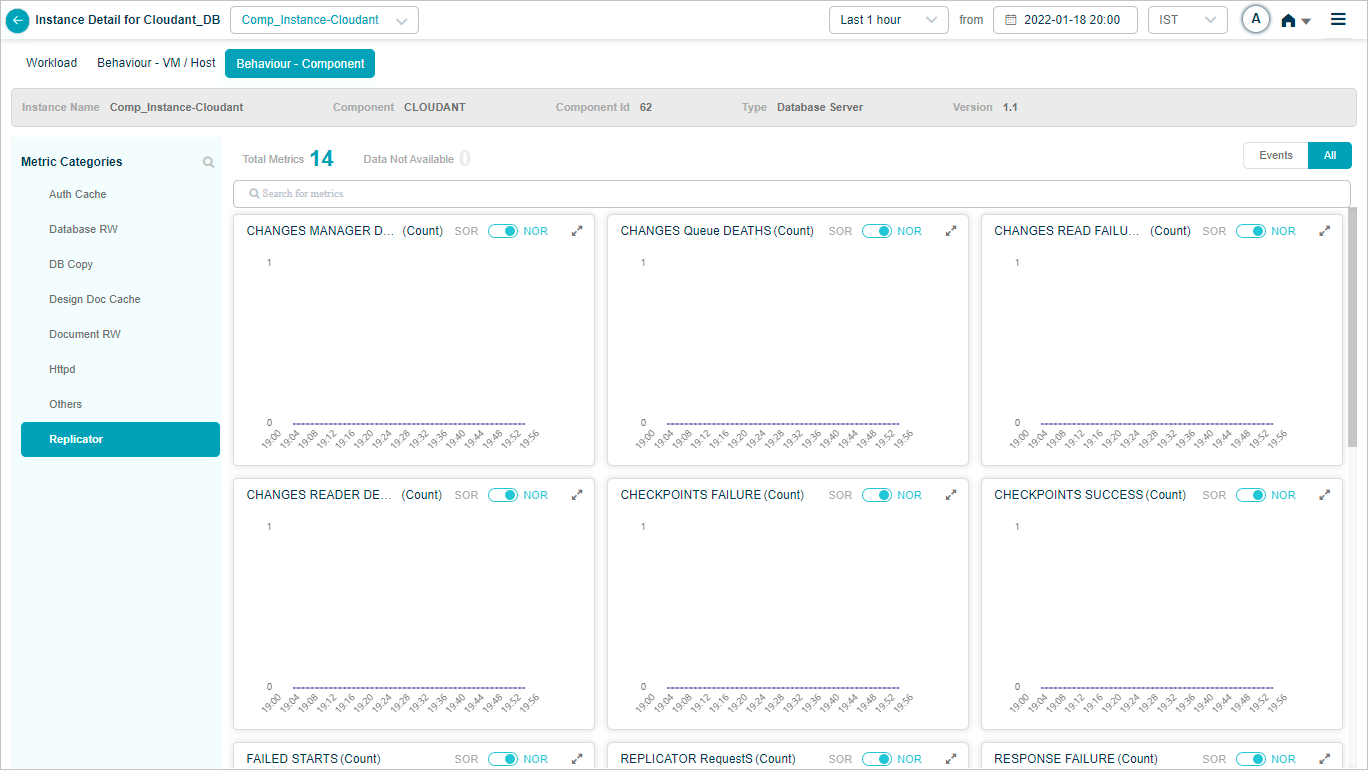
Metric – Replicator
Apache ActiveMQ
When you map Apache ActiveMQ component instances to Apache ActiveMQ component using Control Center, you can view Apache ActiveMQ KPIs in HEAL.
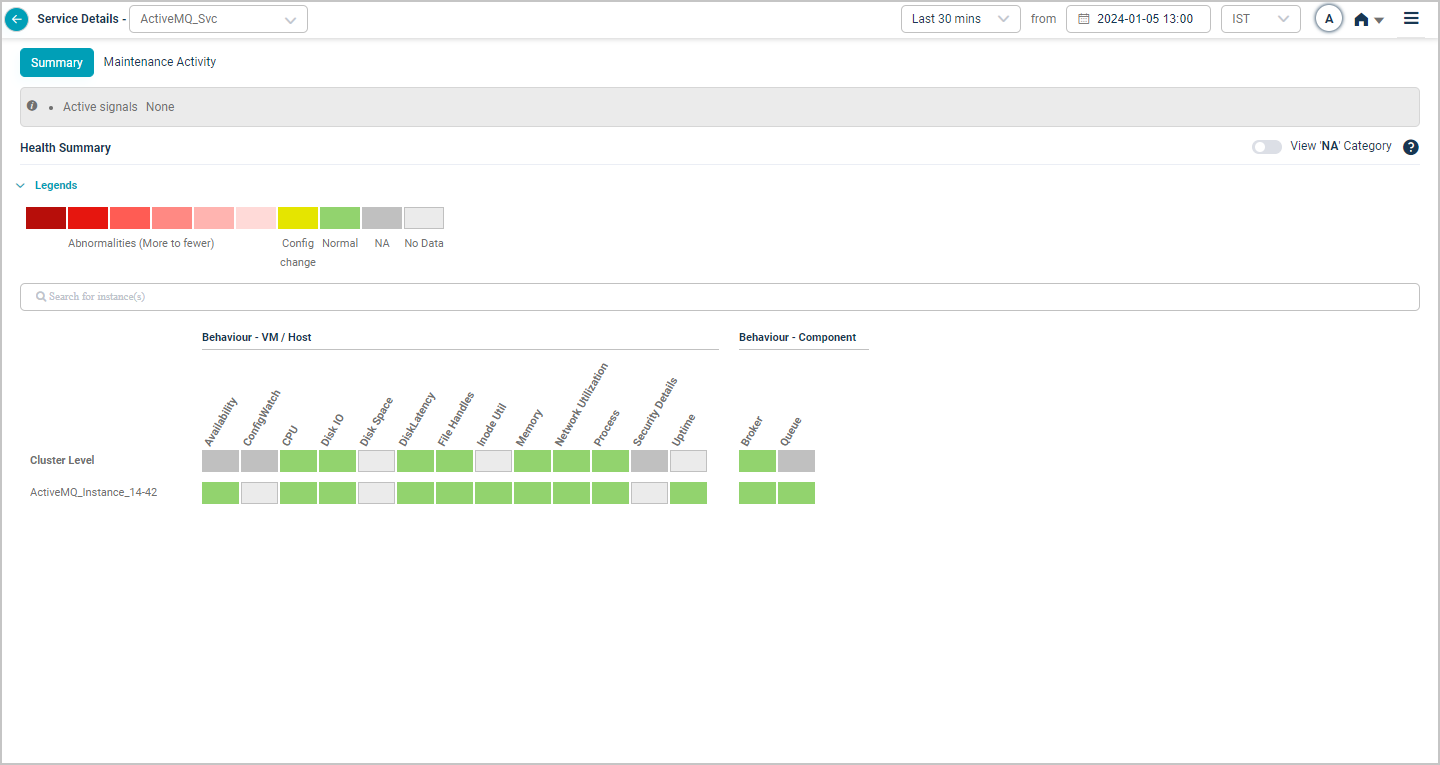
Health Summary
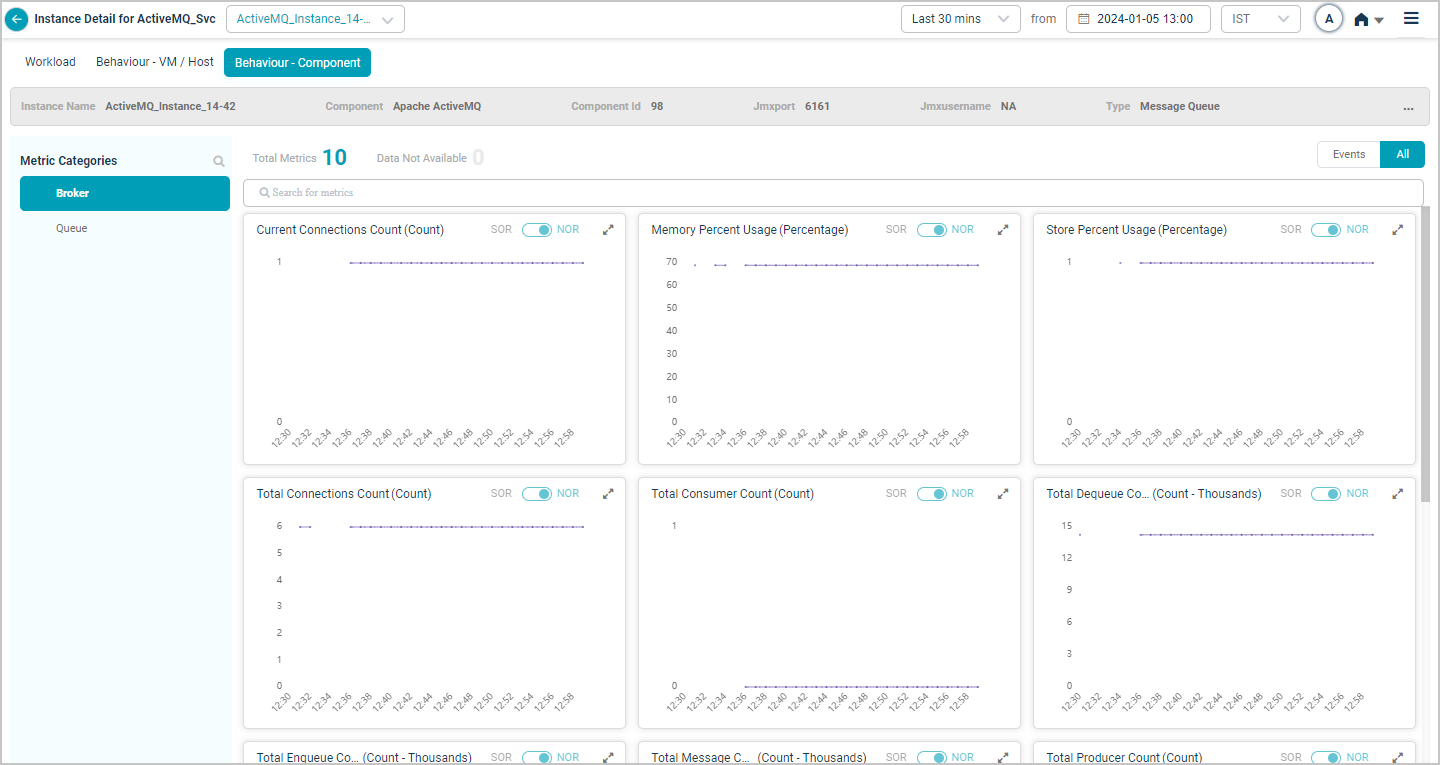
Metric – Broker
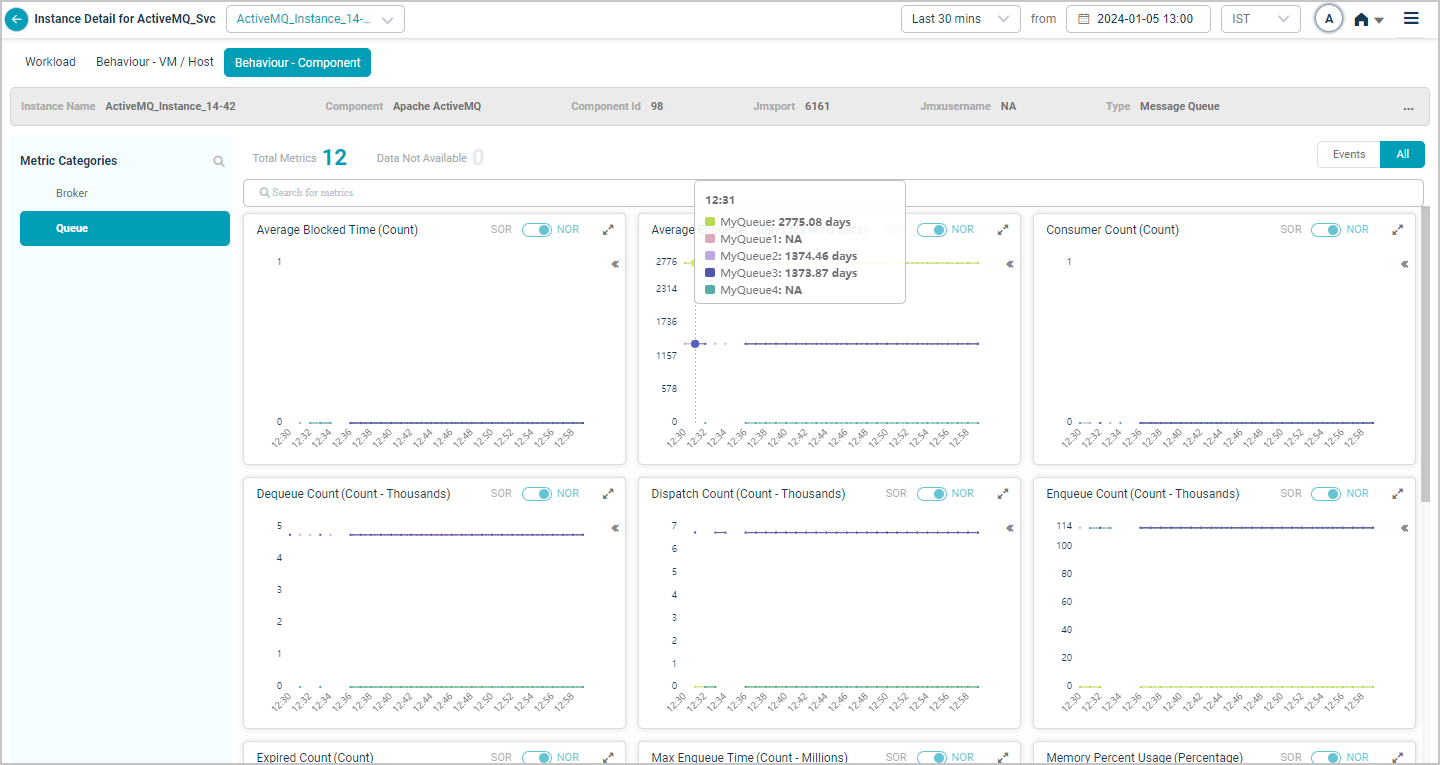
Metric – Queue
FFDC Log Monitoring KPIs
Health Summary
Metric – FFDC Log Monitoring
DB2 KPIs
When you map DB2 component instances to DB2 component using Control Center, you can view DB2 KPIs in HEAL.
Elasticsearch KPIs
When you map Elasticsearch component instances to Elasticsearch component using Control Center, you can view Elasticsearch KPIs in HEAL.
HAProxy KPIs
When you map HAProxy component instances to HAProxy component using Control Center, you can view HAProxy KPIs in HEAL.
SUSE Linux KPIs
When you map SUSE Linux host instances to SUSE Linux component using Control Center, you can view SUSE Linux KPIs in HEAL.
Logstash KPIs
When you map Logstash host and component instances to Logstash component using Control Center, you can view Logstash KPIs in HEAL.
Node JS KPIs
When you map Node JS component instances to Node JS component using Control Center, you can view Node JS KPIs in HEAL.
JIM Agent Thread KPIs
When you map JIM Agent component instances to JIM Agent component using Control Center, you can view JIM Agent Thread KPIs in HEAL.
IBM MQ KPIs
When you map IBM MQ component instances to IBM MQ component using Control Center, you can view IBM MQ KPIs in HEAL.
Power BI KPIs
When you map Power BI component instances to Power BI component using Control Center, you can view Power BI KPIs in HEAL.
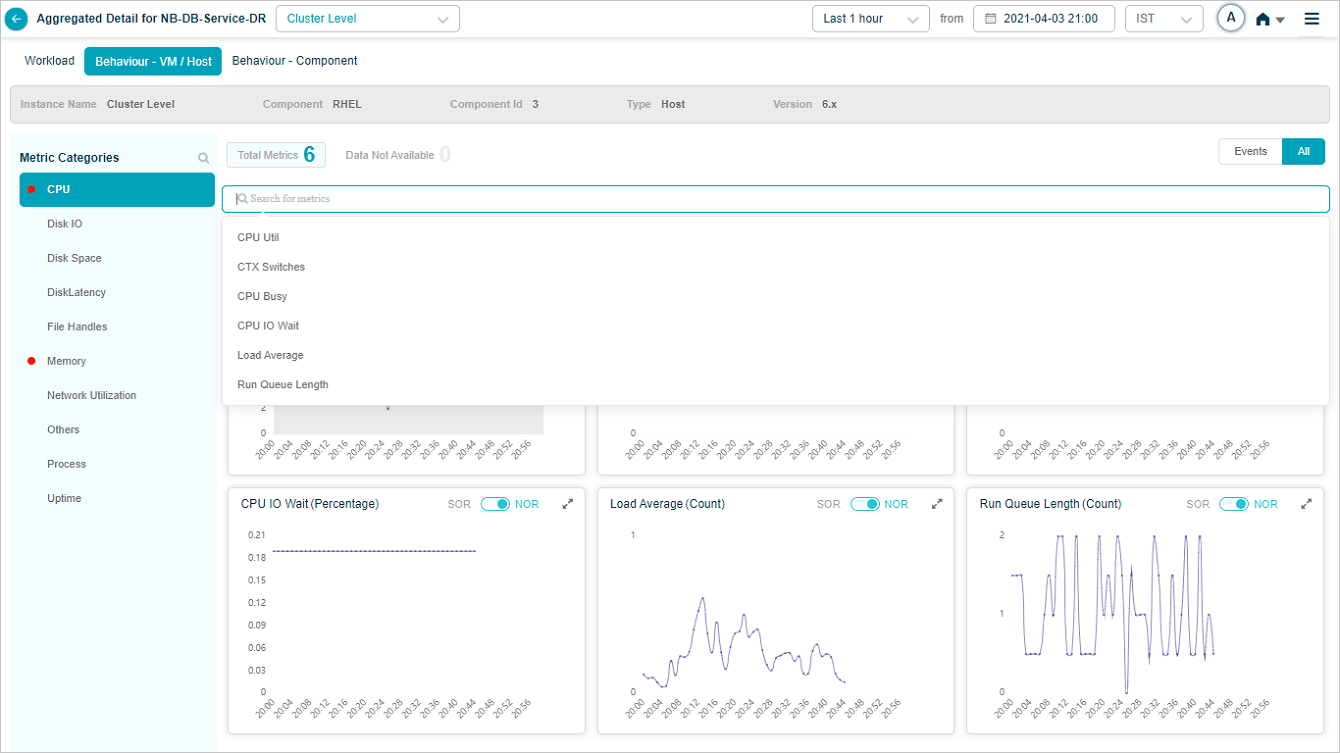
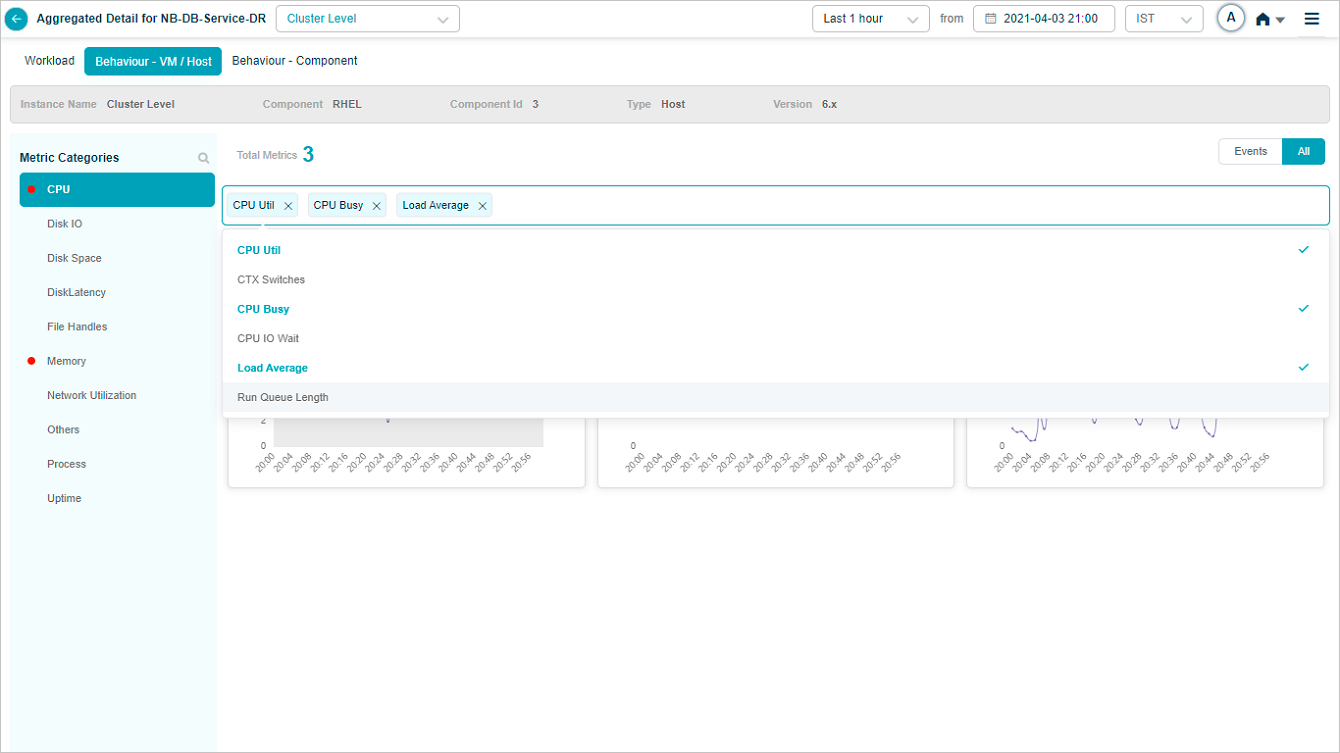
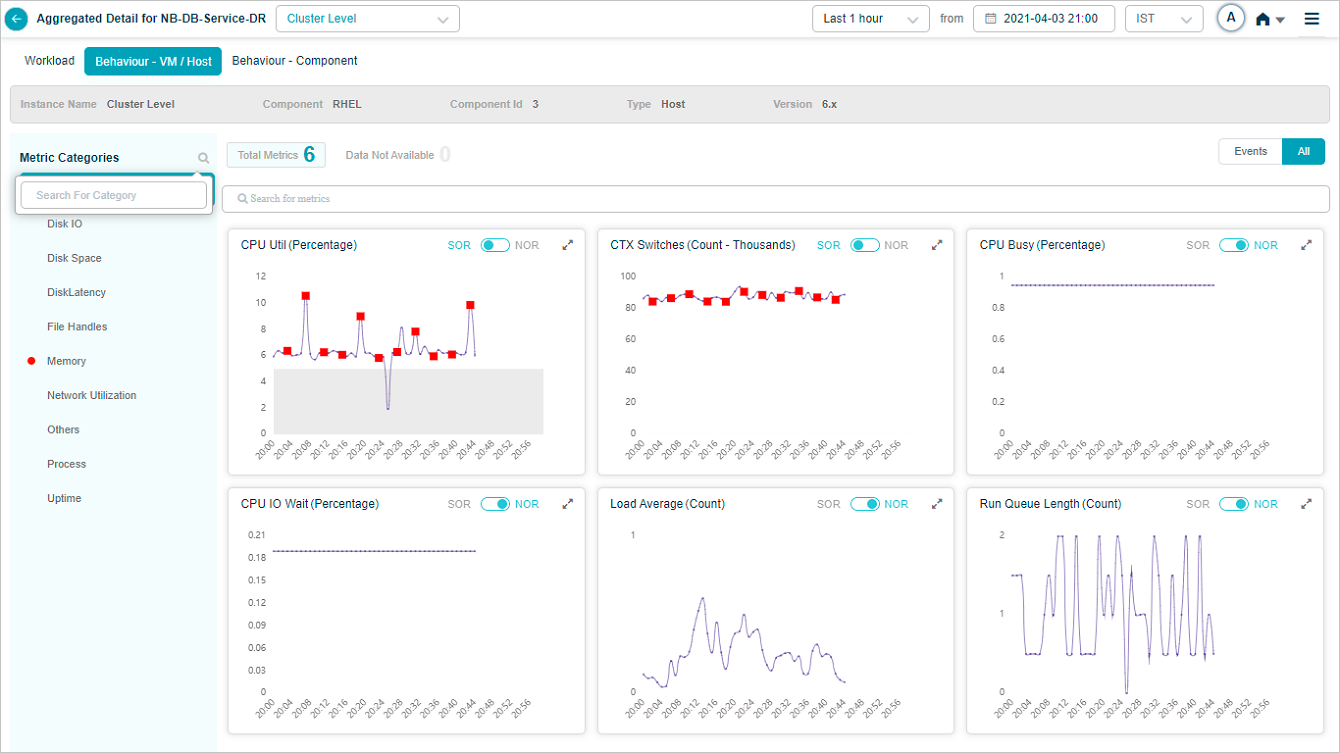
Searching Metrics and Categories
You can search for KPIs within a category as shown below. Select the search box. It displays all the metrics belonging to a specific category. Select the metric(s) you need to search for.
Metric – CPU
Metric – CPU
Data for the selected metric(s) is displayed.
Metric – CPU
HEAL retains the search result across cluster and instances. For an instance if you select say three KPIs in search box and then if you select another instance from the instance drop box, the new instance also displays those three KPIs. If you select All, all KPIs you select for an earlier instance are displayed. If you select Events, only those KPIs having events are displayed.
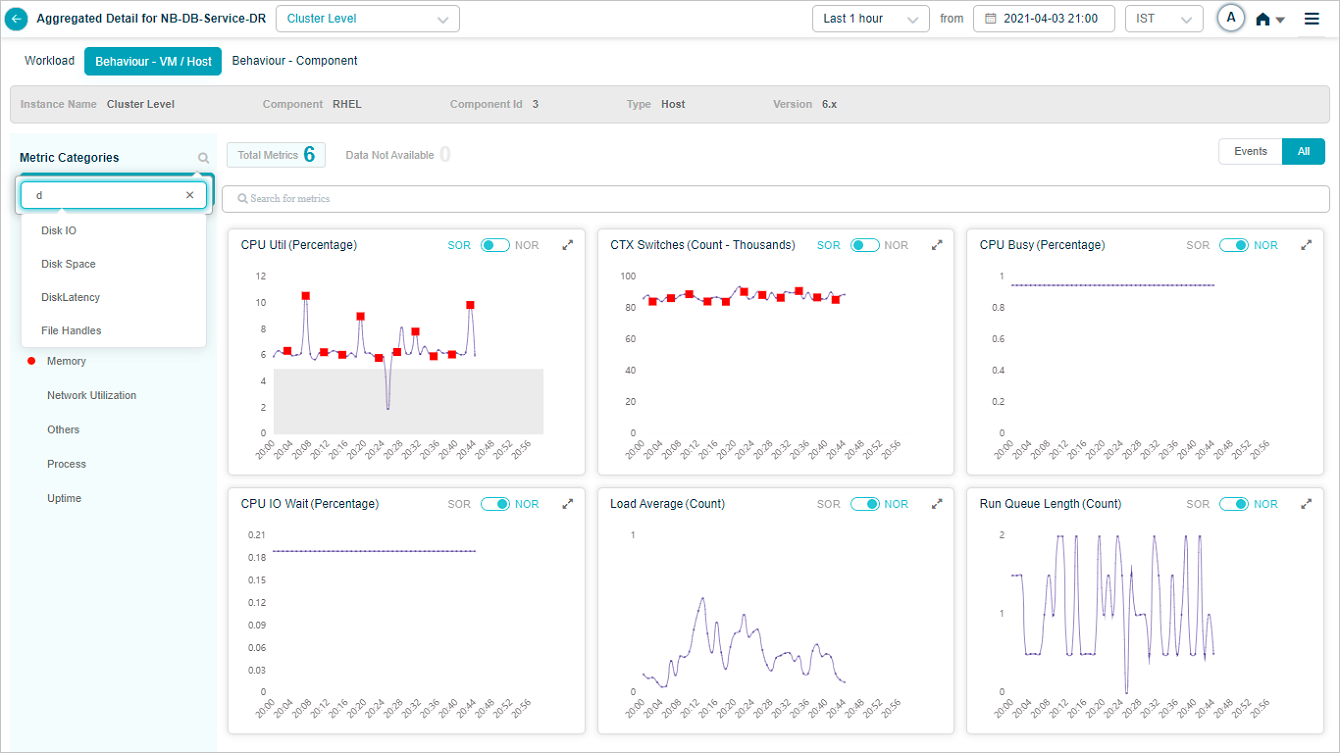
You can search for KPI categories as shown below. Select on icon in left pane. You can search for a specific category by its name or can search for a partial category name.
Search Metrics
Search Metrics
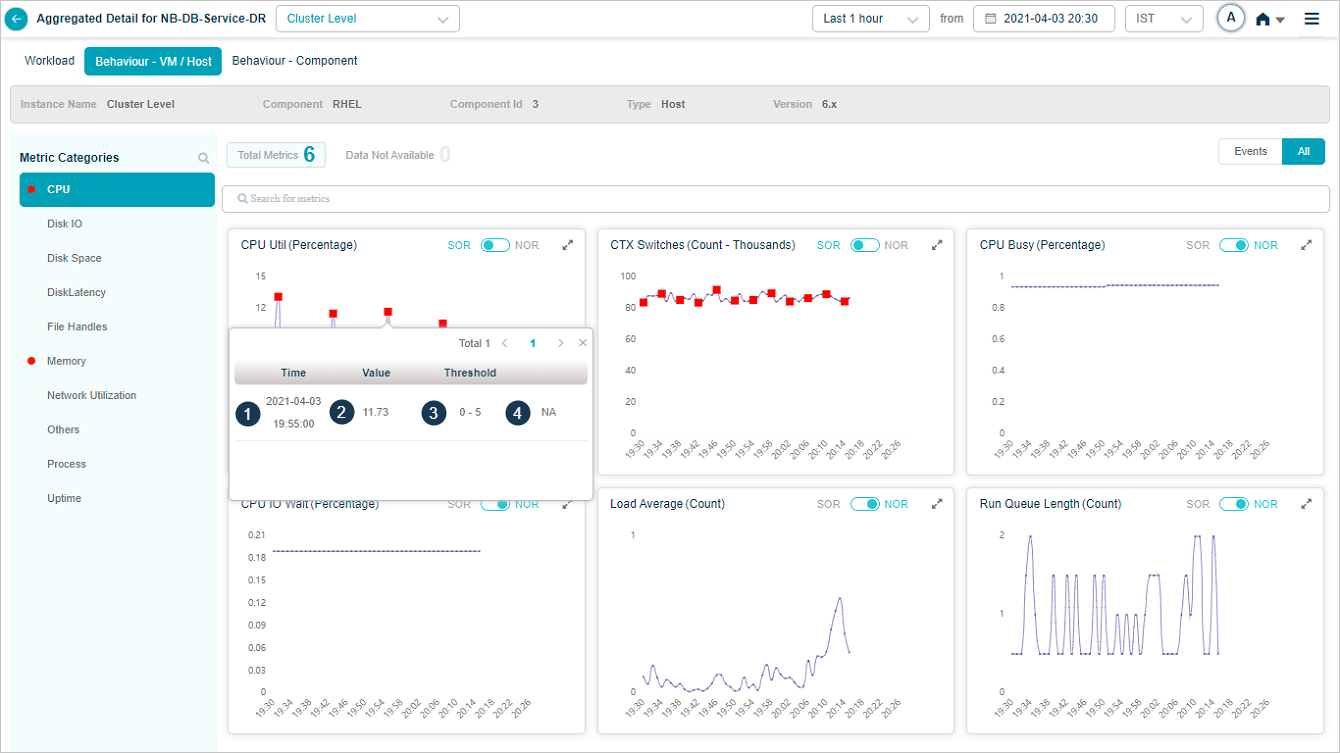
KPI Event Specifics
In a KPI trend, select on a red dot indicating an event to see event specific details as follows.
KPI Event_CPU Metric
| 1 | This displays Date and time of occurrence of an event. |
| 2 | This displays KPI value at an event. |
| 3 | NOR or SOR threshold range. Either MLE or SOR processor triggers an event. An event indicates that the KPI value is not within the threshold range. |
| 4 | This displays Forensics associated with an event. If there is no forensics, NA is displayed. |
Anomaly Score
Anomaly score is a number between [0,1] which indicates how big or severe the event is. It is associated with all KPIs and transactions where HEAL generates events.
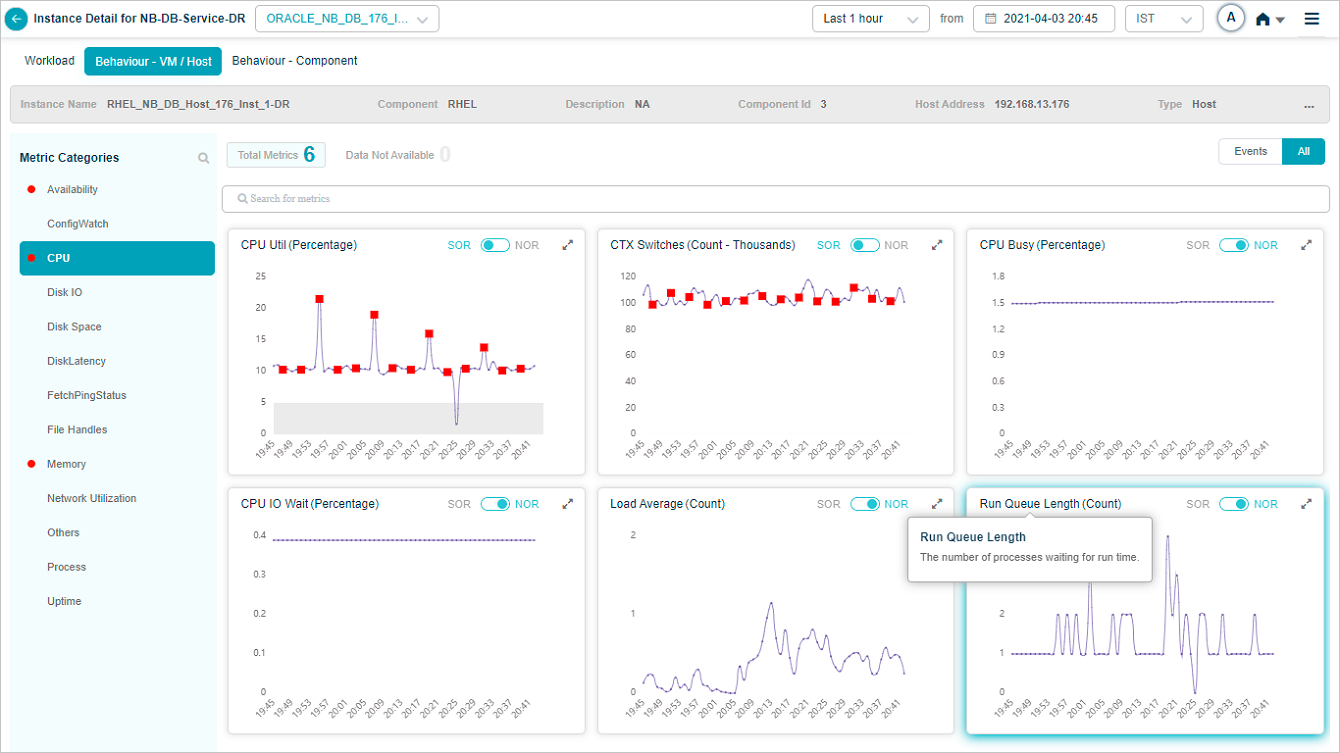
KPI Data at Instance Level
Service Details screen at instance level looks as below.
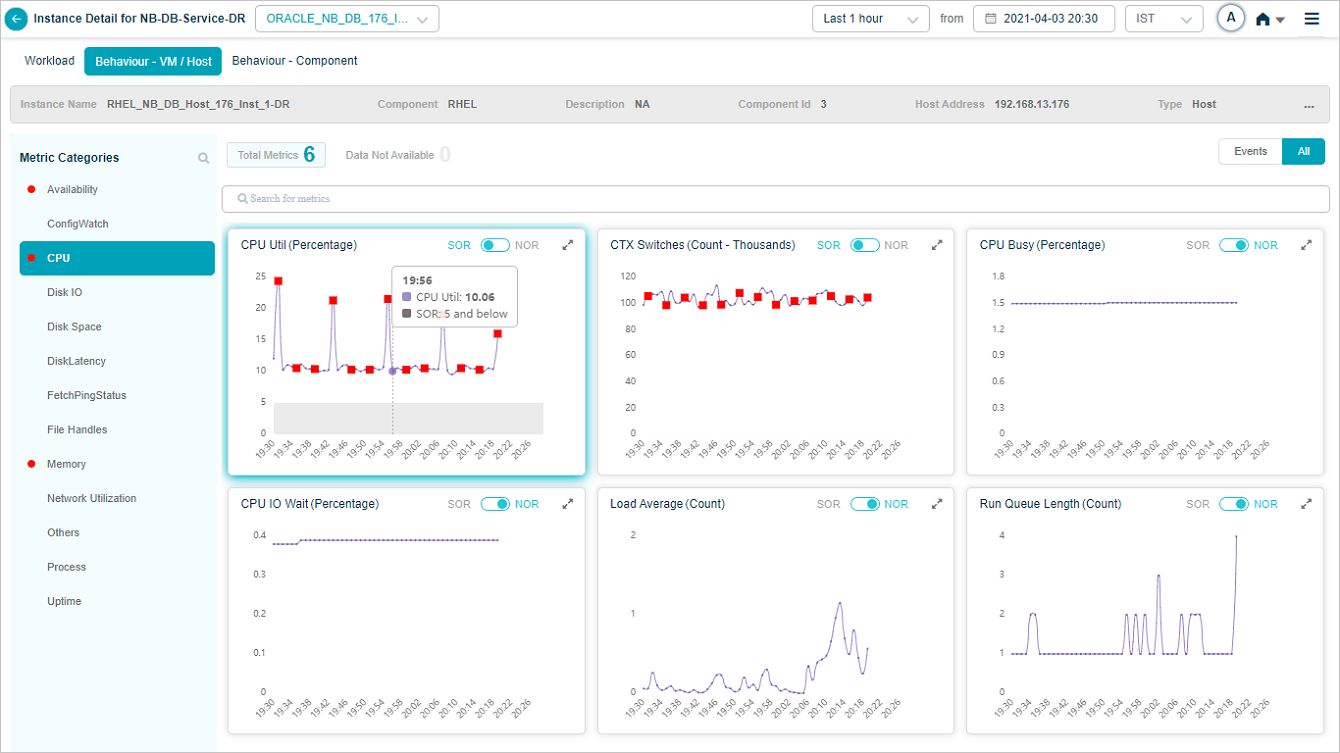
CPU Metric – CPU Util (Percentage)
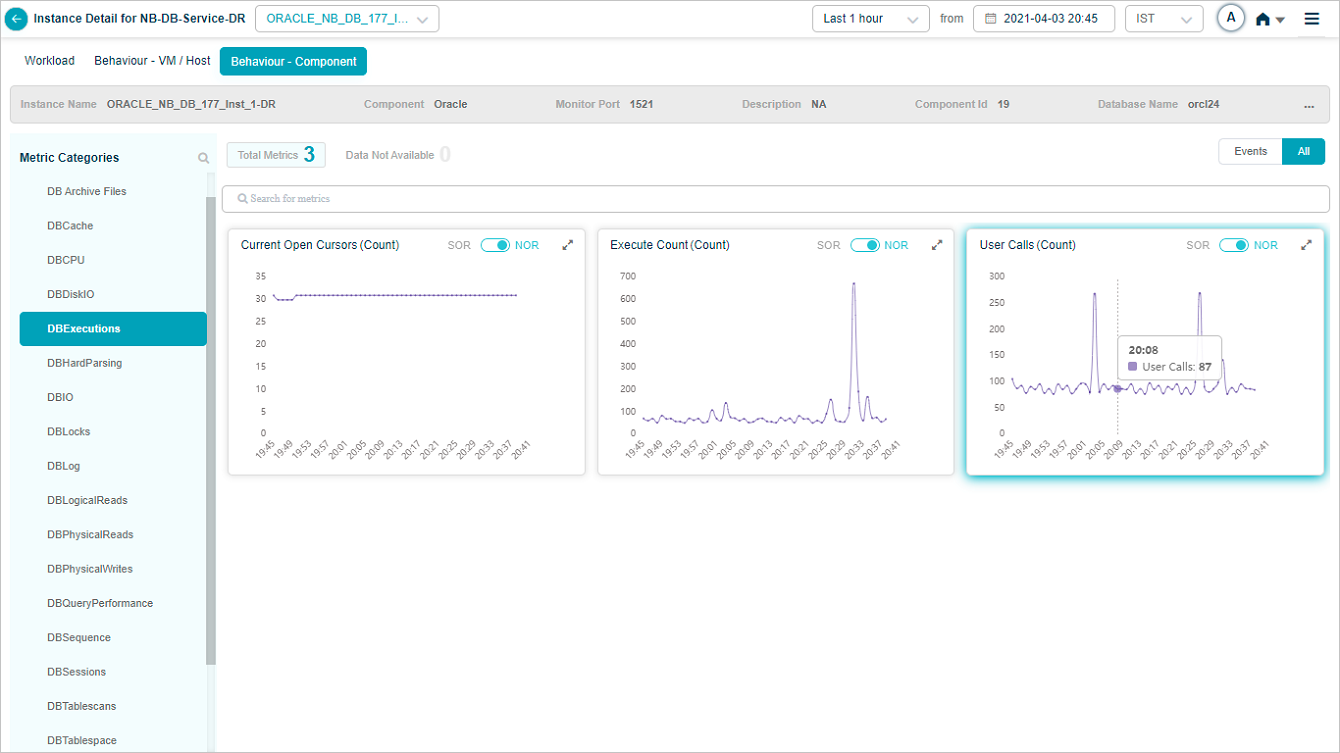
Metric DBExecutions – User Calls (Count)
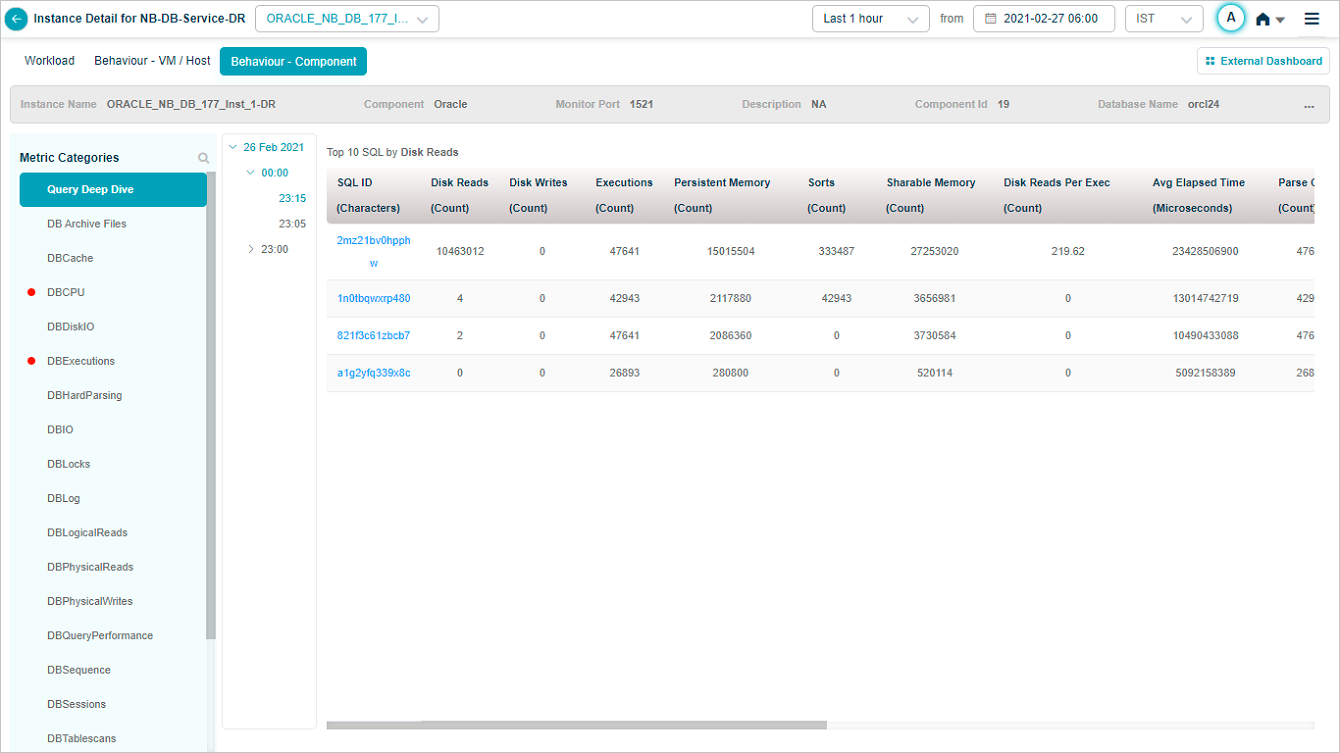
Metric – Query Deep Drive
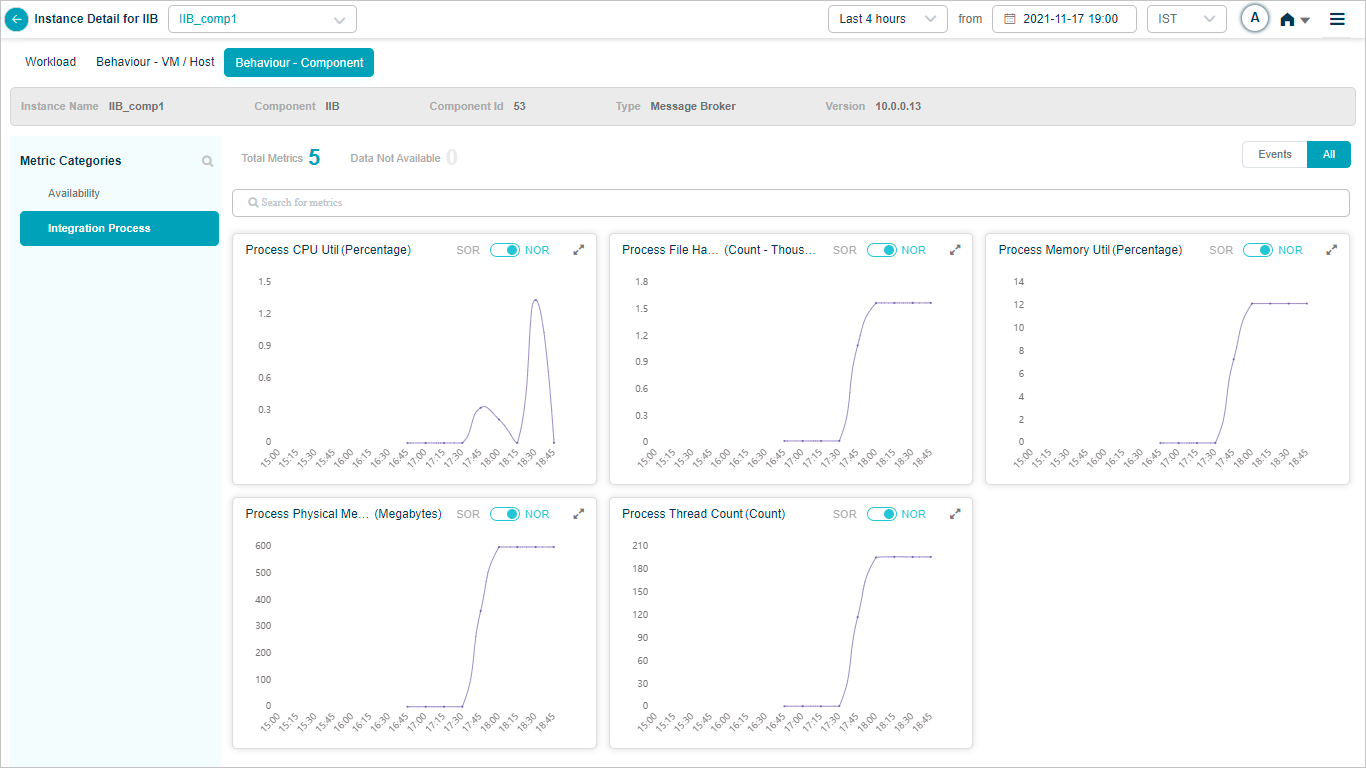
Metric – Integration Process
IBM Storage KPIs
When you map SAN_NAS instances to IBM storage component using Control Center, you can view IBM Storage KPIs in HEAL.
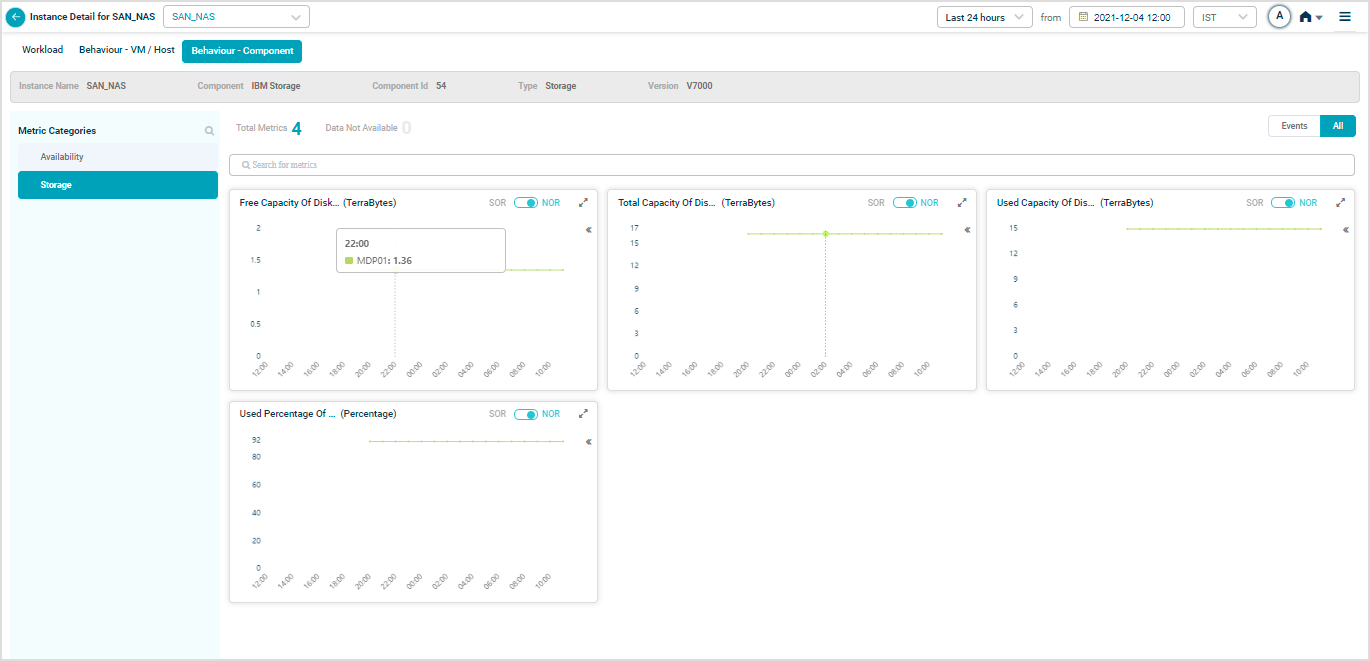
Metric – Storage
IBM HTTP Server KPIs
When you map IHS-Web-Service-122 instances to IBM HTTP Server Component using Control Center, you can view IBM HTTP Server KPIs in HEAL.
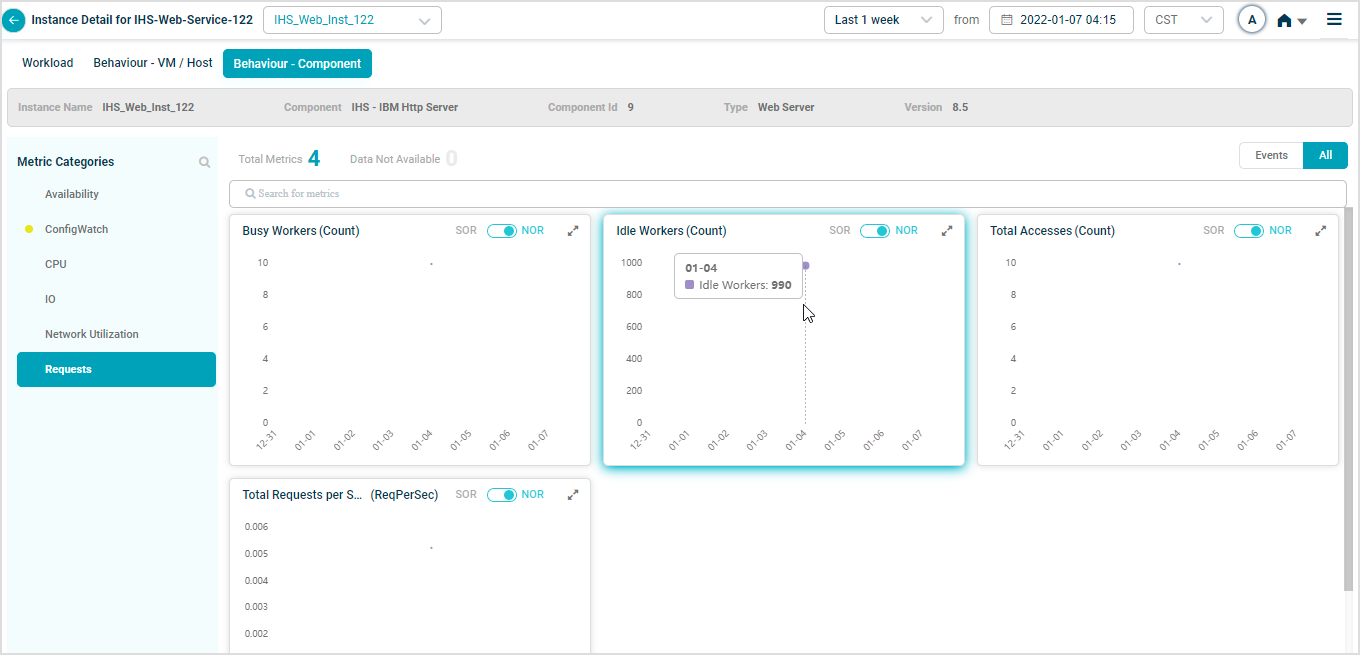
Metric – Requests
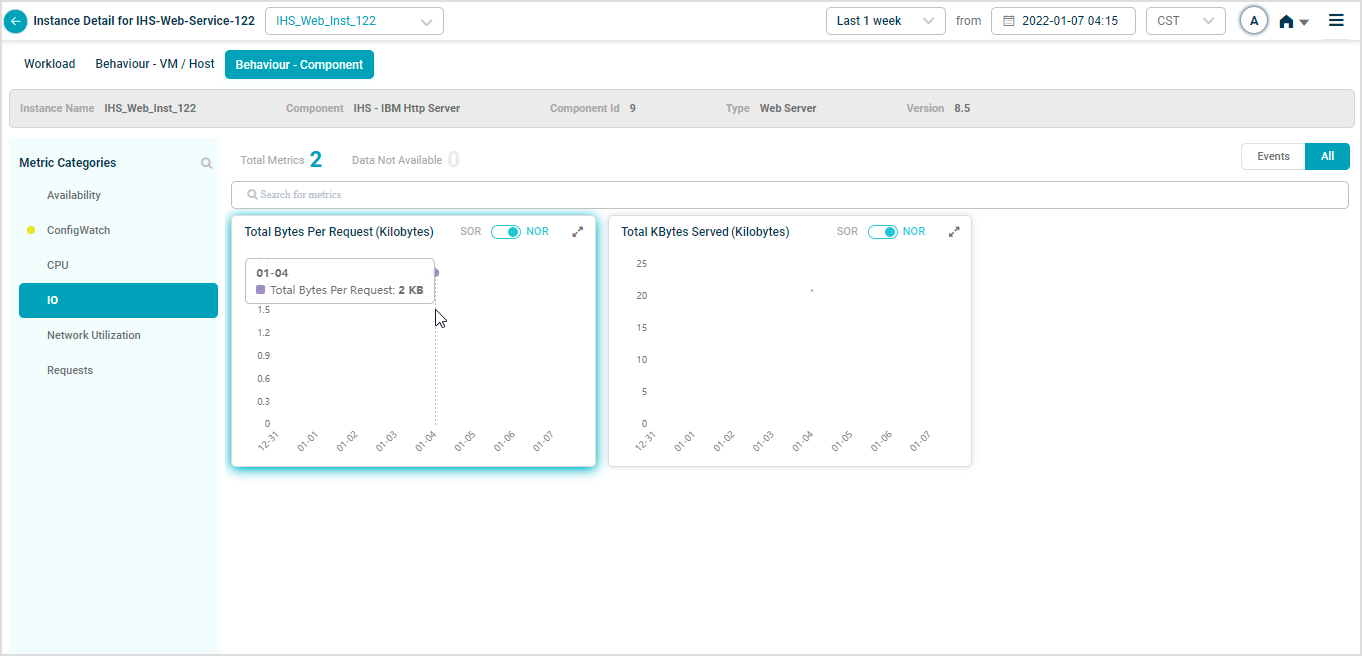
Metric – IO
WebSphere KPIs
When you map WAS-App-Service-122 instances to WebSphere Component using Control Center, you can view WebSphere KPIs in HEAL.
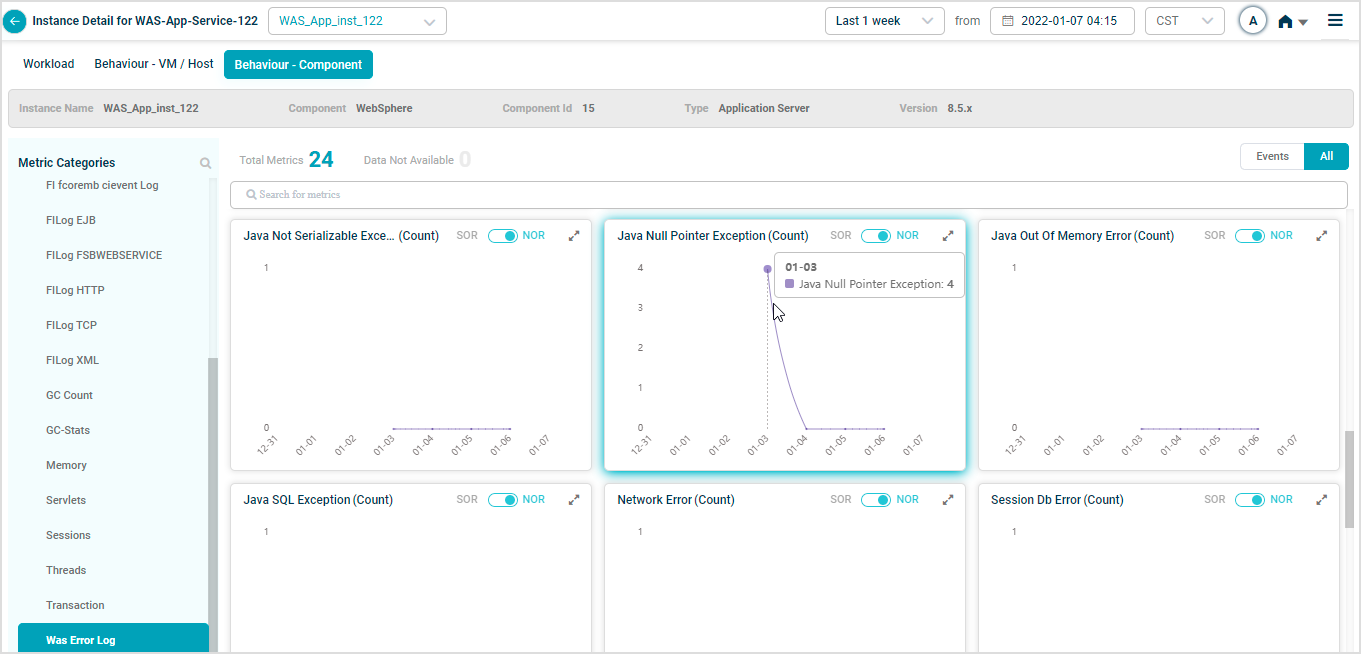
Metric – Was Error Log
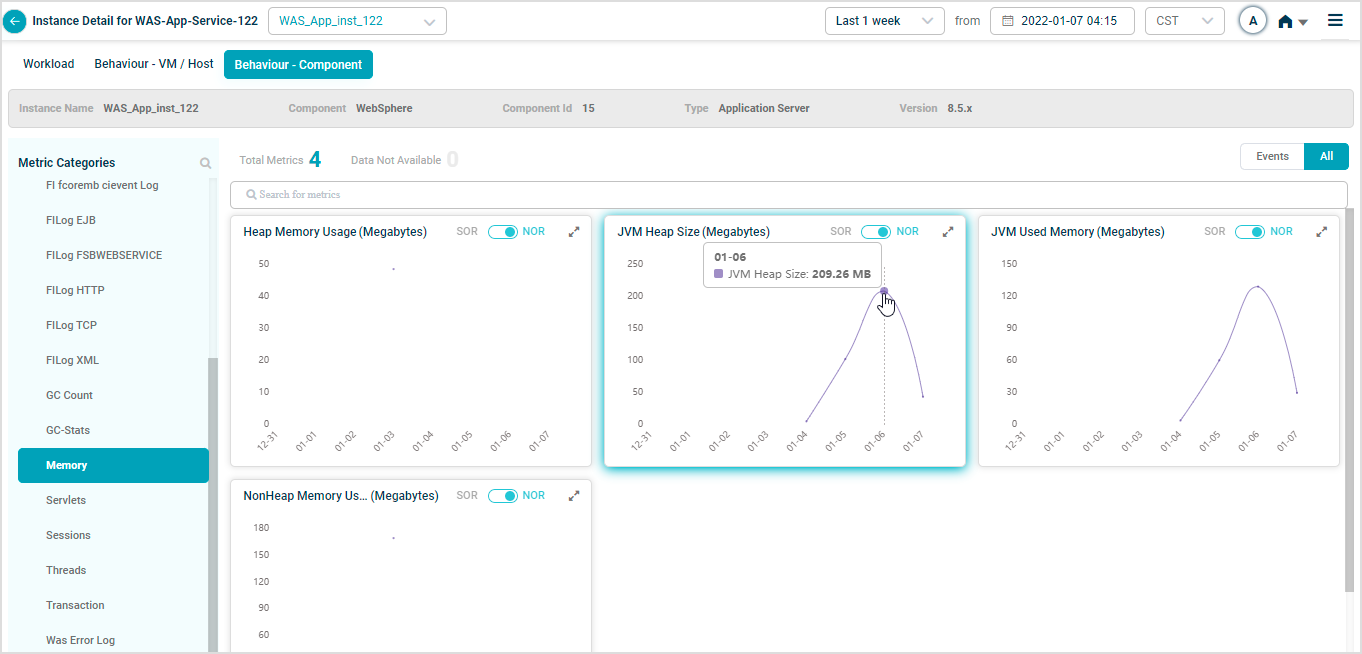
Metric – Memory
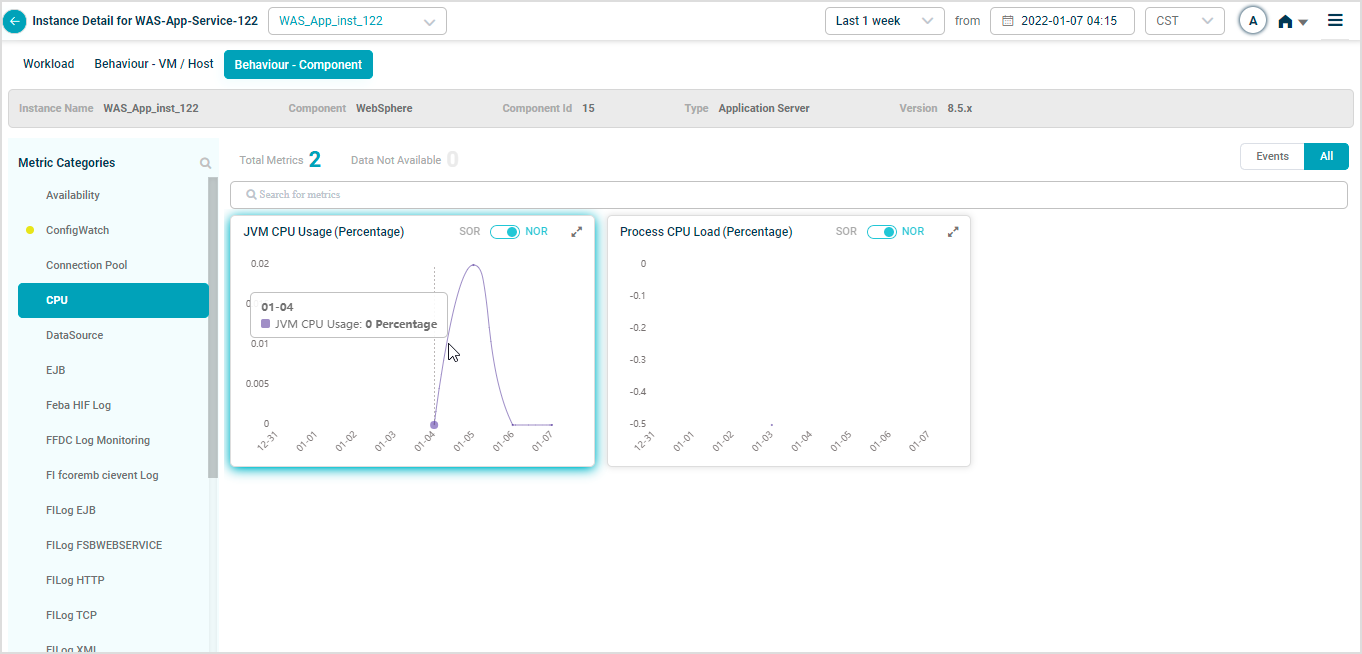
Metric – CPU
Monitor JMX MBeans
There is a collection of MBeans and attributes that are already provided by the Java platform out of the box. HEAL monitors the performance of MBeans for troubleshooting problems using the below KPIs.
- Garbage Collector – Collection Time: This is the total amount of time spent performing garbage collection in milliseconds and is another excellent candidate to profile the behaviour of your Java application.
- Garbage Collector – Collection Count: This indicates the number of garbage collection events fired since the JVM was launched.
Query Deep Dive
HEAL monitors databases to the extent of SQL queries in the deep dive section of the database service heat map. HEAL monitors and stores all the top slow running queries that are consuming resources in the database under this section.
KPI Full View
Select icon in a KPI pod to display the full view of the pod as shown in following screen.
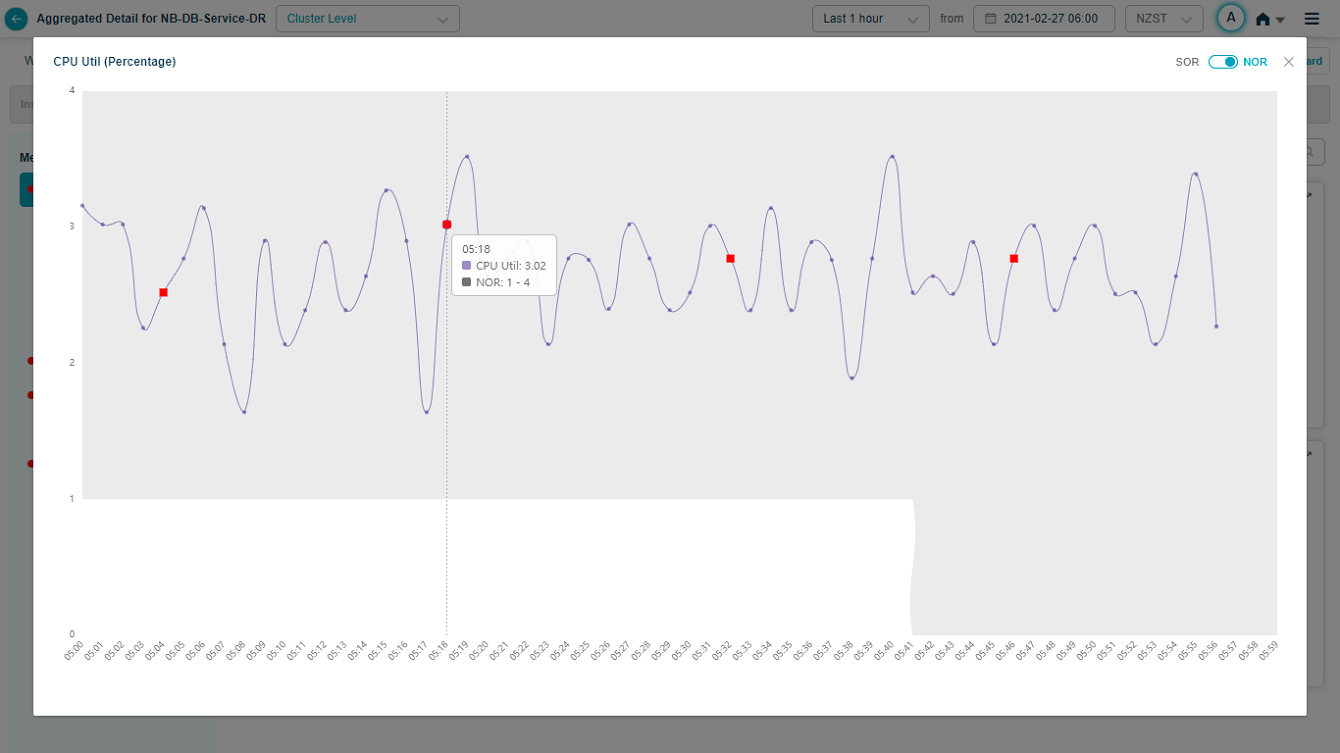
KPI Full View
KPI Description
Application displays KPI description on hover of KPI name in a KPI pod. If description is not available, then application displays ‘KPI description not available’ message.
KPI Description
KPI Description
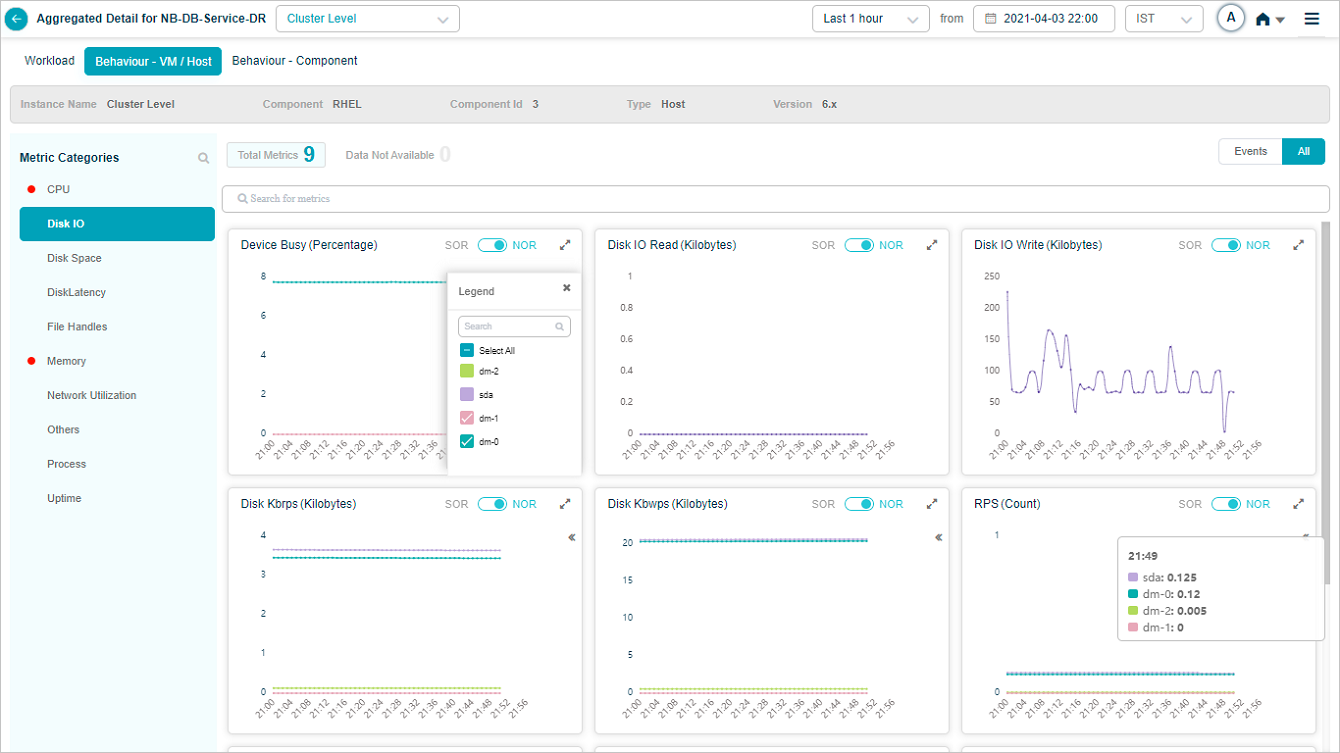
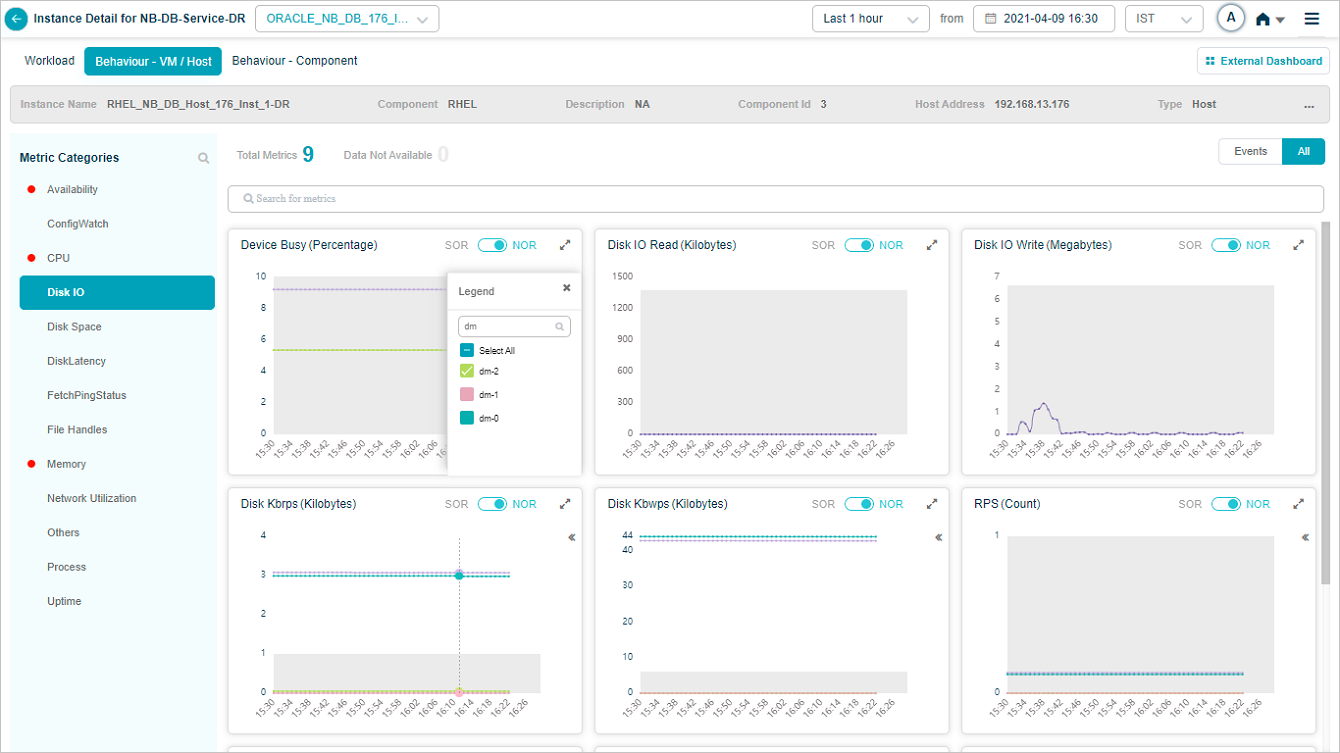
Group KPIs
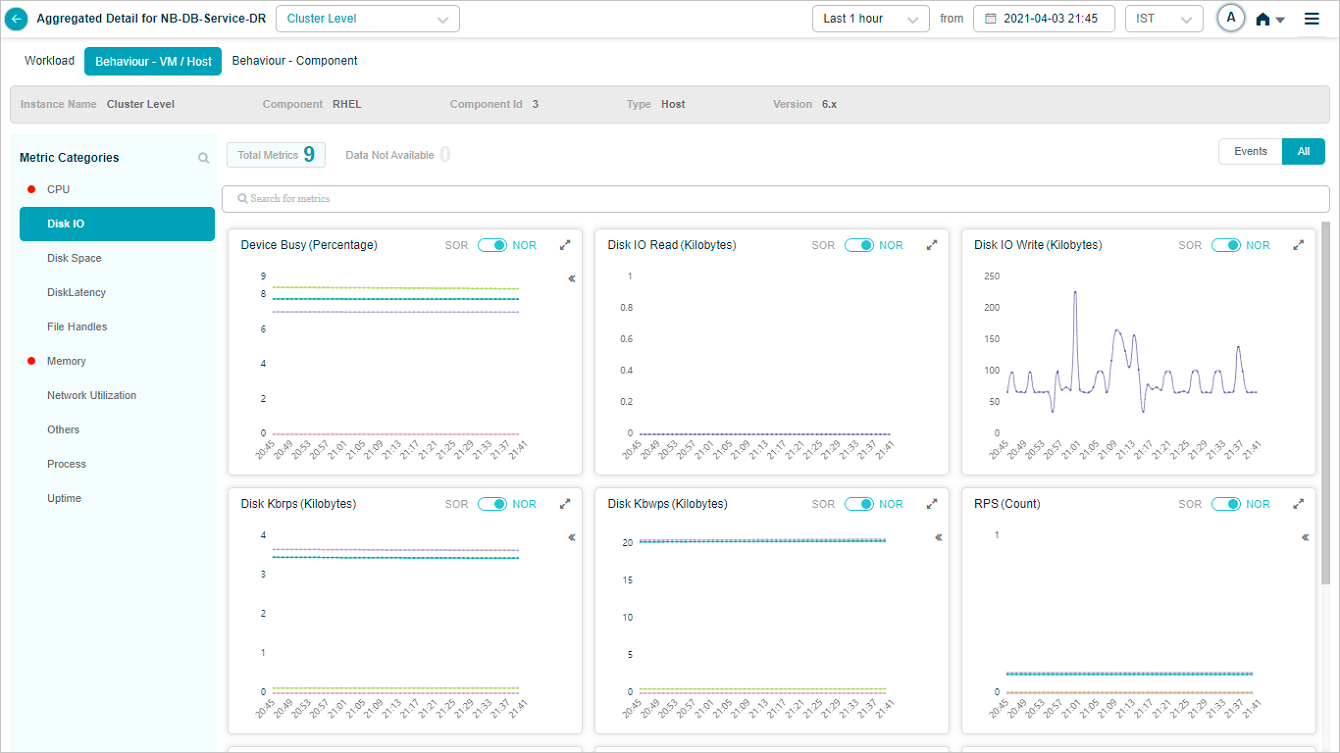
Metric – Disk IO
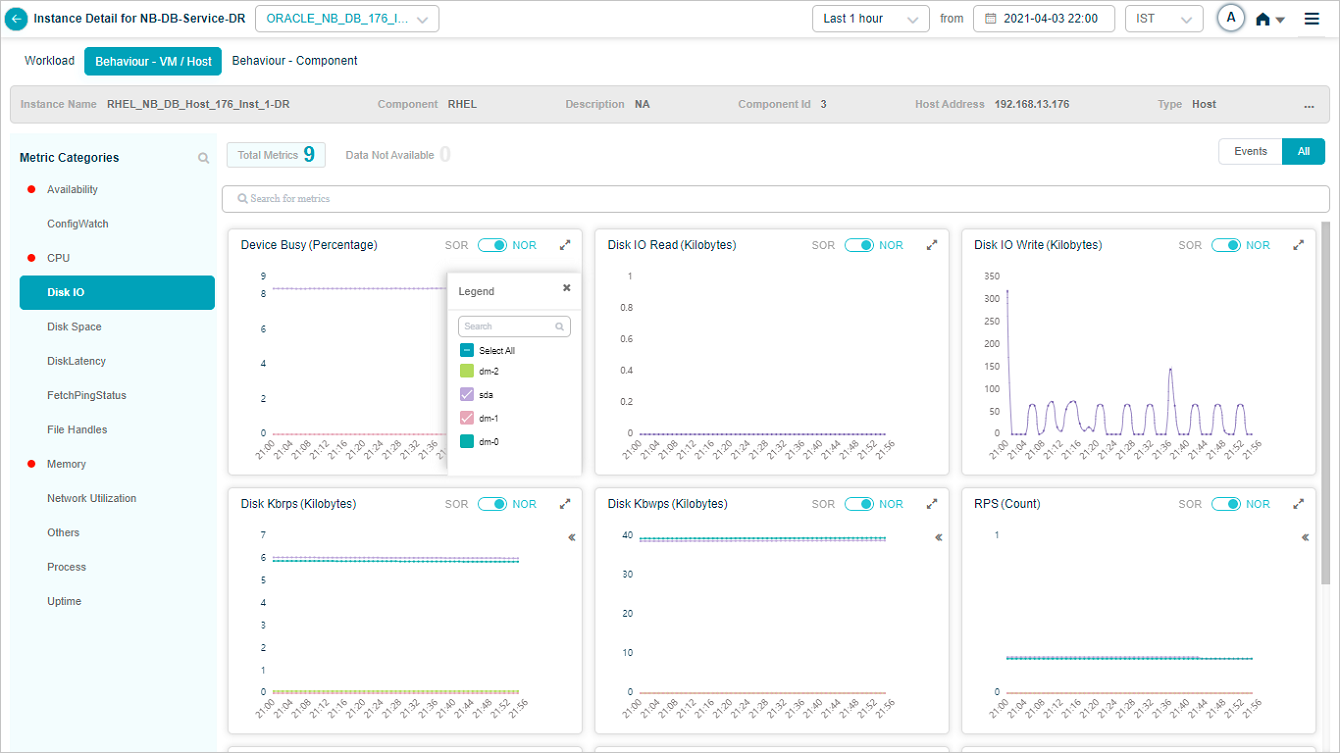
Legends are displayed only for group KPIs. Select icon in a group KPI pod to view the attributes associated with that group KPI. Attributes with events are displayed in the beginning.
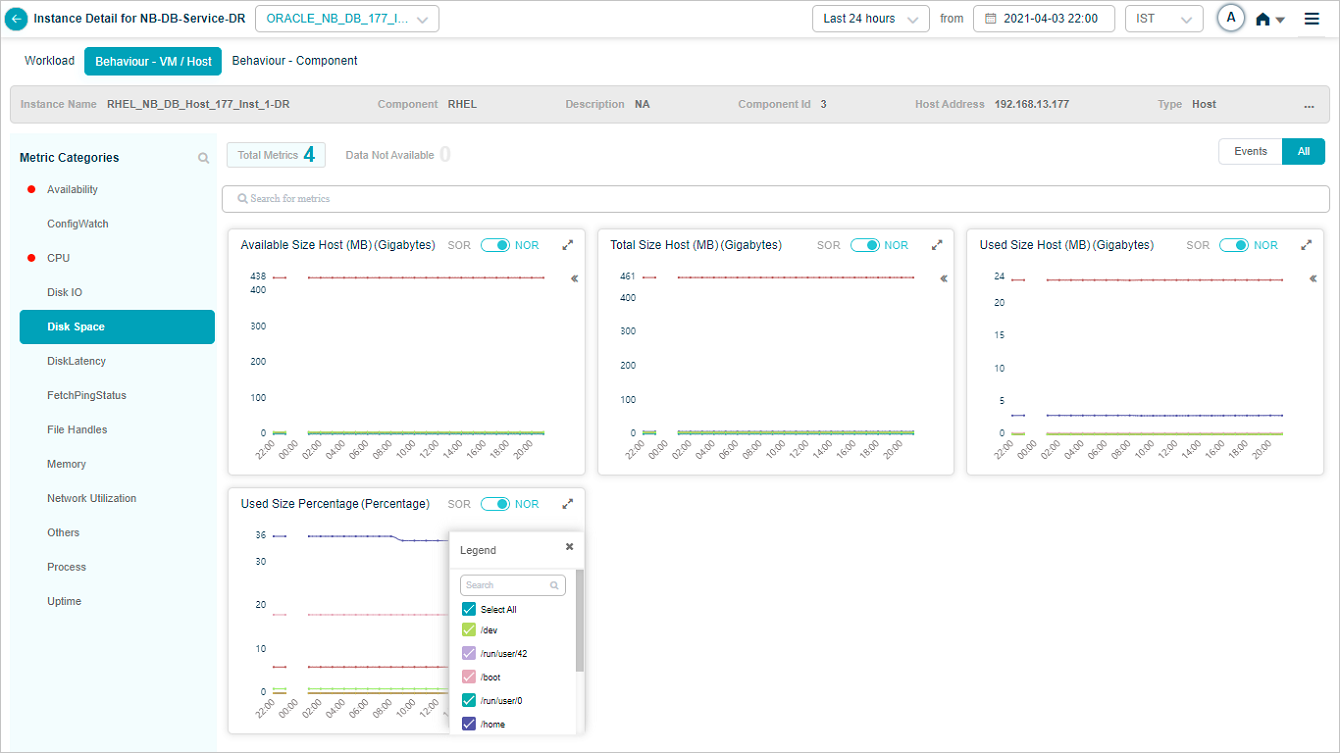
Metric – Disk Space
Metric – Disk IO
Metric – Disk IO_Device Busy (Percentage) & RPS (Count)
Metric – Disk IO
Metric – Disk IO
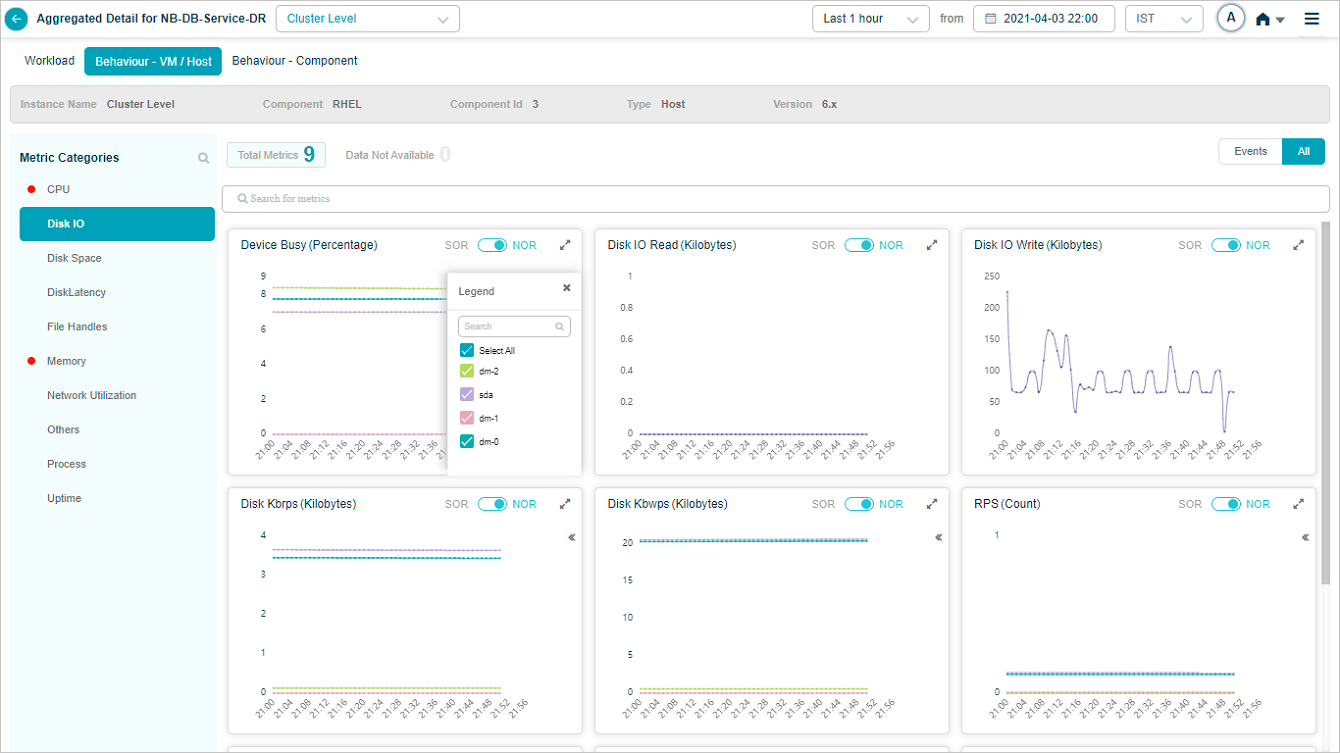
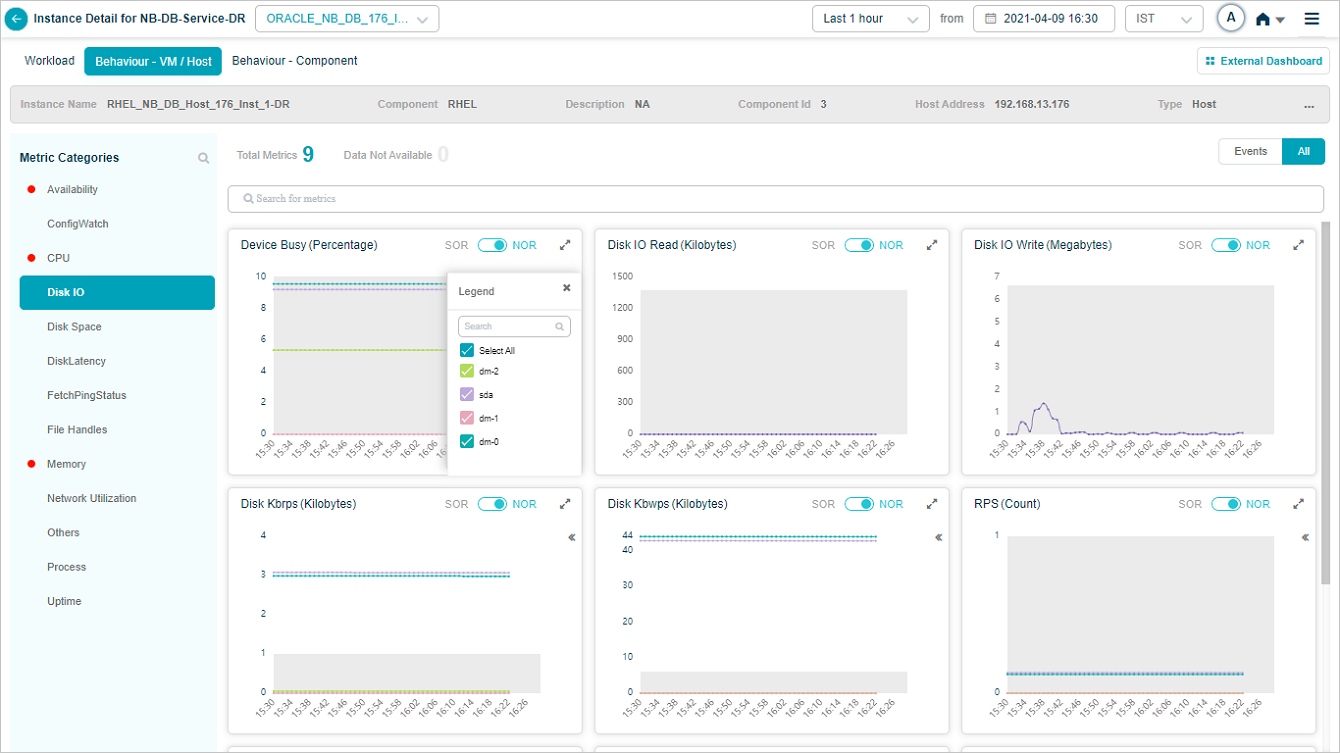
You can search for specific attribute(s) of a group KPI in the tooltip of a group metric pod. You can search by partial string or full attribute name.
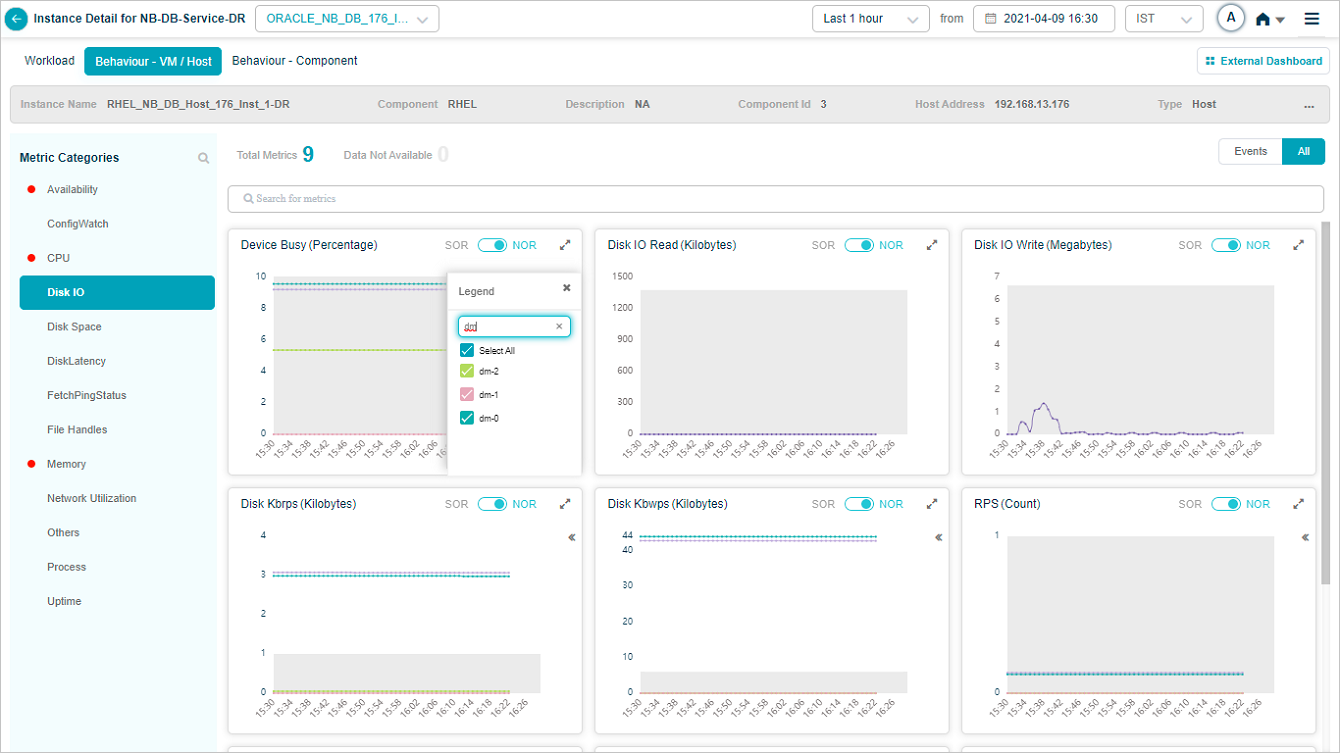
Metric – Disk IO
You can select or deselect the attribute(s) of your choice from the search result.
Metric – Disk IO
Data for the attribute(s) you select is displayed in the respective metric pod.
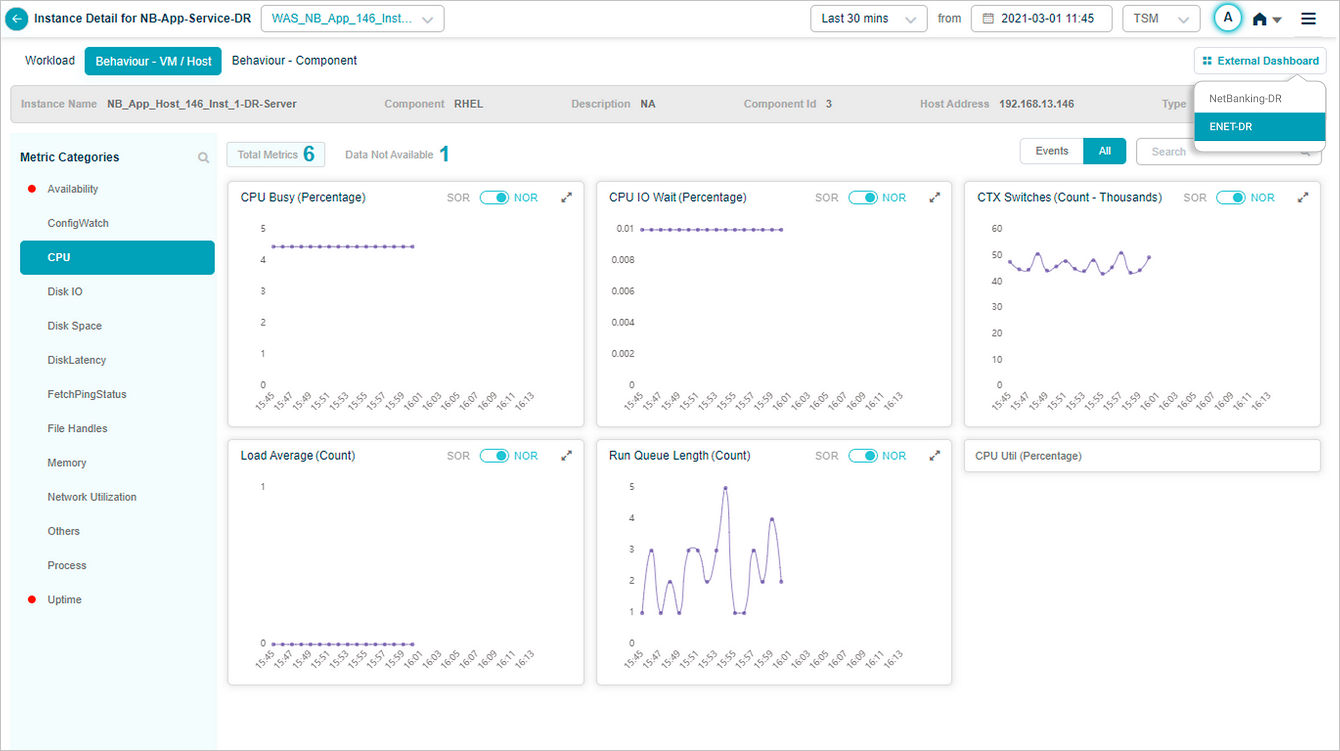
External Dashboard Link
If you create a dashboard in Grafana for an application in HEAL, you can view External Dashboard link to navigate to the Grafana dashboard from Service Details screen.
Health Summary
Select External Dashboard link to navigate to the Grafana dashboard for the application in a new tab. Grafana plugin preselects this service in the dashboard. In case the service belongs to multiple applications, you can see a drop down listing all the applications. You can choose the application to view specific Grafana dashboard.
Metric – CPU
Metric – CPU