
AIOps vs Observability vs Monitoring: What Enterprises Actually Need
by Renuka Suresh | Mar 17, 2026
63% of all IT alerts go completely uninvestigated. Not deprioritized. Not deferred. Simply ignored. And it's because the industry has spent two decades building monitoring infrastructure that generates volumes of data and almost no actionable intelligence.
Most enterprises today are simultaneously over-tooled and under-informed. They have dashboards for their dashboards. Their on-call teams are drowning in notifications. And when a real incident hits, the kind that costs $300,000 or more per hour, many organizations are still scrambling to figure out which of their fifteen monitoring tools has the answer.
If you're an IT Director, CTO, or Application Head reading this, chances are you've seen three terms talked about interchangeably in every vendor pitch you've heard this year: Monitoring, Observability, and AIOps. They sound similar. They overlap in confusing ways.
We're going to have an honest, strategic conversation about what these three approaches actually mean for your operations, what they do well, where each one fails on its own, and why the sequence in which you deploy them matters far more than most technology leaders realize.
The Problem Nobody Is Framing Correctly
Before we define monitoring, observability, or AIOps, let's talk about the problem they are all supposed to solve.
The core problem is not "how do we watch our systems?" It's "how do we turn operational noise into operational decisions, fast enough to matter?"
In the last five years alone, microservices architectures have exploded the number of components that generate telemetry. A single customer transaction that used to touch one monolithic server now bounces through twenty or thirty services, each spinning up and down dynamically across multiple cloud providers. The data volume has grown tenfold, and it is only accelerating, meanwhile, the people interpreting that data have not.
That gap is the central problem, and it reshapes every decision you make about monitoring, observability, and AIOps. The question is not "which tool should I buy?" The question is: "How do I build an operational intelligence stack that gets smarter as complexity grows, instead of noisier?"
Monitoring: What It Actually Does (And Where It Hits a Wall)
Monitoring is the oldest and most mature layer in the operations stack. At its core, monitoring watches predefined metrics, CPU utilization, memory, disk I/O, network throughput, error rates, response times and triggers alerts when those metrics cross thresholds you've set in advance.
For decades, that was enough. When applications were monolithic, when servers were physical, when deployments happened quarterly, monitoring handled it.
But here is where monitoring hits a wall in modern enterprises:
The Known-Unknowns Limitation
Monitoring is fundamentally built on the assumption that you know in advance what to watch. This works for "known" failure modes, the ones you've seen before and can anticipate. But modern distributed systems fail in ways that nobody anticipated. Monitoring cannot catch what it was never told to look for.
The Alert Storm Problem
This is the problem that has quietly become one of the most expensive operational burdens in enterprise IT. Research shows that organizations manage an average of ten to eleven separate security and monitoring consoles. Each tool generates its own alert stream. A single infrastructure event can trigger dozens of separate alerts across platforms, each requiring independent investigation.
The result?
- Over 75% of IT teams experience alert fatigue at least monthly.
- More than half face it weekly or daily.
- Teams spend over fourteen hours per week chasing false positives.
- Organizations are experiencing major outages not because they lacked monitoring, but because real alerts were buried under noise.
Monitoring's biggest failure is not that it misses problems, it's that it catches too many non-problems, training your team to stop paying attention. You are not suffering from a lack of alerts. You are suffering from a lack of signal.
Observability: The Depth That Monitoring Cannot Provide
If monitoring tells you "something is wrong," observability tells you "what is wrong, why it happened, and where in the system the failure originated."
Observability is not just "better monitoring." That is a common misconception. It is a fundamentally different approach. Rather than tracking predefined metrics against predefined thresholds, observability works by collecting three types of telemetry data, logs, metrics, and traces and using them to infer the internal state of a system based on its external outputs.
The Pillars, and Why They Matter Together
Each pillar answers a different question, and if you rely on only one or two, you are operating with dangerous blind spots.
- Metrics tell you what happened, a latency spike, a CPU surge, a throughput drop. They are fast, efficient, and great for dashboards. But they cannot explain why it happened.
- Logs tell you the context of what happened, the sequence of events, error messages, and user actions leading up to the issue. They are rich in detail but enormous in volume and difficult to query at scale without proper tooling.
- Traces tell you where it happened, they follow a single request as it moves across your distributed system, service by service, showing exactly where the latency or failure occurred.
When a latency spike hits checkout service, metrics reveal the spike. Logs show the error entries on the failing node. Traces follow the request path across twenty services and identify the root cause. No single pillar gives you that full picture.
The "Unknown Unknowns" Advantage
Here is the perspective most IT leaders are missing about observability, and it is perhaps the single most important concept in this entire piece:
Monitoring requires you to know what questions to ask in advance. Observability, by contrast, gives you the ability to ask questions you never thought to ask. Because you are collecting rich, correlated telemetry from every layer of your stack, you can investigate anomalies after they surface, even anomalies you never predicted.
Where Observability Falls Short on Its Own
Here is the part that observability vendors often gloss over: observability tells you what is happening and why, but it still depends on human beings to interpret the data, correlate it across systems, and take action. And in an environment where data volumes are exploding, human interpretation does not scale.
Observability gives you a high-definition camera into your systems. But if nobody is watching the camera, or if they are watching twenty cameras simultaneously and cannot tell which one matters, the visibility alone does not prevent outages.
AIOps: The Intelligence Layer
AIOps—Artificial Intelligence for IT Operations, is the layer that takes the data from monitoring and observability, applies machine learning to detect patterns and anomalies, correlates events across silos, suppresses noise, and increasingly triggers automated remediation without human intervention.
But here is the critical nuance that separates successful AIOps deployments from expensive failures:
AIOps Cannot Fix Bad Data
An AIOps platform is only as intelligent as the telemetry feeding it. If your monitoring data is fragmented across fifteen tools that do not share context, if your observability is shallow, covering only metrics without logs and traces, then your AIOps engine is performing pattern detection on incomplete, noisy data. The result is not intelligence. It is automated confusion.
Thoughtworks' 2025 analysis of more than sixteen enterprise AIOps deployments found that the implementations that failed did so for structural reasons, not AI capability. Failure happened when AI governance was missing, when operational knowledge was not AI-ready, and when there was no context engineering layer providing enterprise-specific memory to the models.
AIOps is not a starting point. It is a capstone. The organizations that see the highest ROI from AIOps are the ones that first invested in consolidating their monitoring and deepening their observability. They built the data foundation before they asked AI to reason about it.
The Agentic AIOps Evolution
The newest and most significant evolution in AIOps is agentic AIOps platforms that don't just detect and correlate, but autonomously act. Traditional AIOps reduces noise but still depends on human judgment for the final step. Agentic AIOps enriches telemetry with business context, orchestrates self-healing workflows, and resolves certain incident categories automatically.
When a database timeout causes API latency that triggers customer-facing errors, an agentic AIOps platform initiates a remediation workflow, scaling resources, rerouting traffic, or rolling back a deployment, before a human engineer is even paged.
However, autonomous remediation has not been scaled beyond controlled environments. In practice, AIOps today delivers its strongest value in cognitive augmentation making teams dramatically faster and more accurate rather than replacing them.
Where AIOps Also Falls Short
Over half of enterprises that have implemented AIOps described the process as "challenging" or "very difficult." The most common obstacles are not technical, they are organizational: cost overruns, data quality problems, conflicts between IT silos, distrust of AI among operations teams, lack of specialized skills, and integration challenges with legacy systems.
The Comparison That Actually Matters
Now that we have explored each approach with the depth it deserves, let us put them side by side, not just on features, but on the dimensions that actually drive decision-making for IT leaders.
| Dimension | Monitoring | Observability | AIOps |
|---|---|---|---|
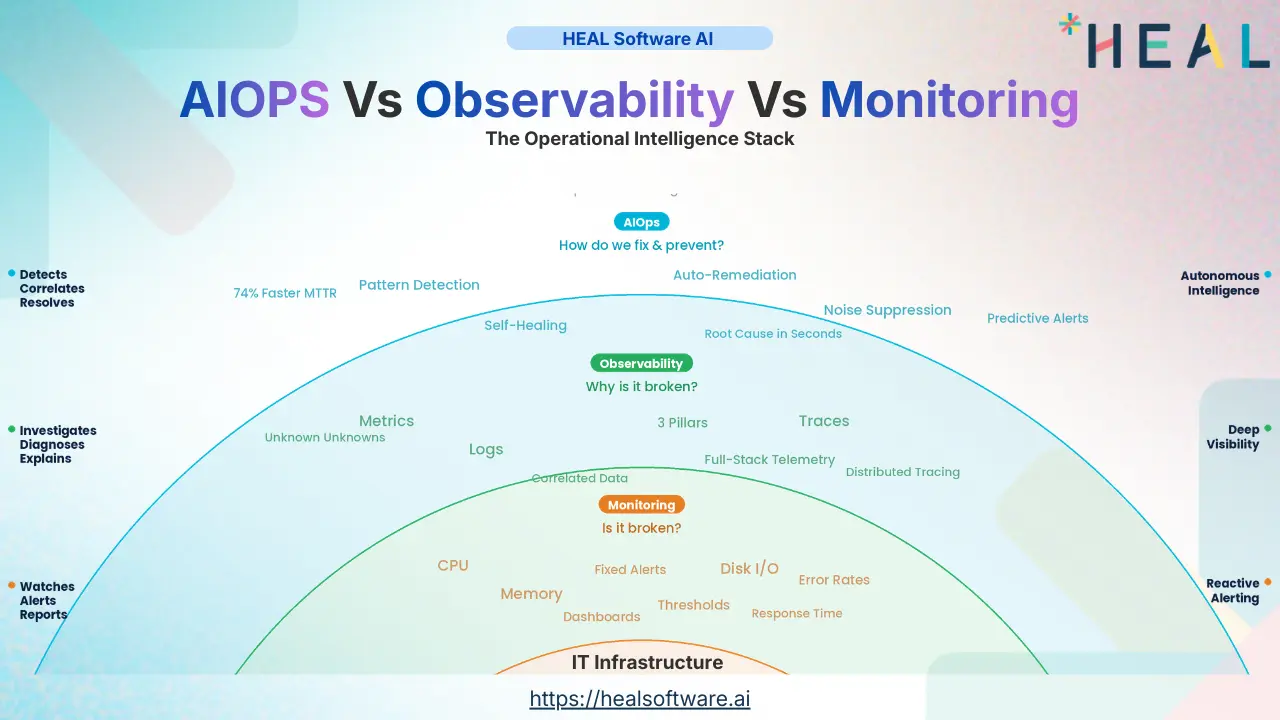
| Core Question | Is it broken? | Why is it broken? | How do we fix it—and prevent it? |
| Data Philosophy | Predefined metrics, fixed thresholds | Logs + Metrics + Traces, correlated | ML-driven correlation across all sources |
| Operational Posture | Reactive: alert when thresholds breach | Proactive: investigate before users notice | Predictive & autonomous: fix before it breaks |
| Handles Unknown Failures? | No—only known failure modes | Yes—can diagnose unanticipated failures | Yes—detects patterns humans would miss |
| Human Dependency | High: humans interpret every alert | Medium: humans investigate, tools guide | Low: automates triage, correlation, remediation |
| Time to Value | Days to weeks | Weeks to months | Months (requires mature data foundation) |
| Biggest Risk | Alert fatigue and noise | Data overload without actionable output | Garbage in, garbage out if data is poor |
| Ideal Environment | Stable, predictable infrastructure | Cloud-native, distributed, microservices | Complex, multi-tool, multi-cloud enterprises |
Why Sequence Matters More Than Technology
Here is the strategic insight that almost every vendor pitch and comparison blog completely ignores: The order in which you implement monitoring, observability, and AIOps determines whether you succeed or fail.
Far too many enterprises see AIOps as the shiny answer and try to leap straight to it. They buy an expensive AIOps platform, feed it fragmented data from ten different monitoring tools, and wonder why the AI generates as much noise as the tools it was supposed to replace.
The maturity progression that consistently delivers results looks like this:
Consolidate Your Monitoring Foundation
Before anything else, reduce your tool sprawl. If you are running ten or more monitoring tools (and if you are a mid-to-large enterprise, statistically you are), your first priority is consolidation. Not because the individual tools are bad, but because fragmented tools produce fragmented data, and fragmented data cannot be correlated. Many enterprises discover that 40% of their monitoring tools have overlapping coverage and none of them share a common event model.
Deepen Observability Across the Stack
Once you have a consolidated, clean monitoring foundation, layer in observability. This means moving beyond metrics alone into full telemetry: distributed tracing for microservices, structured logging with consistent schemas, and correlation across all three pillars. OpenTelemetry has become the de facto open standard for collecting telemetry across cloud-native environments, and adopting it now prevents vendor lock-in later.
Operationalize AIOps on a Mature Foundation
Only when your data foundation is consolidated, your telemetry is deep and consistent, and your teams have established clear incident response processes should you layer in AIOps. At this stage, AIOps has clean, correlated data to reason about. Its pattern detection works because the patterns are real, not artifacts of fragmented or missing data.
Organizations that follow this sequence report dramatically better outcomes: 35–40% reductions in L1/L2 ticket volume, root cause analysis cycles shortened from hours to minutes, and significant improvements in mean-time-to-resolution.
AIOps is not an alternative to monitoring and observability. It is a multiplier on top of them. And a multiplier applied to a broken foundation just amplifies the dysfunction.
Five Questions Every IT Leader Should Be Asking
If this information is shifting your thinking from "which tool should I buy?" to "what operational capability am I missing?", here are five questions we believe every CTO, IT Director, and Application Head should be confronting right now:
- What percentage of our alerts are actually actionable?
If you do not know this number, you are flying blind. Industry data shows that 46% of all alerts are false positives. If your ratio is similar, almost half of your operations team’s time is spent investigating noise. Calculate this number. Then set a target to cut it in half within six months. That single metric will drive better decisions than any vendor evaluation. - How many monitoring tools do we actually have and how many of them share data?
Most IT leaders underestimate this number. Conduct a full audit. Then ask the harder question: how many of these tools share a common event model that allows cross-tool correlation? If the answer is “few or none,” that is your biggest operational bottleneck, not a technology gap, but an integration gap. - When our last major incident occurred, how long did it take to identify root cause and why?
This question separates monitoring-stage organizations from observability-stage ones. If root cause analysis took hours because engineers had to manually correlate data across multiple tools and services, you do not have an observability capability, you have dashboards. True observability should give engineers the ability to trace an incident to its root cause within minutes, not hours. - Is our organizational structure enabling or blocking operational intelligence?
This is the question nobody wants to ask. If your network team, application team, cloud team, and security team all operate independently with their own tools, processes, and incident response workflows, no technology, not monitoring, not observability, not AIOPS, will overcome that fragmentation. Your organizational silos are your data silos. Solving one requires solving the other. - Are we investing in the right sequence, or chasing the latest trend?
If your monitoring foundation is fragmented and your observability is shallow, investing in AIOps will likely disappoint. Conversely, if your monitoring is solid but you are still debugging incidents manually without distributed tracing, AIOps is premature. Diagnose where you are in the maturity curve before deciding where to invest next.
The Cost of Getting This Wrong
Over 90% of mid-sized and large enterprises report that a single hour of downtime costs more than $300,000. For 41% of enterprises, that number exceeds $1 million per hour. Fortune 500 companies in sectors like finance and HEALthcare face downtime costs exceeding $5 million per hour.
And these are not just the costs of the outage itself. They include lost productivity, recovery expenses, compliance penalties, and customer trust erosion, the kind that quietly bleeds revenue for months after the incident is resolved.
The organizations that survive and thrive in this environment are not the ones with the most monitoring tools. They are the ones that have built an intelligent, layered operations stack where monitoring provides the raw signals, observability provides the depth, and AIOps converts both into fast, automated, accurate action.
Where HEAL Software Fits Into This Picture
If you have read this far, you understand that solving the monitoring-observability-AIOps challenge is not about buying another tool. It is about building a layered, integrated operational intelligence stack where each layer strengthens the others.
That is exactly what HEAL Software was designed to do.
HEAL Software unifies monitoring, observability, and AIOps into a single platform, purpose-built for enterprises that are tired of managing disconnected tools, drowning in alerts, and spending hours on root cause analysis that should take minutes:
- Consolidated visibility: One platform replacing fragmented monitoring stacks, eliminating the integration tax that drags down every multi-tool environment.
- Deep observability: Full-stack telemetry across logs, metrics, and traces, giving your teams the ability to diagnose unknown unknowns, not just react to known thresholds.
- Intelligent AIOps: ML-driven correlation, noise suppression, predictive alerting, and automated remediation, built on clean, consolidated data so the intelligence is real, not just more noise dressed up in an AI label.
- Business context awareness: Connecting infrastructure performance to business events, so your teams understand not just what is failing, but why it matters and who it impacts.
What Should Your Next Step Be?
Here is what we recommend:
- Audit your current state. How many monitoring tools do you have? What percentage of your alerts are actionable? How long does root cause analysis take? These three numbers will tell you more about your operational maturity than any vendor demo.
- Diagnose your maturity stage. Are you still struggling with alert noise and tool sprawl (monitoring stage)? Have you achieved visibility but lack diagnostic depth (observability stage)? Or are you ready to automate (AIOps stage)?
- Invest in sequence. Consolidate before you observe. Observe before you automate. And make sure each layer is healthy before building the next one on top.
About HEAL Software
HEAL Software is a renowned provider of AIOps (Artificial Intelligence for IT Operations) solutions. HEAL Software’s unwavering dedication to leveraging AI and automation empowers IT teams to address IT challenges, enhance incident management, reduce downtime, and ensure seamless IT operations. Through the analysis of extensive data, our solutions provide real-time insights, predictive analytics, and automated remediation, thereby enabling proactive monitoring and solution recommendation. Other features include anomaly detection, capacity forecasting, root cause analysis, and event correlation. With the state-of-the-art AIOps solutions, HEAL Software consistently drives digital transformation and delivers significant value to businesses across diverse industries.
Ready to see what this looks like in your environment?
HEAL Software helps IT leaders turn operational complexity into clarity, without adding to the stack.