
Application Performance Monitoring
Unified View of Application Performance, a complete visibility into every layer of application ecosystem, resolving incidents faster, and ensuring sustained reliability across business-critical services.
Request Demo
.jpg)
360
°Application Intelligence
80
%Faster Root Cause Analysis
65
%Reduced MTTR
90
%Real-time Application Insights
The Complexity of Modern Application Stacks
Maintaining a complete view of the application ecosystem is challenging when systems span cloud, microservices, APIs, and legacy infrastructure, leading to blind spots in performance, dependencies, and system behavior. These leads
Siloed Monitoring
Different tools for infrastructure, applications, and services create fragmented views, making cross-stack correlation slow and unreliable.
Hidden Dependencies
Complex architectures hide service relationships, making it difficult to see how one failure cascades across systems.
Slow Root Cause Identification
Without a unified observability layer, teams spend hours stitching logs, metrics, and traces to find the source of an issue.
HEAL Unified Application Performance Monitoring
End-to-end visibility into application behavior, service dependencies, and performance impact—ensuring stable, predictable, and high-performing digital services across your IT ecosystem.
Unified
Visibility
One correlated view across infrastructure, applications, and services eliminating silos and blind spots.
Faster Root Cause Identification
Correlation reduces root cause identification from hours to minutes, cutting through alert floods.
Dependency
Clarity
Real-time mapping of service interactions predicts cascading failures and quantifies business impact.
Reduced Resolution Time
Learns from behavior patterns, automating fixes and preventing recurring failure
From Stack Complexity to Operational Clarity
For Development and DevOps Teams
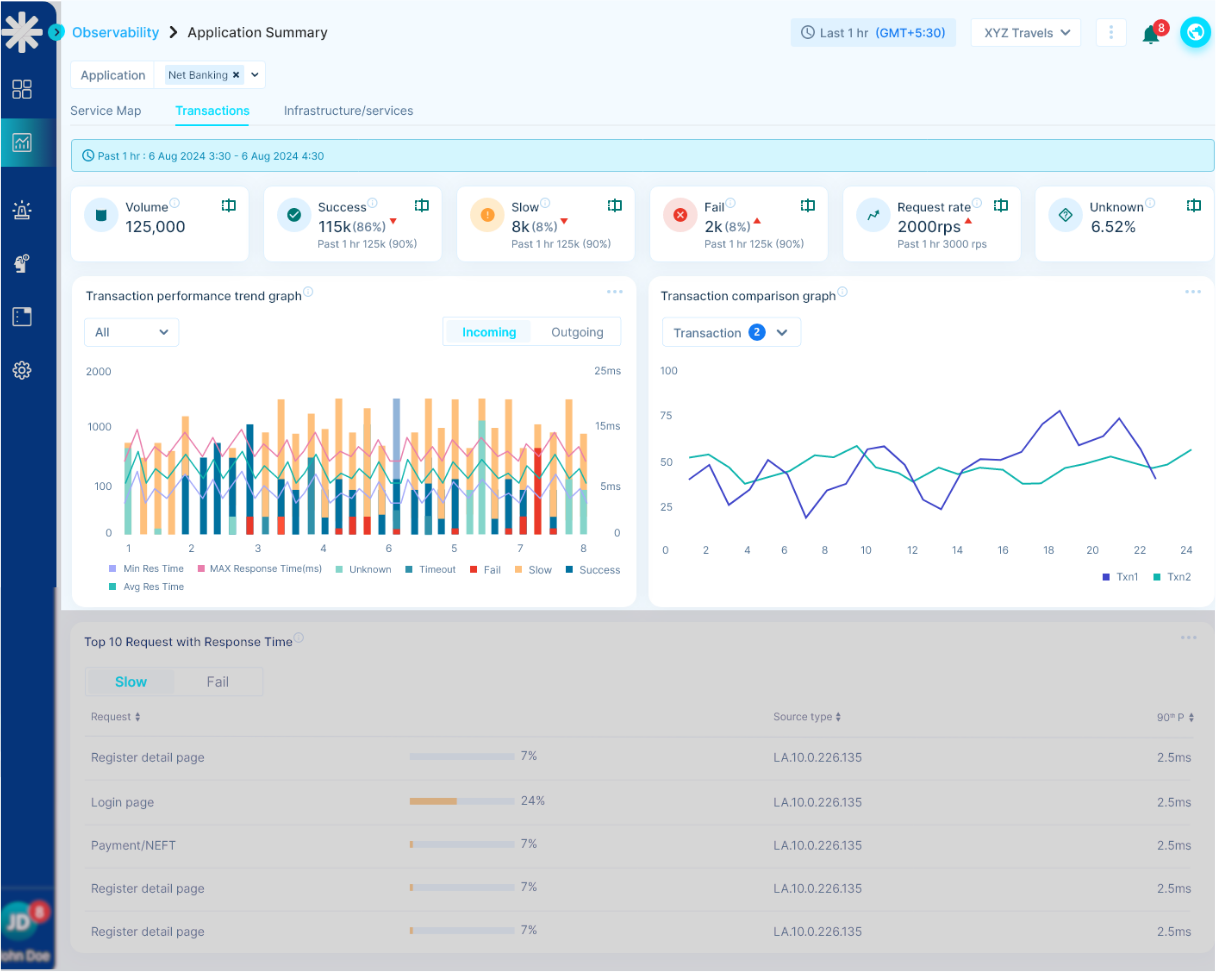
Complete Stack Visibility
- Monitor application health performance from frontend user interactions down to database queries and infrastructure metrics
- Trace requests across microservices, APIs, databases, and third-party integrations in real-time
- Identify performance bottlenecks, memory leaks, and resource utilization issues before they impact users
For Site Reliability Engineering Teams
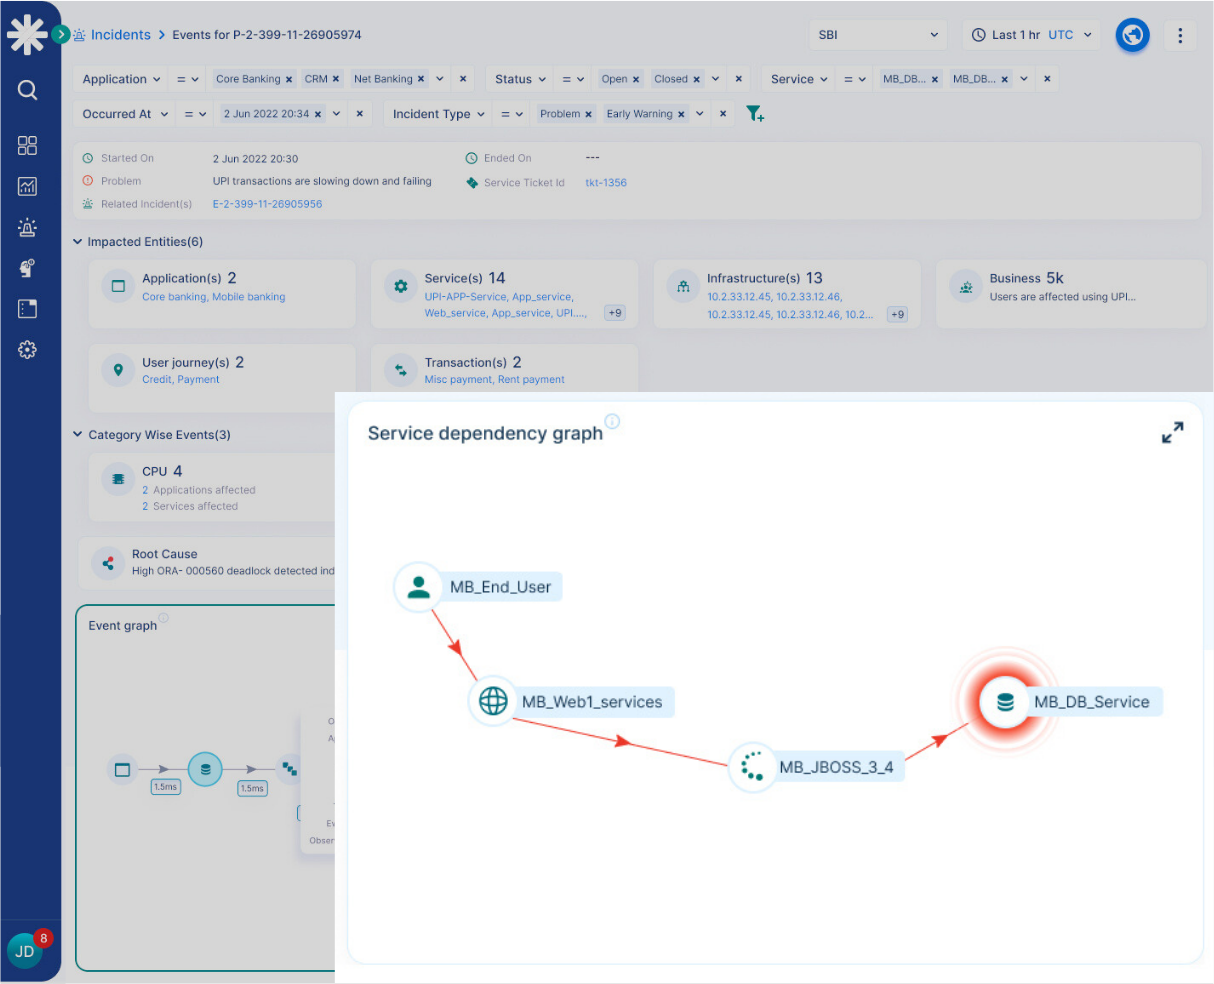
Service Dependency Mapping
- Automatically discover and map service dependencies to understand failure impact and radius
- Monitor service health and performance baselines to detect anomalies and predict potential failures
- Correlate incidents across the entire stack to accelerate root cause analysis and reduce MTTR
For IT Operations and Platform Teams
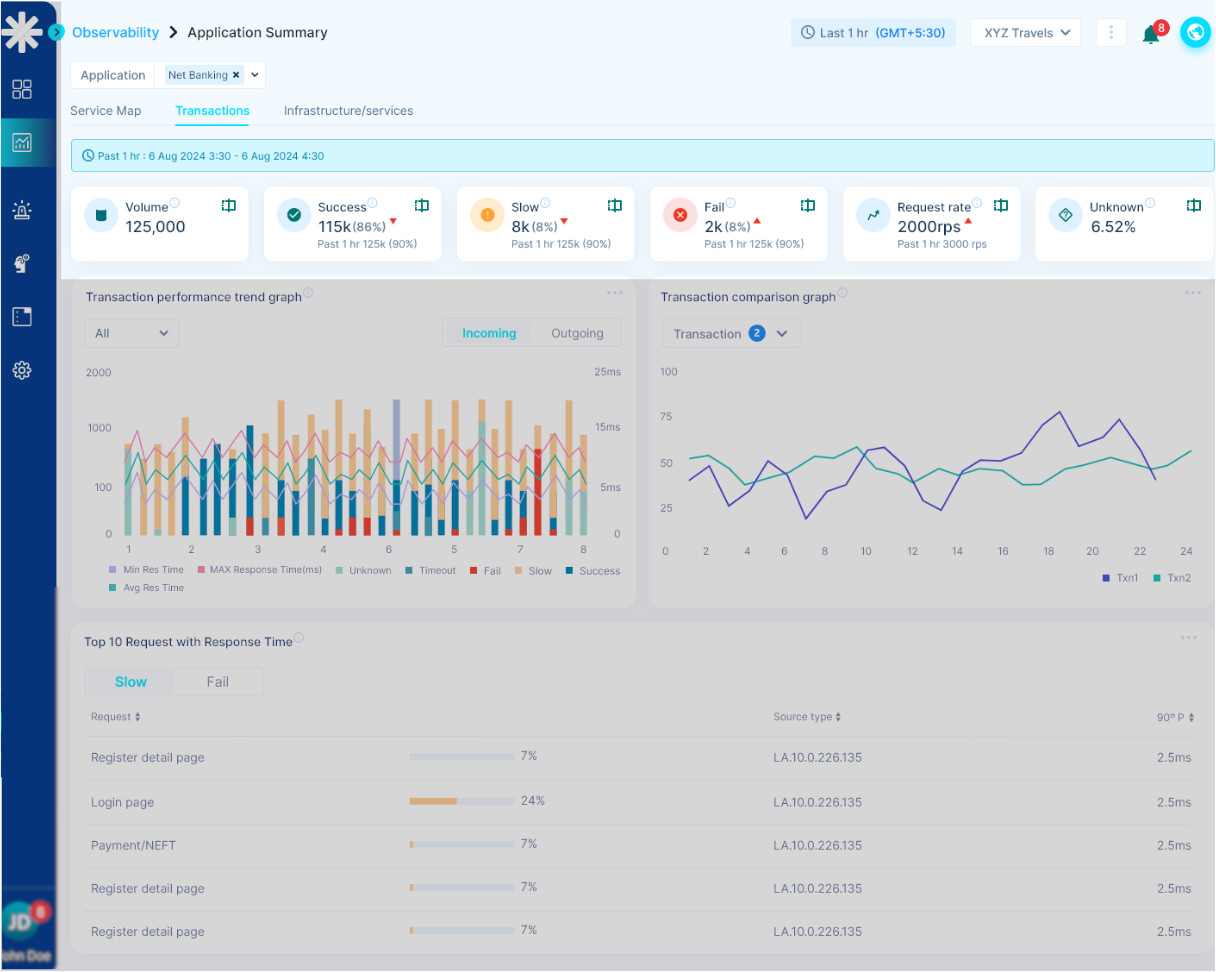
Unified Operational Intelligence
- Consolidate monitoring data from all stack layers into unified dashboards and alerting workflows
- Track application deployment impacts and performance changes across the entire technology stack
- Optimize resource allocation and capacity planning based on comprehensive stack performance data
Trusted by Leading Organizations
"Full Stack Observability transformed how we monitor our microservices architecture. We went from hours of debugging to minutes of precise issue identification."
"The distributed tracing capabilities gave us visibility we never had before. We can now see exactly how requests flow through our entire stack."
"Having unified observability across our entire application stack reduced our mean time to resolution by 80%. It's been a game-changer for our team."
FAQ
Get started with HEAL Software AIOps
Learn how HEAL's AIOps platform, enhanced by IndyGen Labs Agentic AI, keeps operations resilient and disruption-free.