
Anomaly Detection in HEAL Software AIOps
Published: May 19, 2026
Every week, thousands of engineers, SREs, and IT leaders type questions about anomaly detection into ChatGPT, Reddit, and Stack Overflow. They are all trying to answer the same underlying question: why do production incidents keep catching us off guard, and how do we stop them?
This article answers the ten most frequently asked questions about anomaly detection in AIOps, comprehensively, without jargon, and explains exactly how HEAL Software addresses each of them through its unified AIOps and Observability platform.
What is anomaly detection in AIOps, exactly?
Anomaly detection in AIOps is the automated process of identifying unusual patterns, behaviors, or deviations in your IT infrastructure, across logs, metrics, traces, and events, that signal a potential problem before it becomes a full-blown incident.
The term "AIOps" (Artificial Intelligence for IT Operations) was coined by Gartner to describe the application of machine learning and big data analytics to enhance and partially replace a broad range of IT operations processes. Anomaly detection is its most critical capability, because you cannot fix what you cannot find, and in complex distributed systems, human eyes alone cannot watch everything simultaneously.
The Core Insight
Traditional monitoring watches for known problems. Anomaly detection watches for unknown problems, behaviors that don't match the expected baseline, even if no alert rule was ever written for them. One catches the fire. The other catches the smoke.
Think of it this way: a static alert fires when CPU > 90%. An anomaly detection system fires when CPU climbs to 72% at 3 AM on a Tuesday, because that pattern has never occurred before and is statistically significant. HEAL's predictive anomaly engine operates exactly this way, detecting deviations from your system's specific baseline, not a generic industry average.
How does AI actually detect anomalies in production systems?
This question comes up constantly, and the answers are usually too vague or too academic. Here is what happens under the hood in a production-grade AIOps platform like HEAL.
Step 1 — Baseline learning: The AI continuously ingests telemetry data, metrics (CPU, memory, latency, error rates), logs from applications and infrastructure, and traces from distributed transactions. Over time it builds a dynamic baseline for each signal that understands time-of-day patterns, day-of-week seasonality, deployment events, and traffic spikes. Unlike static thresholds, this baseline lives and breathes with your system.
Step 2 — Deviation scoring: Every new data point is scored against its baseline. The further a metric deviates from expected behavior, accounting for normal variance, the higher its anomaly score. This score is continuous, not binary, meaning HEAL can detect subtle early-stage anomalies long before they cross a hard threshold. This is the engine behind HEAL's 95% forecast accuracy.
Step 3 — Correlation and causality: A single anomalous metric means little. A cluster of correlated anomalies, elevated database latency, rising API error rates, and a spike in queue depth, tells a story. HEAL correlates signals across services using a live topology map to distinguish a causal chain from coincidence.
Step 4 — Enriched incident creation: Rather than firing a separate alert for every anomalous signal, HEAL groups related anomalies into a single enriched incident with probable root cause hypotheses, affected service topology, and suggested remediation steps, the mechanism behind HEAL's 60% reduction in duplicate alerts.
How HEAL Does It
HEAL's unified AIOps engine correlates signals across your entire observability stack, APM, infrastructure, logs, and business KPIs, in real time. Its models are continuously retrained on your environment's specific patterns, not generic defaults. This is why HEAL achieves 95% forecast accuracy: the model knows your system, not just systems in general.
What is "blast radius" in incident management, and why does it matter?
Borrowed from engineering, blast radius in incident management describes the scope of impact that radiates outward from a failure event. The longer a problem goes undetected or uncontained, the larger its blast radius, more services affected, more users impacted, more revenue lost.
Visualize it as a circle expanding from the moment of an anomaly event. At the center is the originating failure. As time passes and the problem propagates through service dependencies, the circle grows. Your job as an engineering team is to shrink that circle as fast as possible.
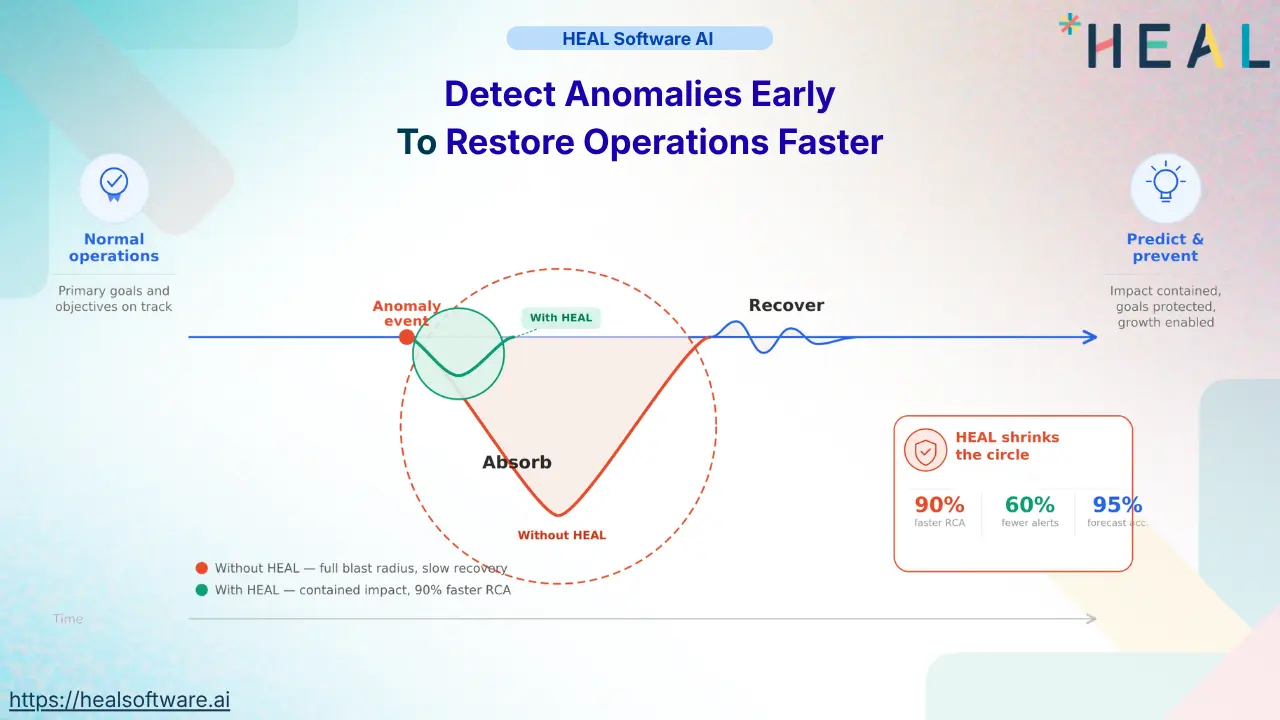
Figure: How HEAL shrinks the blast radius circle and the incident curve
The red V-shape is what happens without early detection, the system descends deep into a degraded state (the "Absorb" phase), requiring a long, expensive climb back to normal (the "Recover" phase). The large dashed circle is the blast radius: every service, user, and business metric caught within it is affected.
The green curve tells a completely different story. With HEAL detecting the anomaly at its earliest signal, the descent is intercepted before it deepens. The circle is tiny. The V is shallow. Recovery is fast. And critically, the team advances to "Predict & prevent" — making the same failure structurally impossible to repeat.
The Exponential Cost of Delayed Detection
The cost of a production incident grows exponentially, not linearly, with time-to-detect. An anomaly caught in 2 minutes might cost thousands of dollars. The same anomaly caught in 2 hours can cost millions, in lost revenue, SLA penalties, customer churn, and engineer time. Gartner estimates the average cost of IT downtime at $5,600 per minute.
Why do alert storms happen and how do you stop them?
Ask any SRE their biggest operational pain point, and alert fatigue lands in the top three every time. Alert storms are not a people problem, they are a design flaw in your monitoring architecture.
Modern distributed systems are densely interconnected. When one service fails, it triggers failures in its dependents. Each failure fires its own alert. A single root cause can spawn dozens or hundreds of alerts within seconds, most of which are symptoms, not causes. Traditional monitoring fires an alert whenever a metric crosses a fixed line. It does not know that high CPU on a batch processing node at 2 AM is expected behavior, or that a latency spike always follows a particular type of deployment. Without context, every anomaly looks like a P1 emergency.
| Scenario | Without HEAL | With HEAL |
|---|---|---|
| Database latency spike | ✗ 47 separate alerts fire across dependent services | ✓ 1 grouped incident, DB flagged as root cause |
| Scheduled batch job peak | ✗ CPU alert wakes on-call at 3 AM | ✓ Seasonal pattern recognized, no alert fired |
| New deployment causes latency | ✗ 12 alerts, no deployment context linked | ✓ Correlated to deployment event automatically |
| Slow memory leak building over hours | ✗ No alert until OOM, incident already in progress | ✓ Trend detected early before user impact |
| Network packet loss in one region | ✗ Error rates alert across 30+ services | ✓ Topology points to network, 1 incident |
HEAL's correlation engine achieves 60% fewer duplicate alerts by understanding the causal topology of your system. It groups symptoms, surfaces the probable root cause, and delivers one enriched, actionable notification, rather than a flood of noise that conditions engineers to ignore pages.
What is root cause analysis in AIOps, and why does it traditionally take so long?
Root cause analysis (RCA) is the process of identifying the original triggering condition that caused a failure, not the symptoms or downstream effects, but the actual source. In traditional incident response, RCA is often the most time-consuming and expensive phase.
Why traditional RCA is slow:
- Engineers manually query logs across dozens of services, one system at a time
- Context is fragmented — metrics in one tool, logs in another, traces in a third, deploy events in a JIRA nobody checks during an incident
- Alert storms create noise that buries the signal, finding the root cause means wading through hundreds of events
- No automated causal chain — teams reconstruct timelines manually from fragments
- Tribal knowledge dependency — the right person must be online to know where to look
- Post-incident learning is lost — the same root cause recurs because context is never preserved
What AI-powered RCA delivers:
- Automatic correlation of anomalous signals across the full observability stack — metrics, logs, traces, events
- Causal graph construction — tracing the propagation path from symptom back to source
- Deployment and change event integration — incidents linked to recent changes automatically
- Natural language incident summaries delivered with the alert — zero context-gathering required
- Runbook recommendations based on similar historical incidents
- Continuous learning — every incident makes future RCA faster and more accurate
HEAL's 90% Faster RCA
HEAL reduces root cause analysis time by 90% by automating the correlation, causal chain construction, and context assembly that engineers previously performed manually. When an alert fires, engineers arrive with a diagnosis, not a blank slate. The investigation is already done before the first war-room call opens.
What machine learning techniques are used in AIOps anomaly detection?
This question appears constantly in technical forums and vendor evaluations. Here is an honest breakdown of the techniques that matter in production environments and that HEAL orchestrates together.
Time-series forecasting
Models like ARIMA, Prophet, and LSTM networks learn the expected shape of your metrics over time, accounting for seasonality, trends, and periodicity. Deviations from forecast trigger anomaly scoring.
Isolation Forest
An unsupervised algorithm that detects outliers by randomly partitioning data. Anomalous points are isolated faster, requiring fewer partitions, making it efficient for high-dimensional telemetry streams.
Autoencoders (deep learning)
Neural networks trained to compress and reconstruct normal data. When reconstruction error spikes, it signals an anomalous pattern the network never learned, invisible to threshold-based systems.
Graph neural networks
Service dependency graphs are relational. GNNs model your architecture topology to detect when failure propagation patterns deviate, enabling true causal chain tracing across microservices.
Statistical process control
CUSUM algorithms detect gradual drifts that threshold alerts miss entirely, ideal for slow memory leaks, gradual latency degradation, and long-term capacity trends approaching a cliff.
NLP for log analysis
Log anomaly detection through models that learn normal log templates and flag deviations, unknown error codes, new stack trace patterns, unusual API paths, without any manual rule authoring.
HEAL orchestrates multiple models per signal type and uses ensemble scoring to combine outputs, applying this multi-model approach across metrics, logs, traces, and topology simultaneously. This is why HEAL's detection accuracy far exceeds single-algorithm alternatives.
Traditional monitoring versus AIOps anomaly detection and what is the real difference?
Teams evaluating whether their existing Prometheus/Grafana/PagerDuty stack is sufficient ask this constantly. Here is the honest comparison most vendor marketing omits.
| Capability | Traditional Monitoring | HEAL AIOps |
|---|---|---|
| Anomaly detection | ✗ Static thresholds only | ✓ Dynamic, ML-powered baselines per entity |
| Unknown failure modes | ✗ Only alerts you wrote rules for | ✓ Detects novel failure patterns automatically |
| Alert deduplication | ✗ Every metric fires independently | ✓ 60% fewer alerts via topology correlation |
| Root cause analysis | ✗ Manual, hours-long investigation | ✓ Automated — 90% faster |
| Seasonal awareness | ✗ Same threshold 24 hours a day | ✓ Time-of-day and day-of-week aware |
| Causal correlation | ✗ Each alert is independent | ✓ Service topology-aware causality mapping |
| Proactive detection | ✗ Reacts after the problem exists | ✓ Predicts before impact — 95% accuracy |
| Log anomaly analysis | ✗ Manual regex rules | ✓ NLP-powered pattern detection |
| Deployment correlation | ✗ Manual cross-referencing required | ✓ Automatic change event linking |
| Continuous improvement | ✗ Rules are static — never learn | ✓ Models retrain continuously on your data |
The gap is not about features alone, it is about operational posture. Traditional monitoring locks teams into a permanently reactive mode where every incident is a surprise. HEAL shifts your team from firefighters to architects, spending less time on incidents and more time on the work that prevents them.
How do you actually shift from reactive incident response to proactive prevention?
This is the philosophical question underneath every AIOps evaluation. The journey maps directly to the five operational phases visible in HEAL's blast radius model.
-
1
Normal operations — primary goals on track
Your baseline state. Systems run as designed. Teams have visibility through dashboards, but mostly check them manually. Problems are discovered when users complain, reactive by default.
-
2
Anomaly event — the inflection point
Something deviates from baseline. Without AIOps, this goes unnoticed until it cascades into a full incident. With HEAL, detection happens at the earliest signal — before the descent begins. The moment of detection determines everything that follows.
-
3
Absorb — the V-shape descent
Without early detection, systems absorb the full impact. The V descends deep, blast radius expands. With HEAL, the V is intercepted early — the descent is shallow, impact is contained. This is HEAL shrinking the circle.
-
4
Recover — root cause identified, operations restored
HEAL's automated RCA means recovery is 90% faster. Engineers know what broke, why, and what to do before the first war-room call. Recovery becomes execution, not investigation.
-
5
Predict & prevent — impact contained, goals protected, growth enabled
With 95% forecast accuracy, HEAL flags anomalies before they become incidents. The blast radius never forms. Teams operate with confidence — and IT becomes a growth enabler, not a risk constraint.
How does HEAL Software specifically solve anomaly detection and why is it different?
By now the problem space is clear. Here is precisely how HEAL addresses every dimension of it and why the numbers embedded in its blast radius model represent operational outcomes, not marketing claims.
Unified observability — one platform, full stack: HEAL unifies all observability signals into a single correlation engine. When an anomaly is detected, HEAL has already assembled the full picture — metrics, logs, traces, topology, and recent deployment events — before the alert reaches an engineer. No more fragmented tooling, no more manual cross-referencing.
Dynamic baselines per entity: HEAL does not apply one-size-fits-all baselines. Every service, every node, every metric gets its own continuously updated model that accounts for that entity's unique behavior patterns. A payment processing service and a recommendation engine have completely different traffic profiles and failure modes — HEAL models them individually and precisely.
Topology-aware correlation: HEAL maintains a live service dependency map. When anomalies are detected, they are mapped against the topology to determine propagation paths. This is how HEAL converts 47 symptom alerts into 1 root-cause incident — by understanding that all downstream anomalies trace back to a single upstream failure in the causal graph.
Continuous learning from your environment: HEAL's models retrain continuously on your specific telemetry. Every incident, every false positive, every resolved alert contributes to a more accurate understanding of what "normal" looks like for your system. HEAL gets more accurate for your system over time — not just systems in general.
The Compounding Effect
90% faster RCA × 60% fewer alerts × 95% forecast accuracy does not just make incidents less painful. It returns the cognitive bandwidth that engineers currently spend on toil — freeing them to build, improve, and innovate. That is the business case for HEAL: operational excellence as a growth enabler.
What metrics prove that your AIOps anomaly detection is actually working?
This is the question every engineering leader asks before approving an AIOps investment and the right question to ask. Here are the metrics that matter and what good looks like.
Mean Time to Detect (MTTD): How long does it take from the moment an anomaly begins to the moment your team knows about it? Without AIOps, MTTD is measured in minutes to hours. With HEAL's predictive detection, it is measured in seconds and frequently fires before the anomaly is visible in user-facing metrics.
Mean Time to Resolve (MTTR): MTTR encompasses detection, investigation, diagnosis, and remediation. The 90% faster RCA delivered by HEAL compresses the investigation and diagnosis phases, the most time-consuming parts of any major incident. An MTTR that previously averaged four hours can drop to under 30 minutes.
Alert-to-incident ratio: In a well-tuned AIOps environment, every alert should correspond to a real, actionable issue. A 10:1 ratio — ten alerts per actual incident, indicates significant noise. HEAL drives this ratio toward 1:1 by grouping and correlating aggressively. The 60% alert reduction is the measurable output of that principle.
Repeat incident rate: How often does the same root cause recur? A high repeat rate indicates that RCA is surfacing symptoms, not sources. HEAL's causal chain analysis and incident history indexing directly attack this, ensuring the actual source is identified, documented, and remediated every time.
Forecast accuracy: The percentage of detected anomalies predicted by the model before they caused user impact. HEAL's 95% forecast accuracy means that 19 out of 20 anomalies are caught in the predictive phase, before the blast radius circle begins to expand.
Ultimately, the most important metric is the hardest to quantify: engineering confidence. Teams operating with HEAL describe a fundamental shift in how they relate to production systems, from persistent anxiety and constant manual vigilance to earned trust. They know anomalies will be caught, blast radius will be contained, and when something does go wrong, the diagnosis will be waiting before they open their laptops.
That is not just operational improvement. That is a fundamentally different way to run engineering at scale — with goals protected, operations stabilized, and growth enabled.
The Numbers Tell the Story
The impact of deploying HEAL Software is quantifiable and consistently validated across enterprise deployments:
- 90% faster root cause analysis, compressing detection-to-diagnosis from 45 minutes to under 5 minutes
- 60% reduction in duplicate alerts, turning thousands of daily signals into dozens of actionable, enriched incidents
- 95% forecast accuracy, catching anomalies in the predictive phase before users are ever impacted
- 40% reduction in escalation volume, ensuring senior engineers focus on genuinely complex problems
- 30% reduction in operational costs through automation of repetitive incident response tasks
- Measurable improvement in engineer satisfaction and retention, addressing the burnout that alert fatigue accelerates
These are not aspirational projections. They are outcomes consistently achieved by HEAL customers across financial services, banking, telecommunications sectors.
About HEAL Software
HEAL Software is a renowned provider of AIOps (Artificial Intelligence for IT Operations) solutions. HEAL Software's unwavering dedication to leveraging AI and automation empowers IT teams to address IT challenges, enhance incident management, reduce downtime, and ensure seamless IT operations. Through the analysis of extensive data, our solutions provide real-time insights, predictive analytics, and automated remediation, thereby enabling proactive monitoring and solution recommendation. Other features include anomaly detection, capacity forecasting, root cause analysis, and event correlation. With the state-of-the-art AIOps solutions, HEAL Software consistently drives digital transformation and delivers significant value to businesses across diverse industries.
Ready to see what this looks like in your environment?
HEAL Software helps IT leaders turn operational complexity into clarity, without adding to the stack.