How Can We Help?
The Signals Tab consolidates different types of signals in one location, enabling users to filter, sort, and download the list with ease. This feature is particularly beneficial for operations teams, as it aids in understanding issues affecting their applications and service landscape.
Within the Signals Tab, you can:
- View a list of generated signals, including Problems, Early Warnings, and Info Signals
- Identify the type, severity, status, and description of each signal
- See the affected applications and services for each signal
- Filter signals based on criteria such as timestamp, type, severity, and status
- Download signal details in .csv format.
Signals Navigation
To access HEAL Signals, sign in to the HEAL UI and select the Signals Tab. In the Signals List screen, choose either Lead Signals or Info Signals to view the details of the respective signals.
Accessing Lead Signals
After choosing Lead Signals from the Signals List screen, an overview of all relevant Lead Signals, including Problems and Early Warnings, will be displayed as shown below.
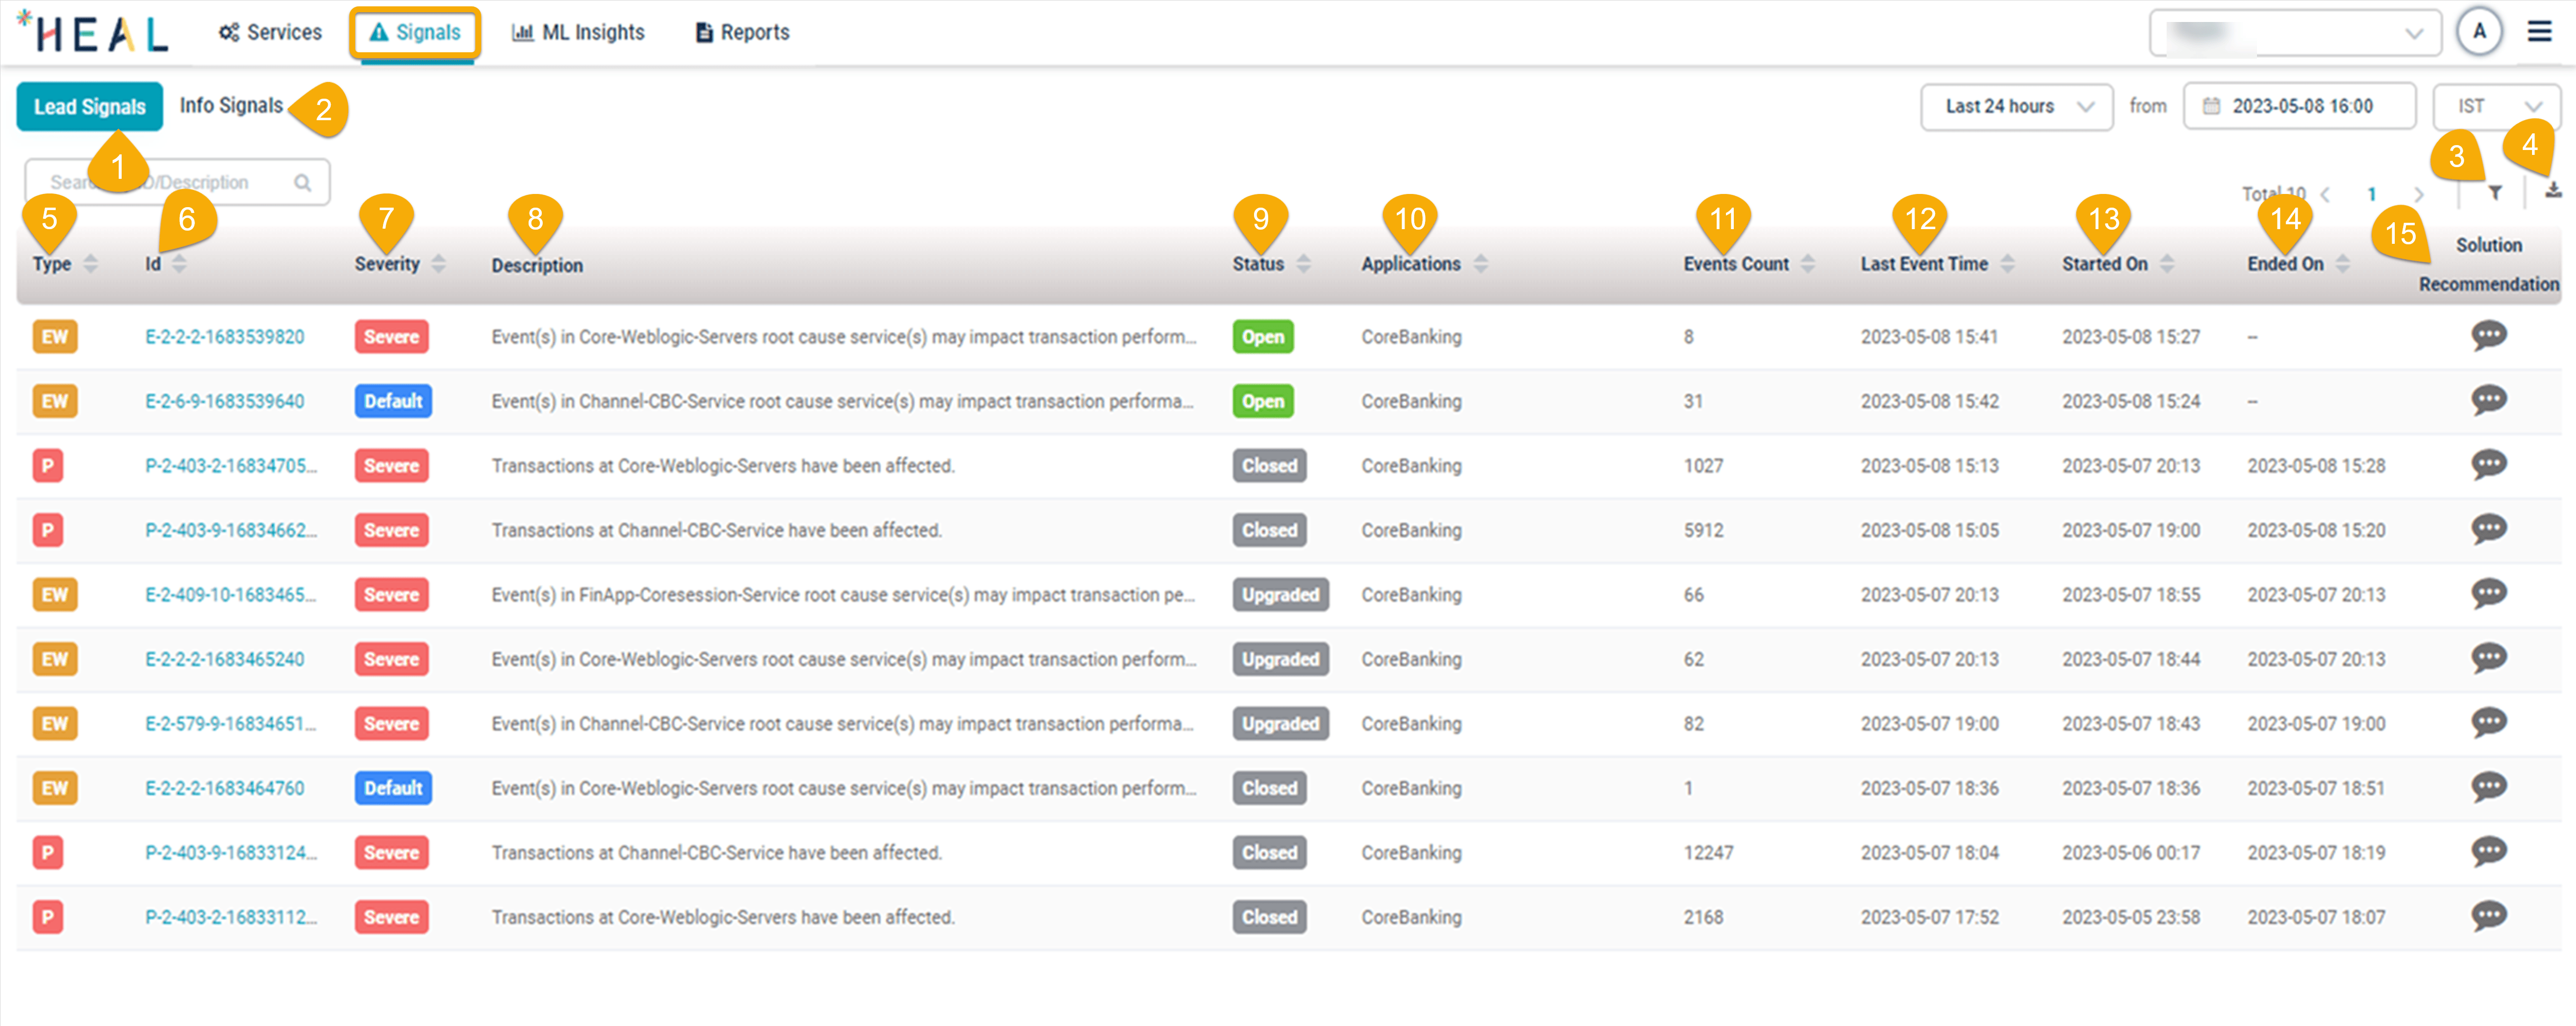
Lead Signals
| Field | Description | Documentation Link |
|---|---|---|
| 1 – Lead Signals | Indicates whether the system is experiencing Early Warnings or Problems, providing users with real-time information on service behavior and transaction performance. | Lead Signals |
| 2 – Info Signals | Provide notifications on system changes that do not directly impact performance or availability. They offer valuable information on Info KPIs, allowing users to stay informed and make necessary adjustments as needed. | Info Signals |
| 3 – Filter | Click on the filter icon to apply specific filtering criteria to the displayed signals. | Filtering Signals |
| 4 – Download | Select the download icon to export signal details in .csv format. | |
| 5 – Signal Type | Indicates whether the signal is a Problem (P) or an Early Warning (EW). | Problem |
| 6 – Signal Id | Displays a unique identifier for each generated signal. | |
| 7 – Severity | Specifies the severity of the signal, either Severe or Default. | HEAL Signal Severity |
| 8 – Description | Provides a description of the signal, including affected applications and services. | |
| 9 – Status | Shows the current status of the signal, which can be Open, Closed, or Upgraded. | Status of Signal |
| 10 – Affected Applications | Lists the applications associated with affected services. Each signal displays the application the impacted service belongs to, as well as a list of applications that downstream services for that service belong to. | |
| 11 – Events Count | Displays the total number of events generated within a signal. | |
| 12 – Last Event Timestamp | Indicates the date and time of the last event occurrence. | |
| 13 – Signal Occurrence Timestamp | Shows the date and time when the signal was first generated. | |
| 14 – Signal Closure Timestamp | Displays the date and time when the signal was closed. | |
| 15 – Solution Recommendation | Displays the top three potential solutions for addressing the root cause of a generated Signal (Problem or Early Warning), allowing users to quickly assess and address the issue while providing a platform for feedback on the effectiveness of the proposed solutions. | Solution Recommendation |
Accessing Info Signals
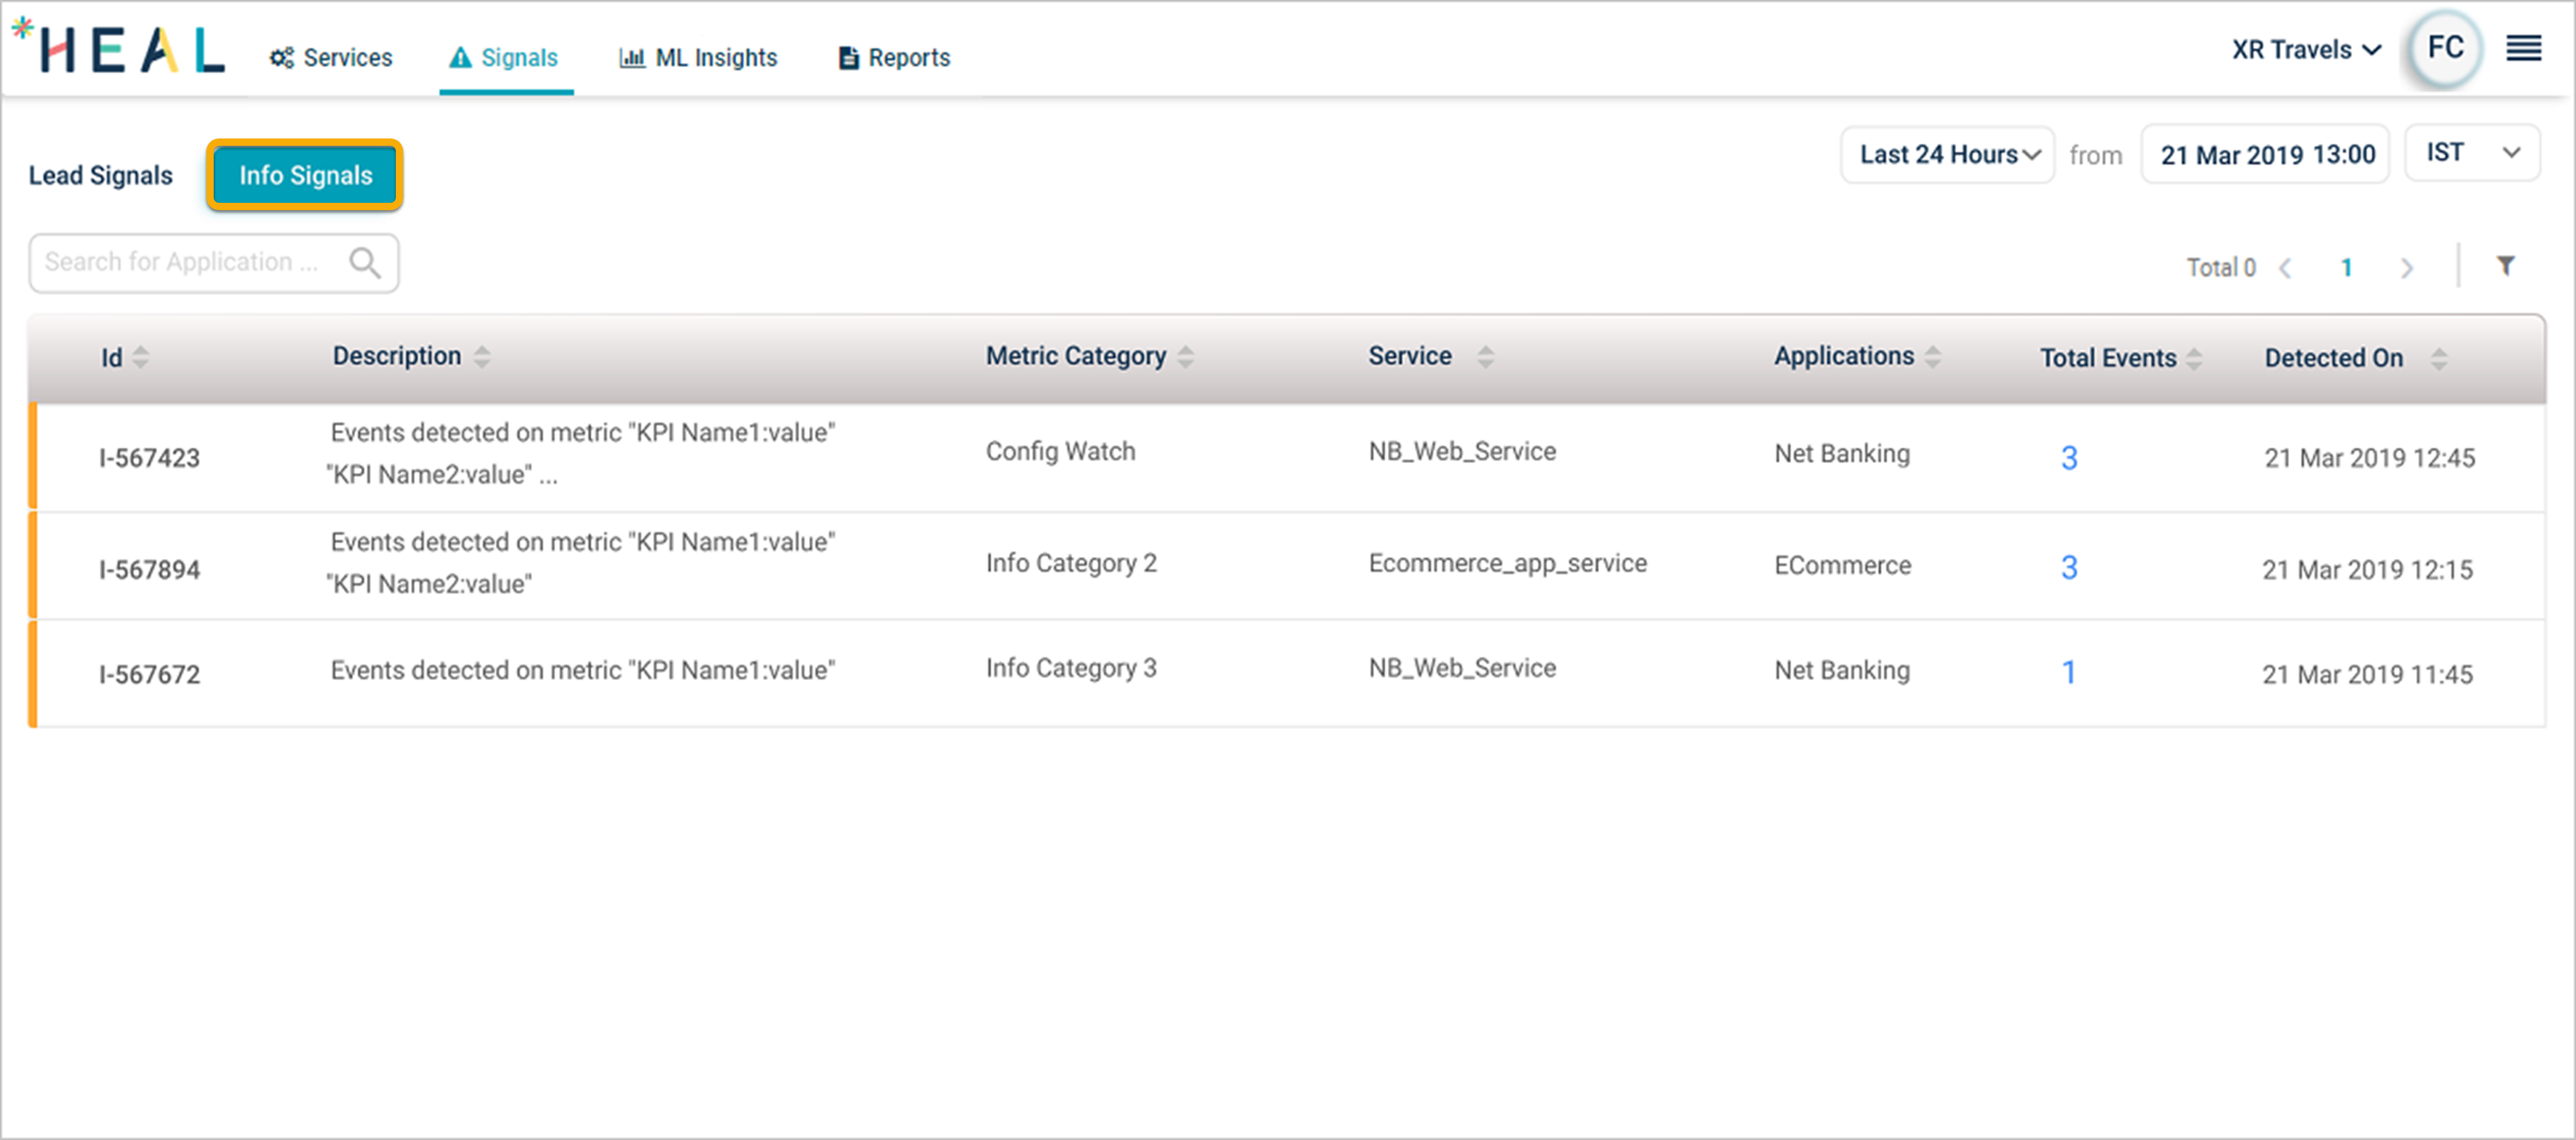
After choosing Info Signals from the Signals List screen, an overview of all relevant Info Signals will be displayed as shown below.
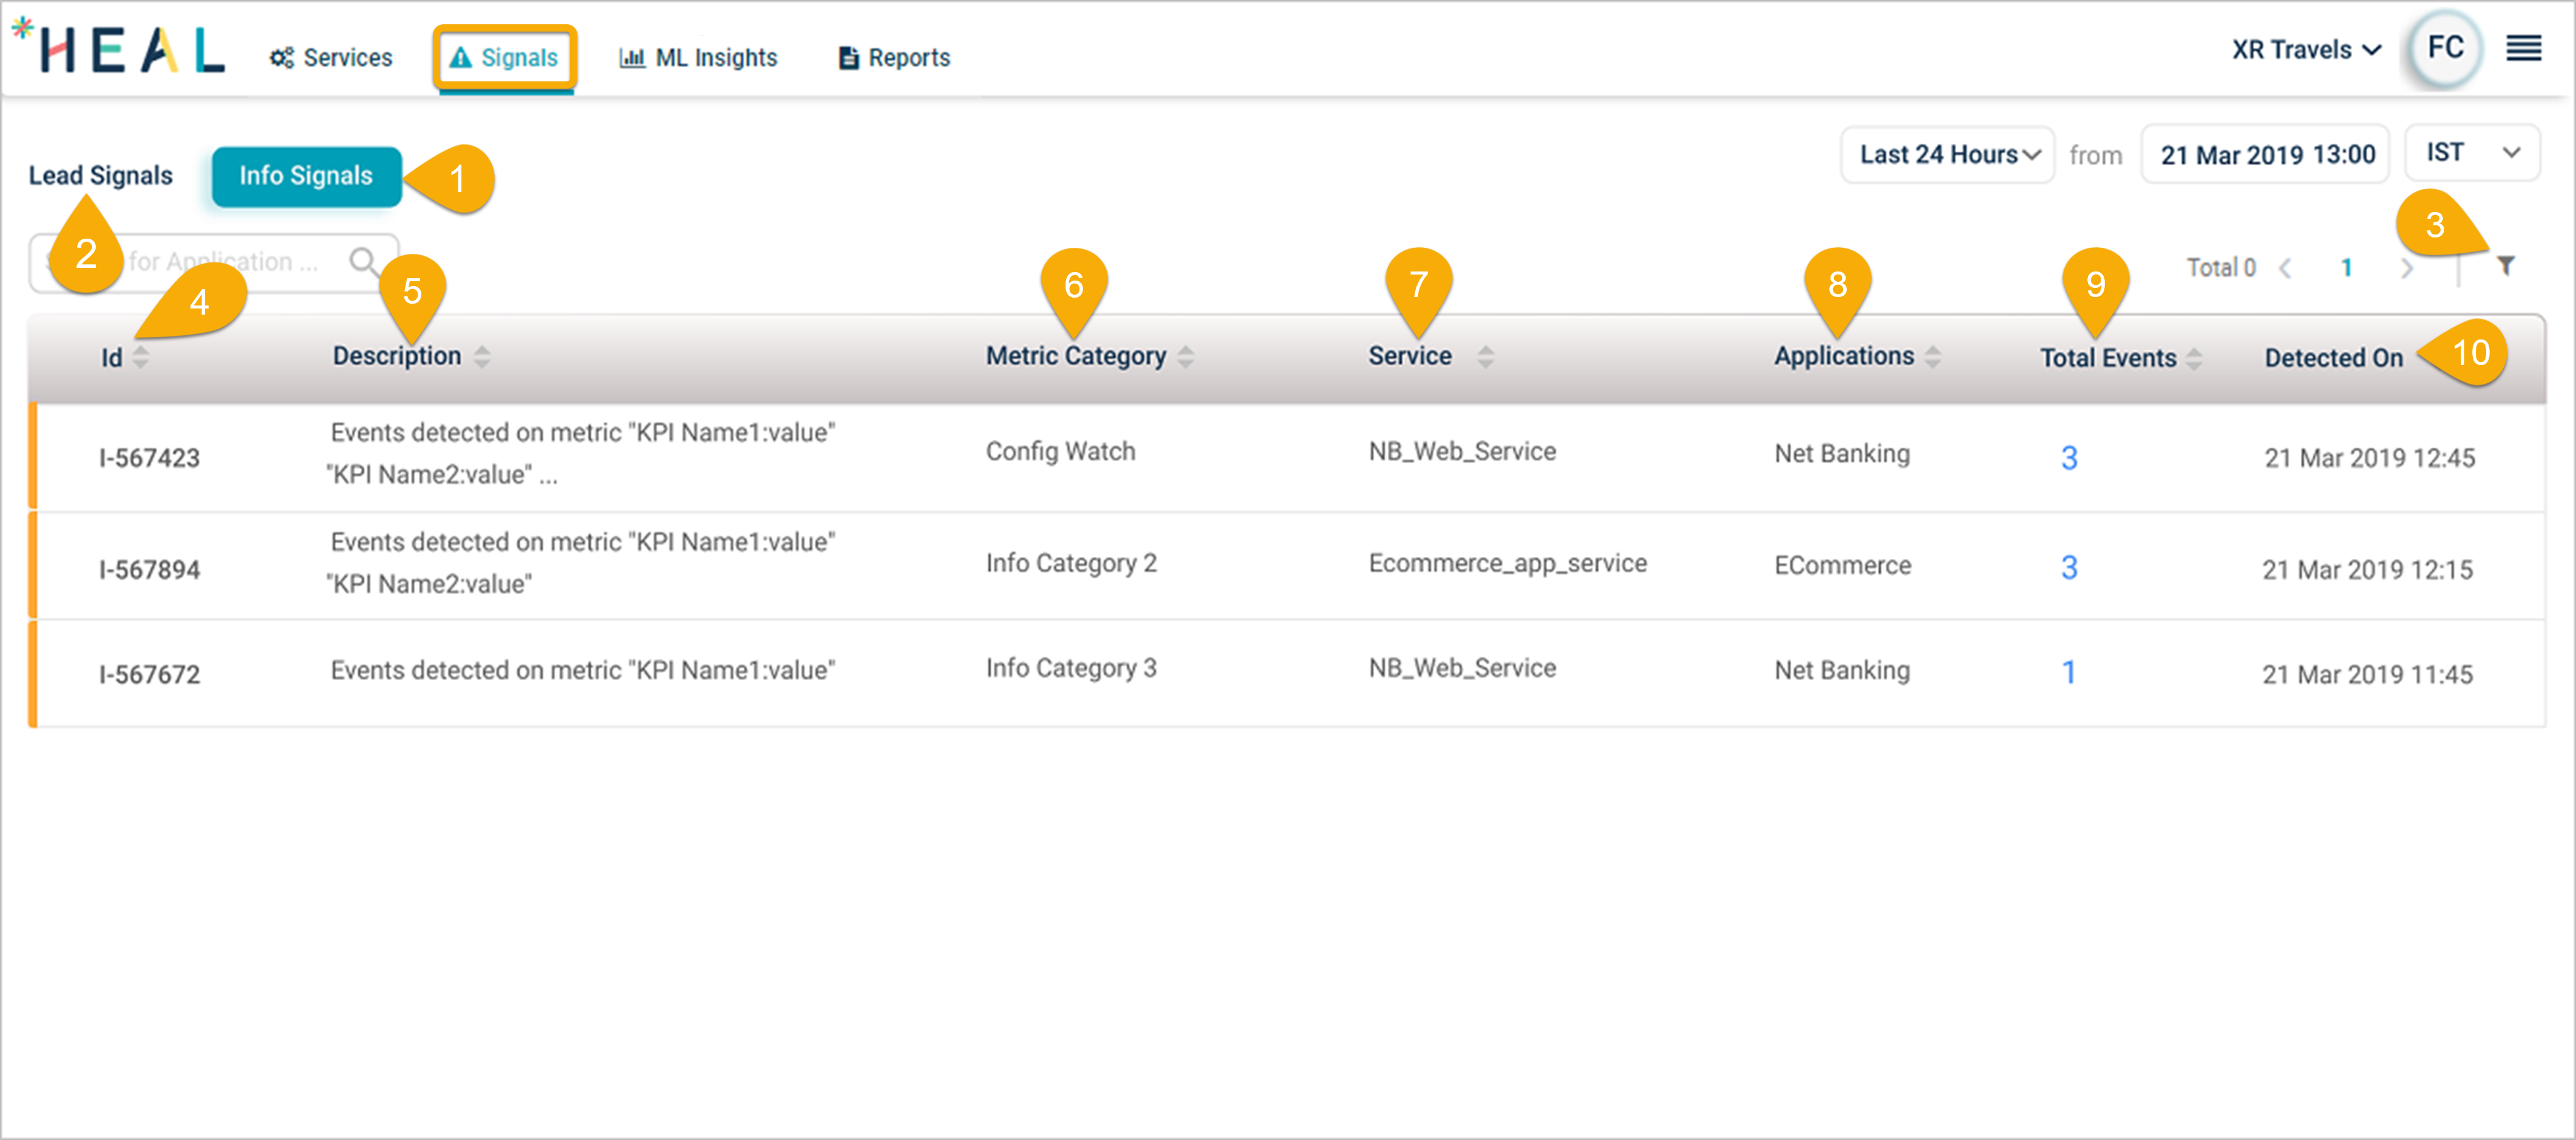
Info Signals
| Field | Description | Documentation Link |
|---|---|---|
| 1- Info Signals | Provide notifications on system changes that do not directly impact performance or availability. They offer valuable information on Info KPIs, allowing users to stay informed and make necessary adjustments as needed. | Info Signals |
| 2 – Lead Signals | Indicates whether the system is experiencing Early Warnings or Problems, providing users with real-time information on service behavior and transaction performance. | Lead Signals |
| 3 – Filter | Click on the filter icon to apply specific filtering criteria to the displayed signals. | Filtering Info Signals |
| 4 – Signal Id | Displays a unique identifier for each generated signal. | |
| 5 – Description | Provides a description of the signal, including affected applications and services. | |
| 6 – Metric Category | Indicates the metric category to which the signal is related, providing insights into the specific performance or availability aspect being affected. | |
| 7 – Service | Specifies the service(s) impacted by the signal, allowing users to identify the source of the issue. | |
| 8 – Applications | Lists the applications associated with affected services. Each signal displays the application the impacted service belongs to, as well as a list of applications that downstream services for that service belong to. | |
| 9 – Total Events | Provides the Info events for the respective Info Signal. | |
| 10 – Detected On | Shows the date and time when the signal was first detected. |
Types of Signals
HEAL provides several types of signals to help users understand and react to different events occurring within the system. In this section, we will describe the different types of signals and their purposes in detail.
Lead Signals
These signals provide early detection of potential issues within the system. They are categorized into two types:
Early Warning
An Early Warning signal is triggered when one or more services exhibit abnormal behavior, but transactions at entry point services remain unaffected. Transactions or request volume breaches are considered Early Warnings. Early Warning is a proactive alerting mechanism that generates diagnostic data for users to remediate the underlying cause before it escalates to a Problem, i.e., a slowdown in end-user transactions. An Early Warning is treated as severe when at least one anomaly is marked as severe. Admins can use the Control Center to specify if a particular anomaly should be marked as severe.
Problem
A Problem signal occurs when one or more services exhibit abnormal behavior, and transactions at entry point services either fail or slow down (timed out and unknown transactions are considered as failures). Problems are a set of related incidents that may share a common cause or impact end users through transaction slowdowns or failures. A Problem is treated as severe when at least one anomaly contained is marked as severe.
Info Signals
Info Signals are a distinct type of signal, separate from Problems and Early Warnings. Info events differ from other events as they are not used in the timeline of a Problem or an Early Warning.
Info Signal Generation
When HEAL raises an event on Info Key Performance Indicators (KPIs), that event becomes part of an Info Signal. All users assigned to the application receive the notification automatically. Info KPIs do not directly impact the performance and availability of the system; changes in these KPIs serve more as informational updates than events.
Info Metric Categories
You can create Info metric categories using the Control Center. All metrics belonging to Info metric categories are called Info metrics. Info metric categories are part of Info Signals, while other metric categories are part of Lead Signals. HEAL monitors Info KPIs at regular intervals and generates an Info Signal when it detects an event on the Info KPIs. Notifications are sent to respective users, who can choose which Info alerts they want to receive.
HEAL Signal Severity
HEAL classifies Signals into two categories: Severe or Default. This classification helps users prioritize their response and remediation efforts based on the severity of the issue. In this provides detailed explanation of each signal type to facilitate better understanding and decision-making.
Problem Signals
Problem Signals indicate an impact on end-user transactions (or request SLAs) at one or more entry point services. They can be either Severe or Default.
Severe Problem
A Problem is marked as Severe when transactions at entry point services begin to fail, which occurs when there are events in the “Failed,” “Timed-Out,” or “Unknown” metrics for transactions.
Default Problem
A Problem is marked as Default when transactions at entry point services start to slow down, but failures remain within normal limits.
Early Warning Signals
Early Warning Signals help identify potential issues before they impact end-user transactions (or request SLAs) at any entry point service. They can be either Severe or Default.
Severe Early Warning
This signal is similar to a Default Early Warning; however, at least one event contained is considered “Severe.”
Default Early Warning
This signal is triggered when a few related events are observed, potentially affecting one or more services within an application. None of these events are considered “Severe.”
Status of Signal
The status of a signal provides information about the current state of a Problem or an Early Warning. The different statuses for Problems and Early Warnings are explained below:
Problem Status
The status of a Problem can be either Open or Closed.
Open: A Problem is given the “Open” status when it is first created.
Closed: A Problem’s status changes to “Closed” when all transaction metrics with events return to normal.
Early Warning Status
The status of an Early Warning can be Open, Closed, or Upgraded.
Open: An Early Warning is given the “Open” status when it is first created.
Closed: An Early Warning’s status changes to “Closed” when it is resolved before escalating into a Problem.
Upgraded: An Early Warning’s status is marked as “Upgraded” when requests on an entry-level service in the path are affected, indicating a potential escalation to a Problem.
Filtering Signals
HEAL allows you to filter signals based on specific criteria, enabling you to quickly find and focus on relevant signals.
Filtering Lead Signals
To filter Lead Signals based on your requirements, follow these steps:
1. Click on the filter icon in the Lead Signals section to open the filtering options, as displayed in the following screen.
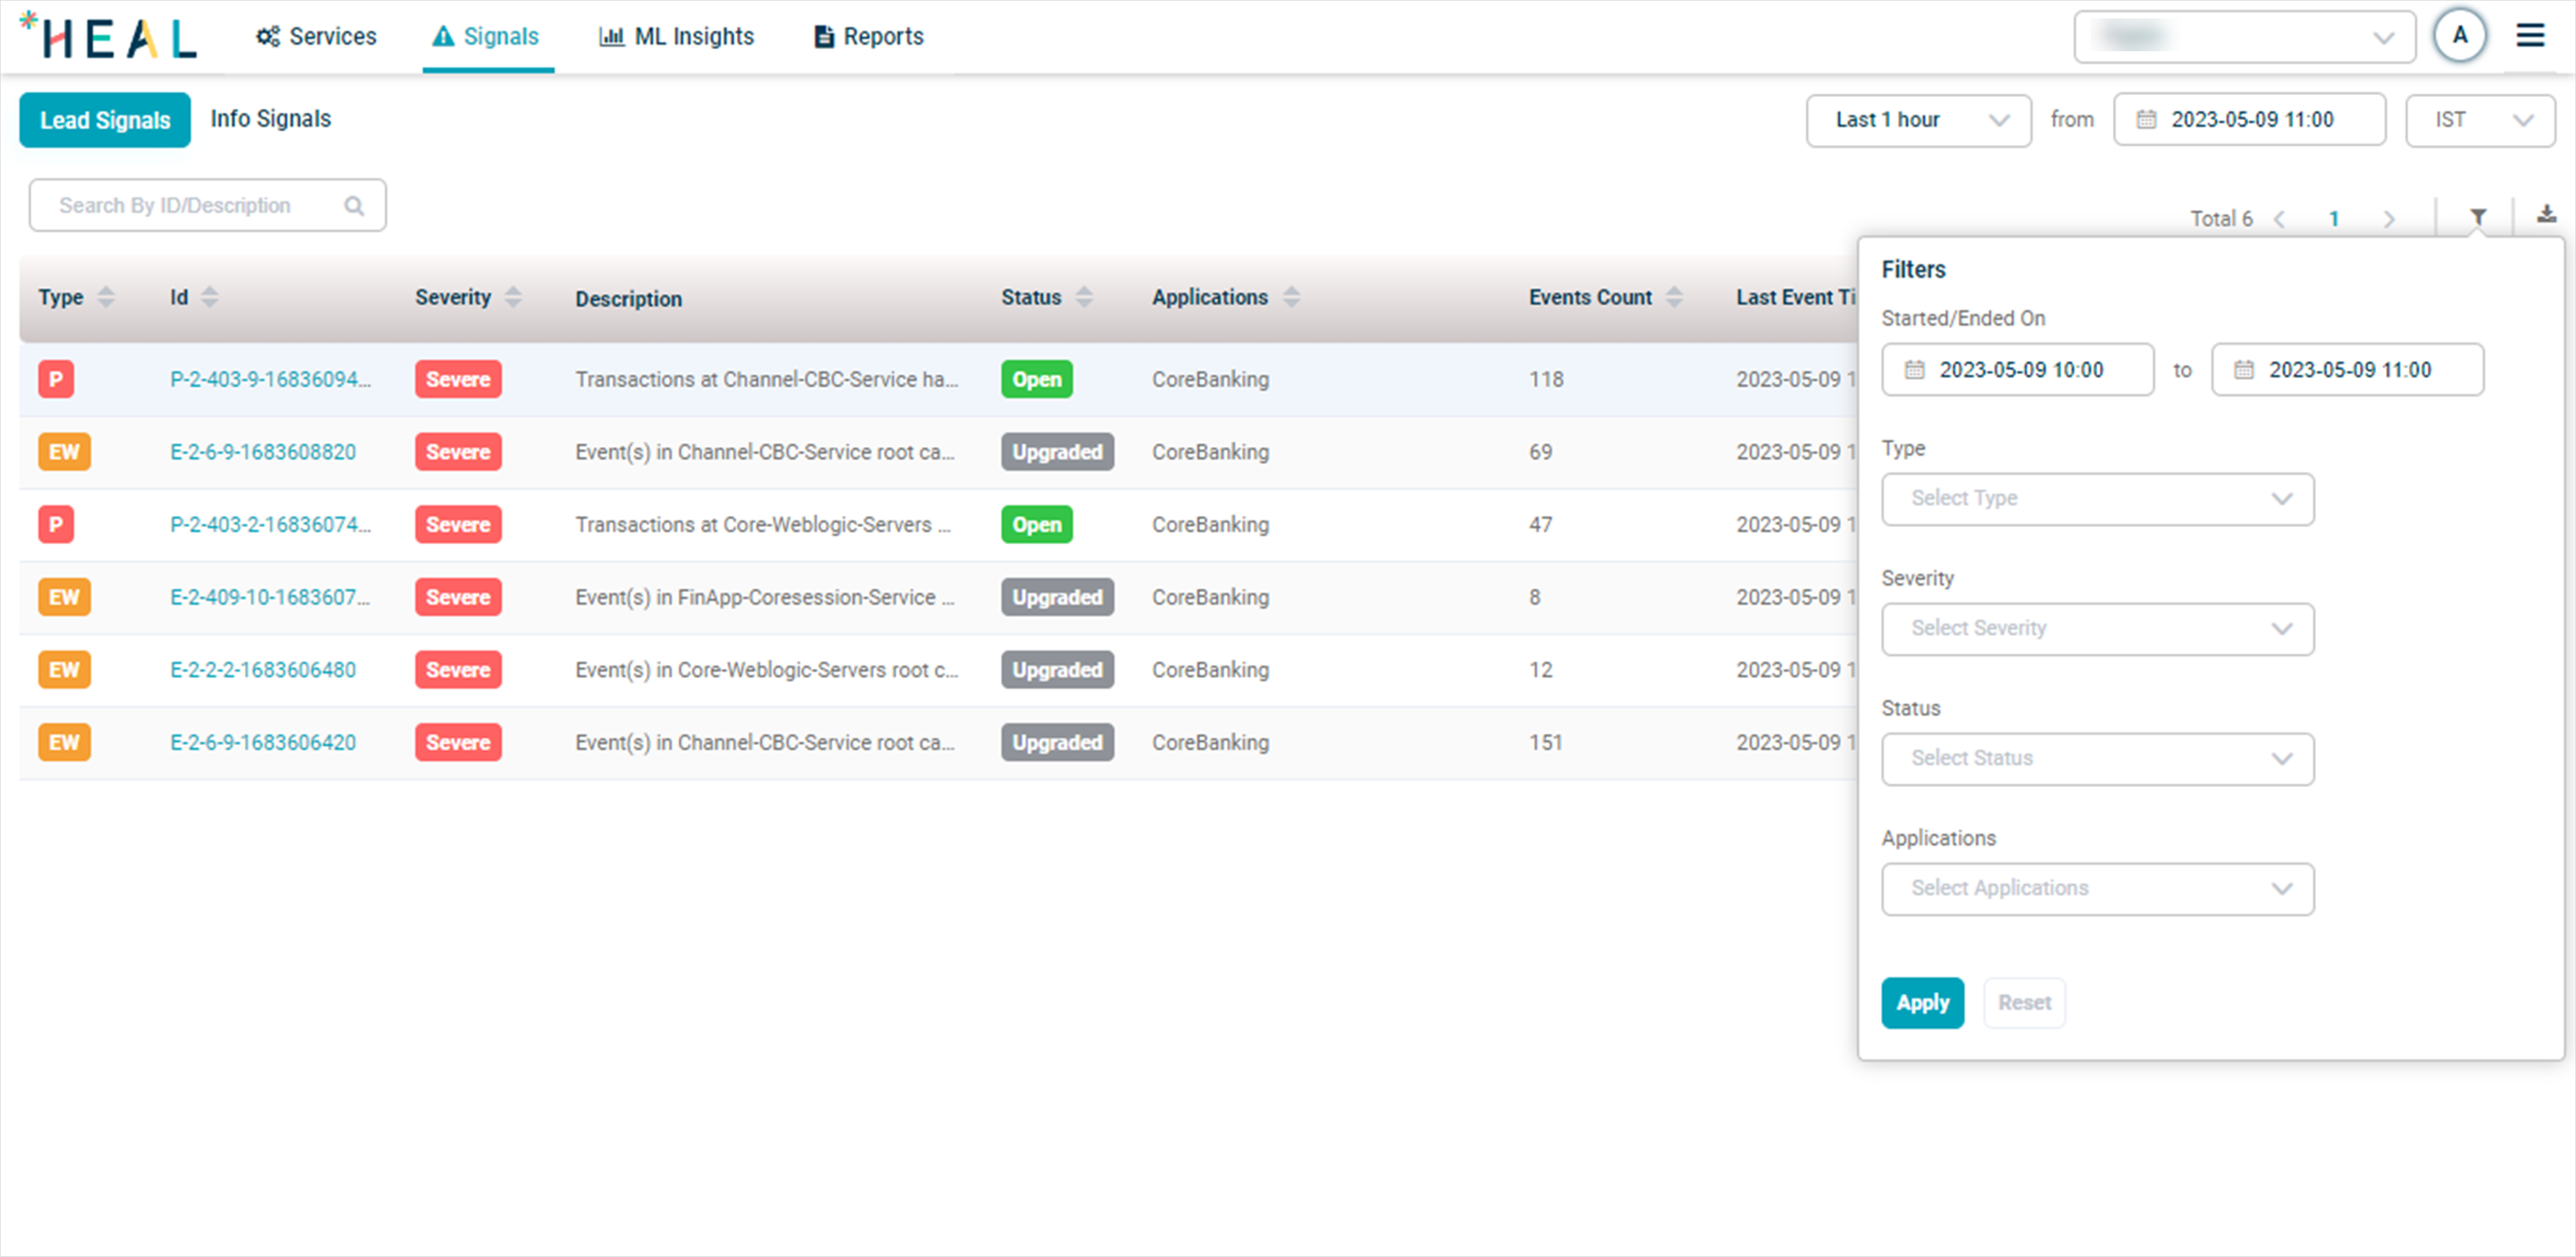
Filtering Lead Signals
2. Fill in the details for each filtering field as described below, and then click Apply:
- Timestamp: Specify a Start and End date and time to view signals that occurred within the specified time range.
- Signal Type: Choose between Problem or Warning signals to display only the selected type.
- Severity: Filter signals based on their severity, either Severe or Default.
- Status: Select the signal status as Open, Closed, or Upgraded to display signals with the chosen status.
- Applications: Narrow down the signals list by filtering based on specific applications, enabling you to concentrate on signals related to one or more selected applications in your system.
Filtering Info Signals
To filter Info Signals based on your requirements, follow these steps:
1. Click on the filter icon in the Info Signals section to open the filtering options, as displayed in the following screen.
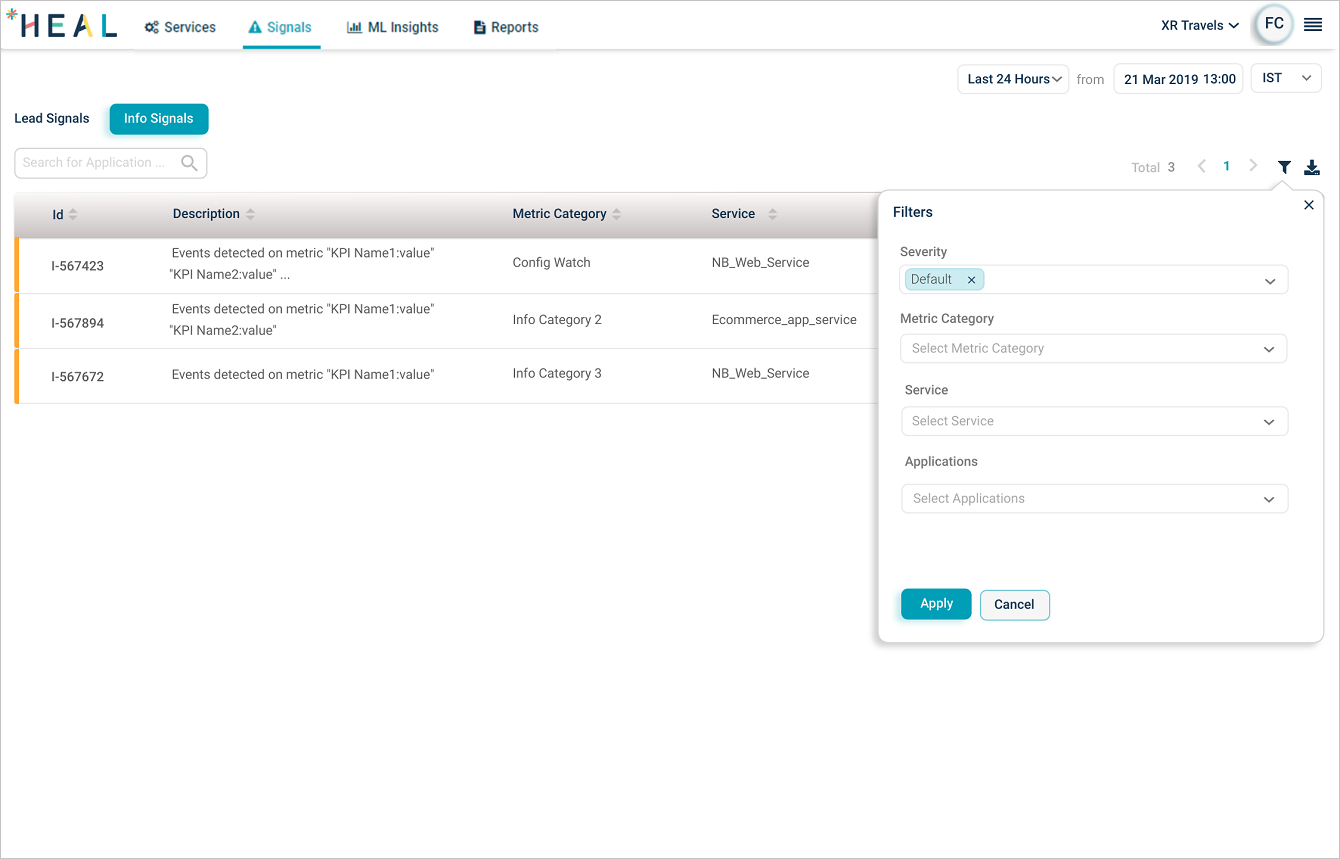
Filtering Info Signals
2. Fill in the details for each filtering field as described below, and then click Apply:
- Severity: Choose between Severe or Default signals to filter based on the severity of the issues.
- Metric Category: Select the desired metric category to display signals related to specific performance or availability metrics.
- Service: Filter signals based on a specific service or services within your system to focus on issues related to those services.
- Applications: Narrow down the signals list by filtering based on one or more specific applications, enabling you to concentrate on signals related to the selected applications in your system.
By applying these filters, you can efficiently manage and prioritize your response to the various signals generated within HEAL.
Viewing Info Signals
To access and view Info Signals, follow these steps:
1. In the Signals List screen, select Info Signals to view the details of Info Signals. Refer to Signals Navigation.
Signals page
2. Click on the events count in any row to view the Info events for the respective Info Signal. Then select the instance name to navigate to the Service Details screen.
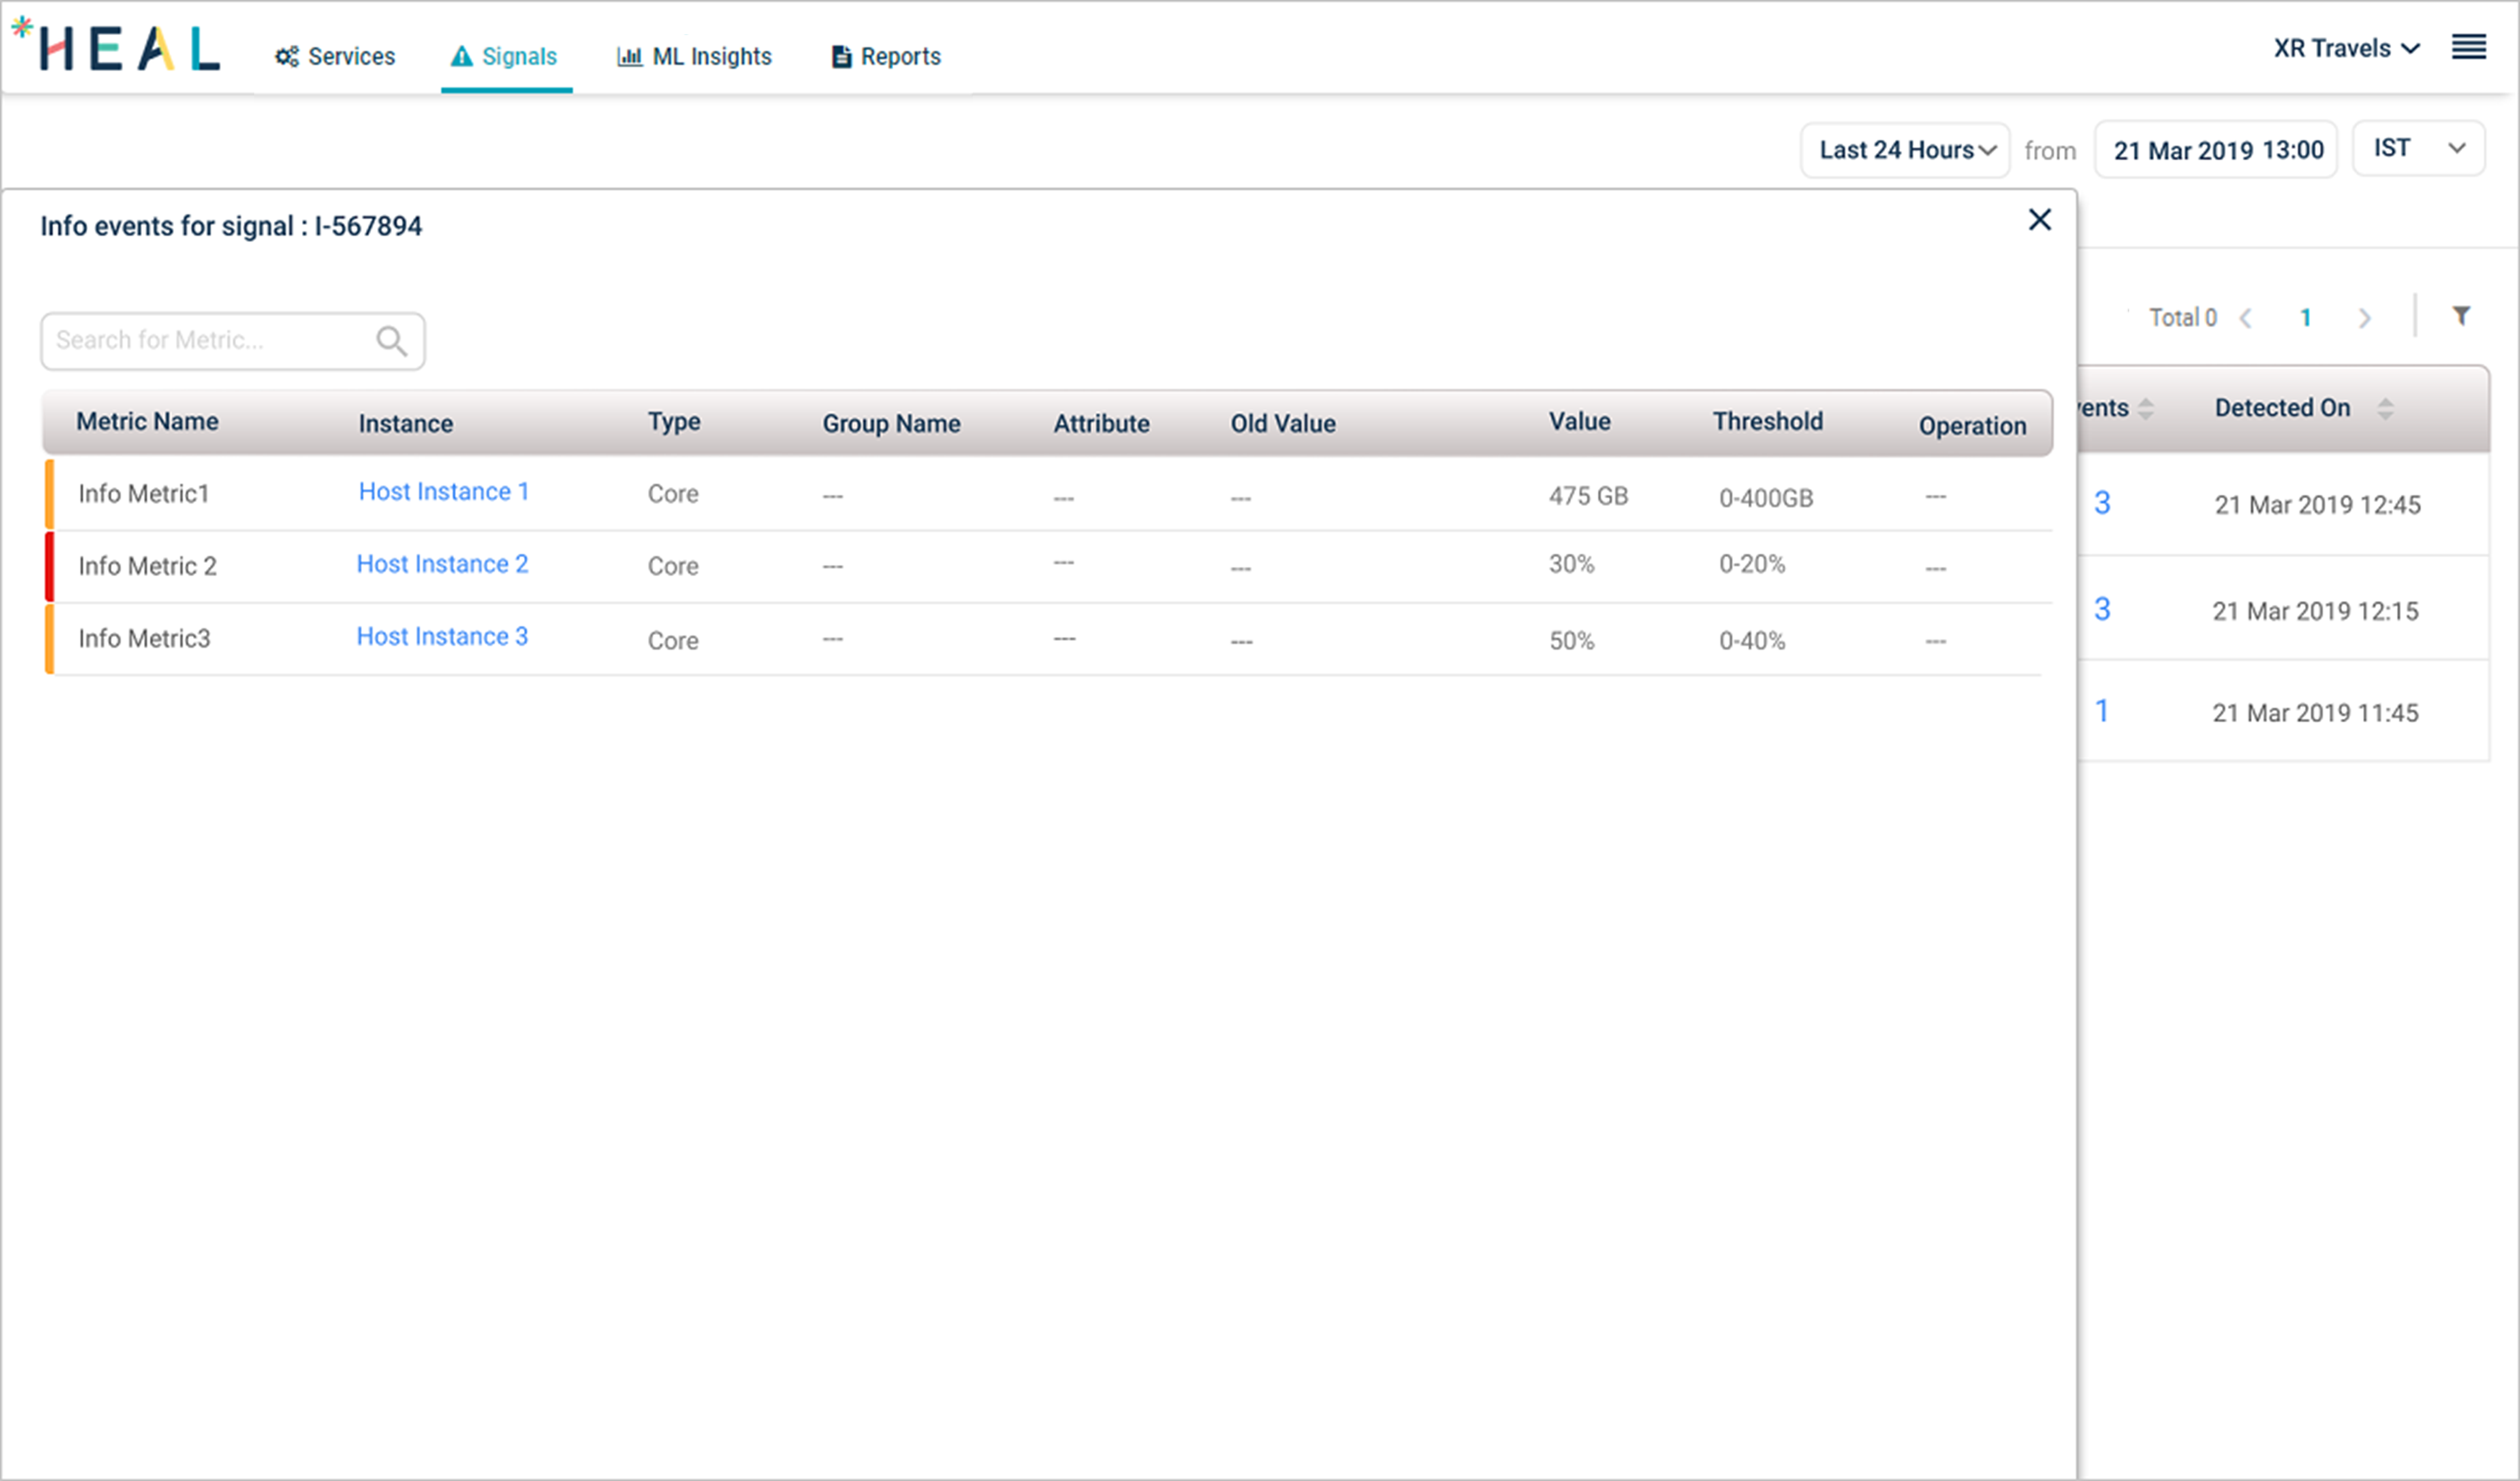
Info events page
Solution Recommendation
When HEAL creates a signal – either a Problem or an Early Warning – it also proposes the top three solutions to determine the root cause. HEAL improves problem resolution by organizing historical tickets into distinct categories, such as disk issues or database out-of-memory errors.
To view these suggested solutions, select the message icon next to the corresponding signals in the ‘Solution Recommendation‘ column. A ‘Solution Recommendation’ pop-up will display, as shown below.
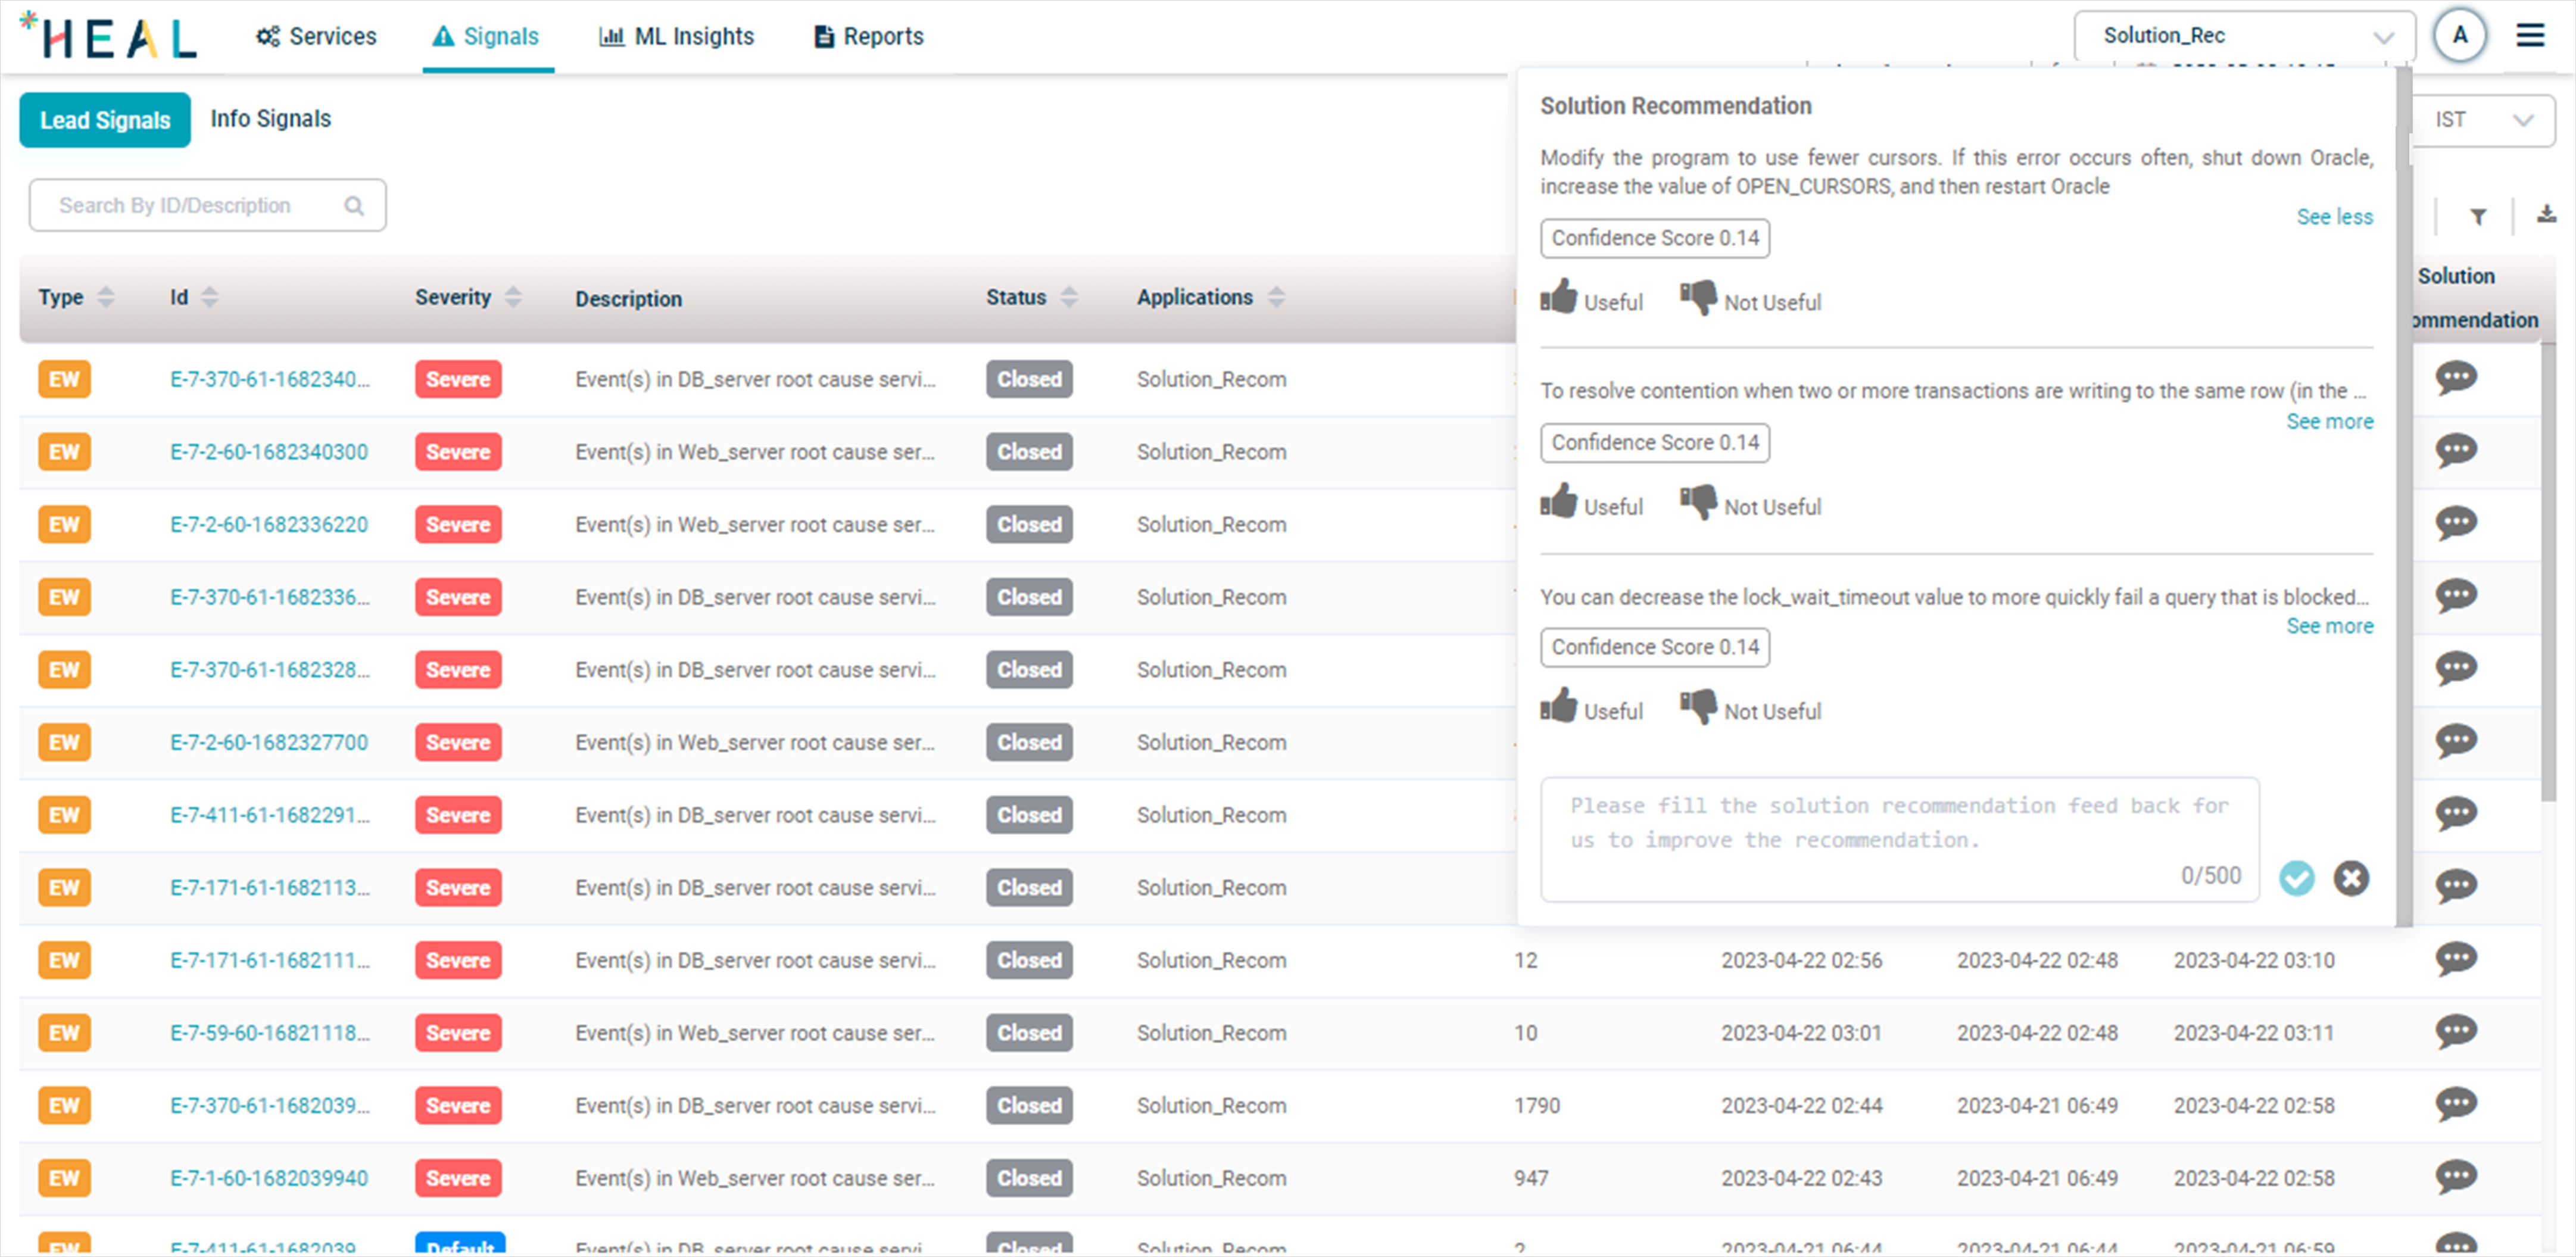
Solution Recommendations
The Solution Recommendation includes the following information:
1. Solutions: HEAL offers a solution to address the identified Problem or Early Warning (EW). Implementing these solutions should resolve the issue.
2. Confidence Score: This value represents the system’s certainty level regarding the suggested solution’s effectiveness.
3. Useful/Not Useful:
- Thumbs Up: Indicate this if the solution resolves the issue.
- Thumbs Down: Select this if the solution does not resolve the issue.
4. Feedback: Please provide feedback to enhance our recommendations.
For additional information on the suggested solutions, refer to ‘View Solution Recommendation‘ in the Problem or Early Warning (EW) Report section.