
What is HEAL Monitoring Tool? A Comprehensive Guide for IT Leaders
by Renuka Suresh | Jan 21, 2026
Introduction: The Hidden Cost of Your Monitoring Stack
Your organization has invested heavily in monitoring tools for application performance, infrastructure monitoring tools for servers and databases, log monitoring tools, network monitoring tools, and third-party monitoring tools for specific services.
But the actual problem is your IT team is drowning in that data. A single production issue generates 30+ alerts across applications, databases, servers, and monitoring tools, creating an alert flood that buries the actual problem. Your team needs experts who understand each monitoring tool, and hiring specialists costs a fortune. Even with all this investment, your engineers spend hours correlating data across tools to understand what's really happening.
These are the fundamental challenges that plague modern IT operations: unmanageable alert floods where a single incident generates duplicate notifications across tools, skyrocketing Mean Time to Identify (MTTI) as teams manually correlate data across multiple dashboards to find root causes, this elevates Mean Time to Resolve (MTTR) because even after identifying issues your team lacks intelligent guidance on remediation.
HEAL Software solves all these challenges simultaneously by transforming your existing monitoring data into intelligent, actionable insights.
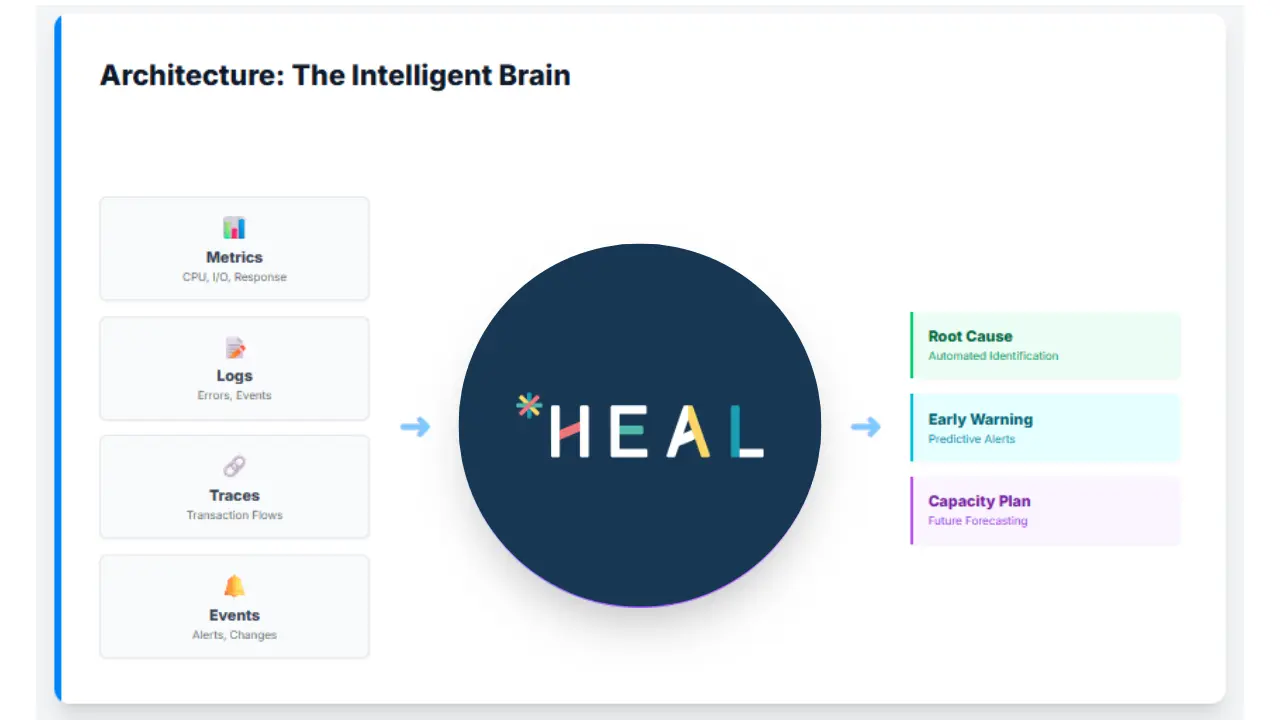
HEAL Software: Intelligence Layer for Your Monitoring Ecosystem
HEAL Software is an enterprise AIOps (Artificial Intelligence for IT Operations) platform that acts as an intelligent brain sitting on top of your existing monitoring infrastructure. The company doesn't compete with your monitoring tools it makes them exponentially more valuable by applying artificial intelligence and machine learning to the data they collect.
HEAL understands patterns, predicts problems, identifies root causes, and recommend solutions. This approach serves organizations across banking and financial services, telecommunications, technology, and healthcare, industries where operational complexity and monitoring costs are major challenges.
How HEAL Monitoring Tool Works: Data Ingestion and Intelligence
Comprehensive Data Collection from Your Existing Tools
HEAL integrates with your existing monitoring ecosystem through pre-built connectors and APIs. The platform collects four critical types of data:
Metrics flow in from your IT infrastructure directly from your servers, applications, databases, and network devices and third-party monitoring tools including application performance monitoring platforms, infrastructure monitoring systems, cloud monitoring services, and database monitoring tools. These metrics include response times, CPU utilization, memory usage, disk I/O, network throughput, transaction rates, error rates, and other data.
Logs are ingested from your infrastructure components or are already being collected by your existing log management tools including log aggregation platforms, application servers, web servers, databases, and system logs. HEAL processes structured and unstructured log data, extracting critical information about errors, warnings, system events, and application behavior.
Transaction tracescome from your APM tools, distributed tracing systems, and directly from your applications, providing detailed visibility into how requests flow through your application architecture which services are called, how long each operation takes, and where are the bottlenecks.
Events and alerts are collected from all monitoring tools, incident management platforms, and ticketing systems. This includes every alert, incident, change event, and operational activity across your environment.
The critical advantage here is consolidation. HEAL creates a unified view by ingesting data from all sources. For an IT Infrastructure Head managing dozens of tools, this centralization is transformative.
Applying AI/ML Intelligence to Your Data
Once HEAL ingests this data, the platform's AI and machine learning engines transforms raw monitoring data into operational intelligence.
Pattern Learning and Baseline Creation: HEAL's machine learning models study your environment's normal behavior patterns. The platform learns what "normal" looks like for every metric, every application, every service under different conditions peak business hours, weekend traffic, seasonal variations, post-deployment periods. They're dynamic baselines that continuously adapt as your environment evolves.
Anomaly Detection: Using these learned baselines, HEAL identifies deviations that indicate emerging problems. The platform distinguishes between normal variations (expected traffic spikes during business hours) and genuine anomalies (database response times degrading for no apparent reason). This intelligent anomaly detection reduces false positives dramatically compared to traditional threshold-based alerting.
Correlation and Pattern Recognition: HEAL AI analyzes relationships between different data points, how metrics correlate, which events are together, what sequences of activities lead to incidents. The platform builds a comprehensive understanding of your environment's behavior, dependencies, and failure patterns.
HEAL's Integrated Platform: Observability and AIOps Solutions
Now that we understand the problems HEAL solves, let's examine the platform's complete solution set.
Observability Solutions
HEAL provides observability capabilities that enhance the monitoring data you're already collecting:
Digital Experience Monitoring (DEM): While your existing monitoring tools track technical metrics, DEM focuses specifically on end-user experience. HEAL collects and analyzes actual user interactions, page load performance, transaction completion rates, error rates from the user perspective, and user journey flows. This user-centric view complements your existing technical monitoring by showing how infrastructure performance translates to customer experience.
For an Application Head trying to connect technical performance to business outcomes, DEM bridges that gap. When your e-commerce conversion rate drops, DEM shows it's because mobile users on slow networks are experiencing 12-second checkout page loads, directly connecting infrastructure issues to revenue impact.
Application Performance Monitoring (APM): HEAL's APM capabilities provide deep visibility into application behavior, distributed transaction traces, database query performance, service dependencies, and code-level insights. This works alongside your existing APM tools, either enhancing their data with additional context or providing APM visibility if you don't have dedicated APM solutions.
The key difference from standalone monitoring tools: HEAL's observability data feeds directly into the AIOps intelligence layer, where it's correlated with data from all your other monitoring sources to provide unified insights.
AIOps Solutions
This is where HEAL's true power lies, applying artificial intelligence to all your monitoring data to deliver intelligent operations:
Solution Recommendation: Beyond identifying root causes, HEAL recommends specific remediation actions based on historical resolutions, known fix patterns, and current system state. When a memory leak is detected, the platform doesn't just alert you, it recommends restarting specific services based on successful past resolutions, with expected impact and success probability.
For IT Directors, this capability captures and scales senior engineer knowledge. When experienced engineers resolve incidents, HEAL learns from those resolutions and recommends them automatically for similar future problems. This reduces resolution time and dependency on senior resources.
Early Warning: HEAL's predictive capabilities provide advance notice of emerging issues before they impact users. The platform identifies performance degradation trends, capacity constraints, and anomalous behavior patterns days or weeks before they cause incidents.
Event Correlation: As detailed earlier, this solves the alert flood problem by intelligently grouping related alerts into single incidents, reducing noise by 85-95%.
Root Cause Analysis: Automated investigation across all data sources identifies root causes in minutes instead of hours, dramatically reducing MTTI.
Predictive Analytics: Forecasting future issues based on trend analysis and pattern recognition, enabling proactive rather than reactive operations.
Capacity Forecasting and Analysis: Precise predictions of future resource needs and identification of over/under-provisioned infrastructure, delivering substantial cost savings.
Incident Management: Seamless integration with ITSM tools to automatically create, update, and track incidents with complete context from all monitoring sources.
Reduced MTTI and MTTR: The cumulative effect of all these capabilities is dramatic reduction in Mean Time to Identify (typically 60-80% reduction) and Mean Time to Resolve (typically 40-60% reduction). These aren't just metrics, they translate directly to reduced downtime costs, improved customer satisfaction, and lower operational expenses.
The Critical Business Problems HEAL Solves
Problem 1: The Expertise and Cost Crisis
The Challenge: Each monitoring tool requires specialized expertise. You need engineers who understand your APM tool's metrics and dashboards. Engineers who know how to navigate your application monitoring platform's interfaces. Log aggregation experts to query and analyze logs. Alert management specialists to manage incident workflows. Infrastructure monitoring experts to interpret server and network metrics. Hiring and retaining experts for each tool costs organizations hundreds of thousands of dollars annually. Even if you find these specialists, they work in silos, each focused on their specific tool rather than the big picture.
HEAL's Solution: With HEAL, you need a single resource who understands the HEAL platform. The platform ingests data from all your monitoring tools and presents unified insights through one interface. They need to understand HEAL's dashboard, which consolidates everything.
This dramatically reduces staffing costs and training requirements. A single HEAL-trained engineer can investigate incidents that previously required three specialists from different monitoring tools to collaborate.
The platform also captures institutional knowledge. When senior engineers identify root causes and solutions, HEAL learns from these resolutions and recommends them automatically for similar future incidents. This knowledge capture reduces dependency on expensive senior resources for routine problems.
Problem 2: Alert Flood and Noise
The Challenge: Every application, database, server, monitoring tool sends alerts independently. When a database server fails, the database monitoring tool alerts that the database is down. The application monitoring tool alerts that database connection errors are spiking. The web server monitoring tool alerts that response times are degraded. The infrastructure monitoring tool alerts that dependent services are failing. Your log aggregation platform alerts on error log spikes. Your synthetic monitoring alerts that transactions are failing.
A single root cause one database server failure just generated 30+ alerts across six different tools. Every monitoring dashboard shows red. But which alert represents the actual problem, and which are just cascading symptoms?
This alert flood creates several problems. Engineers spend time investigating duplicate alerts for the same issue. Critical alerts get buried in noise. Teams become desensitized to alerts and start ignoring them, leading to missed incidents. Incident response is chaotic because everyone is reacting to different symptoms rather than collaborating on the root cause.
HEAL's Solution: Event Correlation: HEAL's event correlation engine solves this by applying AI to group related alerts into single, meaningful incidents. The platform analyzes:
Temporal correlation: Events occurring within the same timeframe are likely related. When 30 alerts trigger within a 2-minute window, HEAL recognizes this pattern.
Topological correlation: Using its understanding of your infrastructure dependencies, HEAL knows that when a database fails, all services depending on it will report errors. The platform maps your architecture which applications connect to which databases, which services call which APIs, which servers host which applications and uses this topology to correlate dependent failures.
Pattern correlation: From historical incident data, HEAL learns which events typically occur together. If database connection pool exhaustion historically correlates with application timeout errors and container restarts, the platform recognizes this pattern.
Semantic correlation: HEAL analyzes the content of alerts and log messages. Even if alerts come from different tools using different terminology, semantic analysis identifies they're describing the same problem.
The result: instead of 30 individual alerts, your engineer receives one consolidated incident that says "Database server DB-PROD-01 is unavailable, causing failures in OrderService, PaymentService, and InventoryService. 28 related alerts have been grouped into this incident."
This reduces alert noise by 85-95% in typical deployments. For an IT Manager whose team was receiving 500 alerts daily and now receives 25-50 meaningful incidents, this transforms work from chaotic firefighting to focused problem-solving. Your engineers are immediately working on the actual issue.
The business impact is substantial. Faster incident identification (reduced MTTI), less time wasted on noise investigation, fewer missed alerts due to overload, and dramatically lower stress and burnout for operations teams.
Problem 3: Root Cause Analysis Complexity
The Challenge: Even after correlating alerts, you still need to identify the root cause. With data scattered across multiple monitoring tools, this investigation is time-consuming and requires deep expertise. Engineers must manually check application logs, review performance metrics, examine database metrics in separate monitoring tools, correlate this with recent deployments from CI/CD systems, and piece together what actually caused the problem.
This manual investigation takes hours. Junior engineers struggle without senior guidance. By the time you identify the root cause, significant business impact has already occurred.
HEAL's Solution: AI-Powered Root Cause Analysis: HEAL automates root cause investigation by analyzing the complete chain of events across all your data sources. When an incident occurs, the platform:
Examines the timeline of all metrics, logs, and events leading up to the incident, identifying the earliest anomaly that triggered subsequent failures. In a cascading failure, this distinguishes the root cause from symptoms.
Analyzes the topology of your infrastructure to understand which component failure could cause the observed symptoms. If three microservices fail simultaneously, HEAL checks their dependencies and identifies they all connect to a shared cache that failed.
Reviews recent changes by integrating with CI/CD tools, configuration management systems, and deployment platforms. The platform automatically correlates incidents with recent code deployments, configuration changes, or infrastructure modifications.
Applies machine learning models trained on your historical incidents. If similar symptoms previously correlated with specific root causes.
Checks cross-tool correlations. The platform might identify that an obscure database configuration change (visible in database logs) combined with increased traffic (visible in load balancer metrics) triggered connection pool exhaustion (visible in application metrics) a correlation requiring data from three different monitoring tools.
For a CTO focused on operational efficiency, this capability transforms MTTI from hours to minutes. An incident that previously took 3 hours to diagnose now takes 15 minutes because HEAL automatically performs the investigation that required manual correlation across multiple tools.
Problem 4: Reactive Operations and Predictive Blindness
The Challenge: Traditional monitoring is reactive. You know there's a problem when alerts fire and users complain. By then, business impact has already occurred. You're constantly firefighting rather than preventing fires.
HEAL's Solution: Predictive Analytics and Early Warning: HEAL's AI doesn't just react to problems, it predicts them before they impact users. The platform analyzes trends in metrics, logs, and events to forecast future issues days or weeks in advance.
The predictive engine identifies concerning patterns: database query times gradually increasing over two weeks, memory consumption trending upward, error rates slowly climbing. HEAL projects when these trends will cause actual problems: "Database query performance is degrading; will exceed SLA thresholds in 5 days at current rate" or "Memory utilization trend indicates server will experience out-of-memory errors within 72 hours."
This early warning provides time for planned, strategic interventions during maintenance windows rather than emergency responses during business hours. For IT Managers, this transforms operations from reactive to proactive.
Problem 5: Capacity Forecast Analysis
The Challenge: Organizations spend enormous amounts of money on IT resources. Some infrastructure is vastly over-provisioned "just in case," with servers running at 10% utilization costing tens of thousands annually. Other infrastructure is under-provisioned, leading to performance issues and emergency scaling. Traditional capacity planning relies on guesswork: rough estimates of future growth, generous safety margins, and reactive responses to capacity issues.
Without consolidated visibility across all monitoring tools, you can't accurately assess current resource utilization patterns or predict future needs. Your database team sees database capacity, your application team sees application resource needs, your infrastructure team sees server utilization but no one has the complete picture.
HEAL's Solution: Capacity Forecasting and Analysis: HEAL solves this by consolidating resource utilization data from all monitoring sources and applying AI to forecast future capacity needs with precision.
The platform analyzes utilization patterns across compute resources, storage, memory, network bandwidth, database connections, and application-specific resources. It identifies consumption trends, growth rates, seasonal patterns, and business-driven variations.
HEAL then provides specific, actionable forecasts: "Based on current growth rate of 8GB daily and seasonal patterns, database storage will be exhausted in 47 days. Recommend adding 500GB before April 15" or "Application server cluster averages 12% CPU utilization. Current provisioning of 20 servers is excessive; recommend reducing to 8 servers to save $120,000 annually without performance impact."
For CIOs managing IT budgets, this capability delivers immediate financial value:
Cost reduction through right-sizing: Identify over-provisioned resources that can be downsized or eliminated. Organizations typically find 30-40% of infrastructure is over-provisioned, representing hundreds of thousands in annual savings.
Proactive scaling: Add capacity before constraints cause performance issues, not after users complain. This prevents revenue loss from capacity-related outages.
For an IT Infrastructure Head, capacity forecasting transforms planning from reactive guesswork to strategic, data-driven decision-making. You enter budget planning meetings with precise forecasts and can confidently right-size infrastructure investments.
How HEAL Transforms Daily Operations by Role
For CTOs and CIOs
HEAL delivers the strategic visibility and cost efficiency you need to present IT as a business enabler. The platform demonstrates measurable ROI through reduced monitoring tool expert requirements (lower headcount costs), dramatic MTTI/MTTR improvements (reduced downtime costs), and capacity optimization (infrastructure cost savings of 25-40%).
For Application Heads
HEAL eliminates the complexity of managing multiple monitoring tools for your applications. When there is an issue, HEAL provides complete context from all monitoring sources in one view, accelerating development team response.
The solution recommendation capability is particularly valuable when production issues arise, your developers receive specific guidance on fixes based on similar historical issues, reducing resolution time and capturing institutional knowledge.
Digital experience monitoring connects your applications' technical performance to business metrics like conversion rates and user engagement, helping you prioritize optimization work based on actual business impact.
For IT Managers and IT Directors
HEAL transforms your team's daily operations from chaotic to controlled. The alert correlation alone eliminates 85-95% of alert noise, meaning your team addresses 25 meaningful incidents instead of investigating 500 duplicate alerts. This dramatically improves job satisfaction and reduces burnout.
Root cause analysis acceleration means fewer late-night war rooms and faster problem resolution. The predictive capabilities allow you to schedule optimization work during business hours rather than responding to emergencies.
For IT Infrastructure Heads
HEAL provides the unified visibility you need to manage complex hybrid and multi-cloud environments without becoming an expert in each platform's monitoring tools. The capacity forecasting capabilities are transformative for infrastructure planning, you make data-driven decisions about scaling, cloud commitments, and hardware refresh cycles rather than relying on guesswork.
Real-World Business Impact
Let's make this concrete with typical outcomes organizations achieve:
Cost Savings: Reduced monitoring specialist headcount. Infrastructure right-sizing and optimization: 25-40% of infrastructure costs. Prevented downtime costs through early warning: varies by industry, often $1M+.
Operational Efficiency: Alert volume reduction: 85-95% through intelligent correlation. MTTI reduction: 60-80% through automated root cause analysis. MTTR reduction: 40-60% through solution recommendations. Capacity planning accuracy: shift from reactive to 6-month predictive planning.
From Monitoring Complexity to Operational Intelligence
In an environment where digital services define business success and operational complexity continues to grow, HEAL ensures your IT operations deliver business value, not just technical dashboards.
The question isn't whether you need better monitoring, you already have that. The question is whether you're ready to transform your monitoring data into intelligent, cost-efficient operations that drive business success. That's what HEAL delivers.
About HEAL Software
HEAL Software is a renowned provider of AIOps (Artificial Intelligence for IT Operations) solutions. HEAL Software’s unwavering dedication to leveraging AI and automation empowers IT teams to address IT challenges, enhance incident management, reduce downtime, and ensure seamless IT operations. Through the analysis of extensive data, our solutions provide real-time insights, predictive analytics, and automated remediation, thereby enabling proactive monitoring and solution recommendation. Other features include anomaly detection, capacity forecasting, root cause analysis, and event correlation. With the state-of-the-art AIOps solutions, HEAL Software consistently drives digital transformation and delivers significant value to businesses across diverse industries.